INTRODUCTION
METHODS
Animal and experimental protocols
Blood serum collection
Hormone measurement
Postprandial glucose measurement and glucose tolerance test
Histological analysis
Data analysis
RESULTS
Impact of p110αβ deletion in SF1 cells on survival and glucose homeostasis
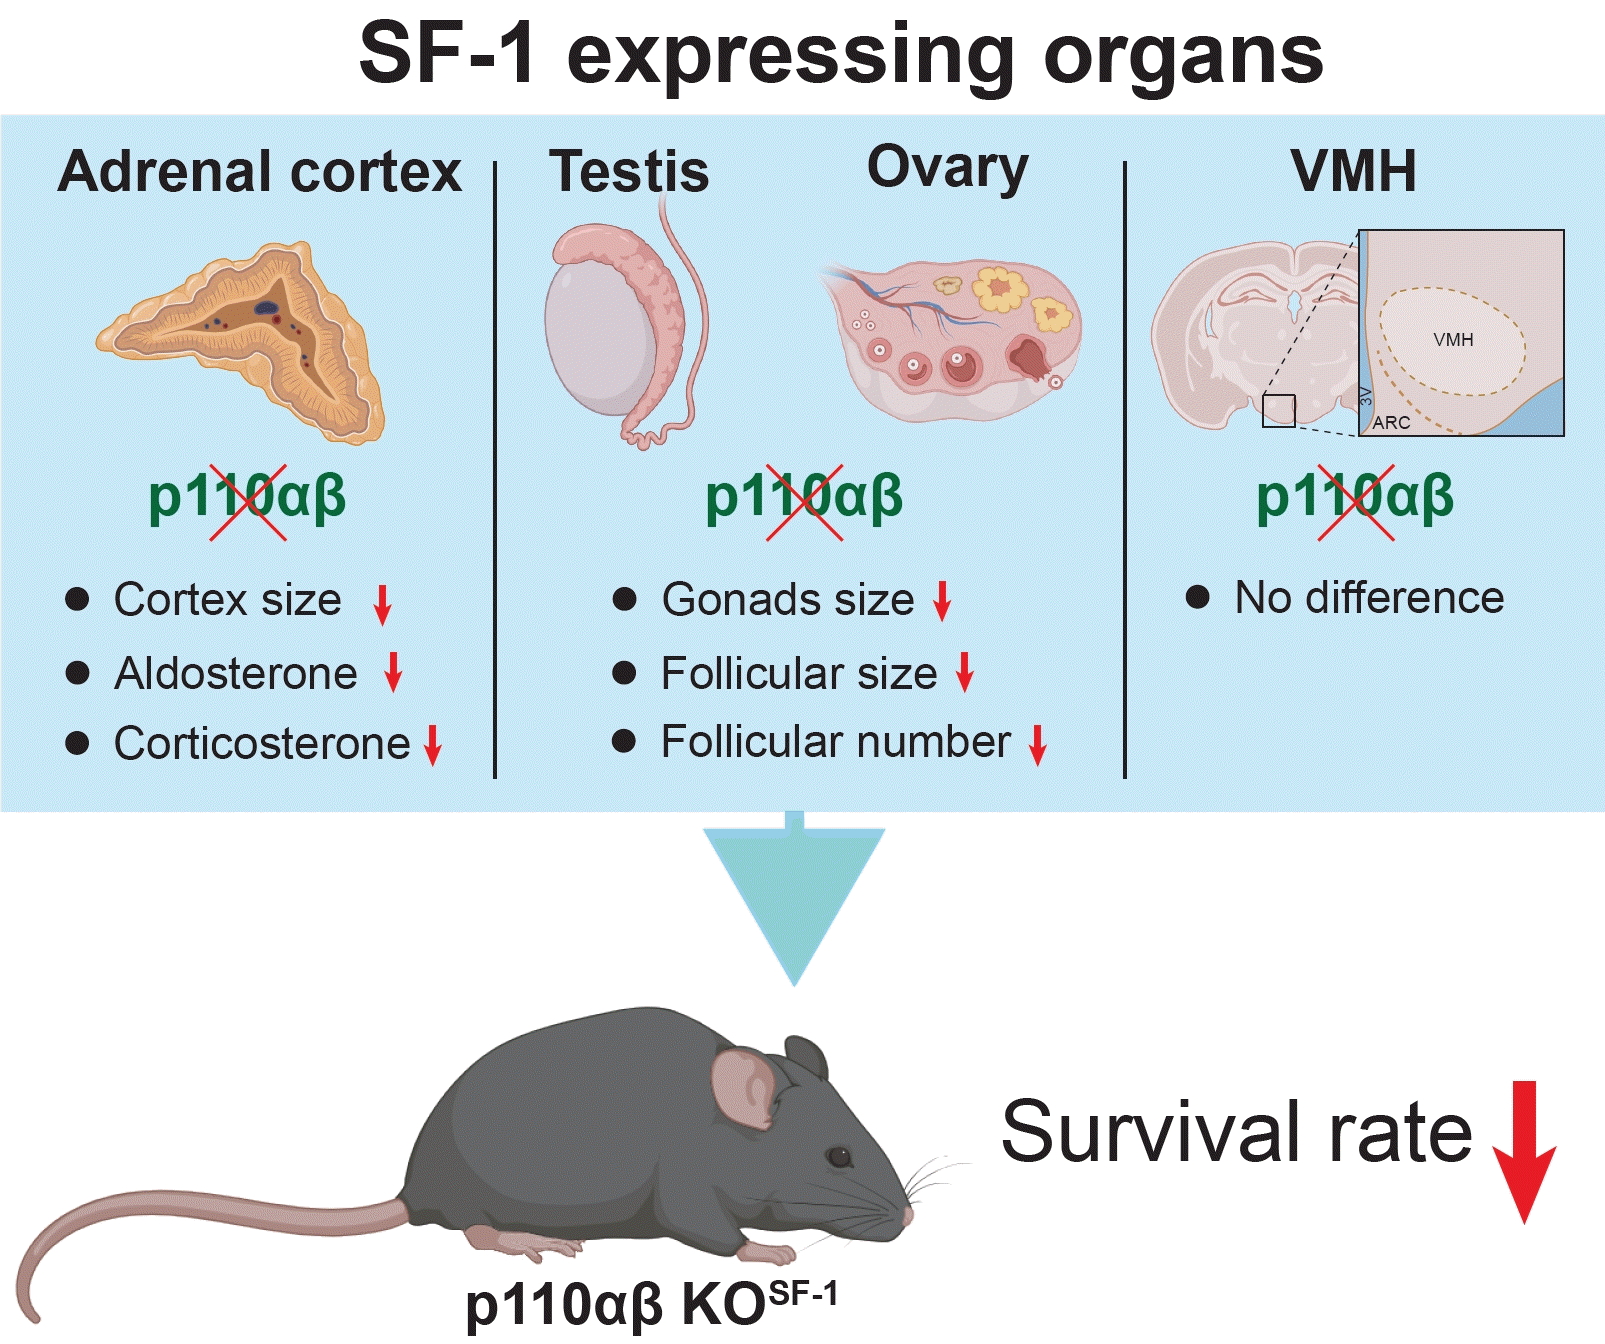
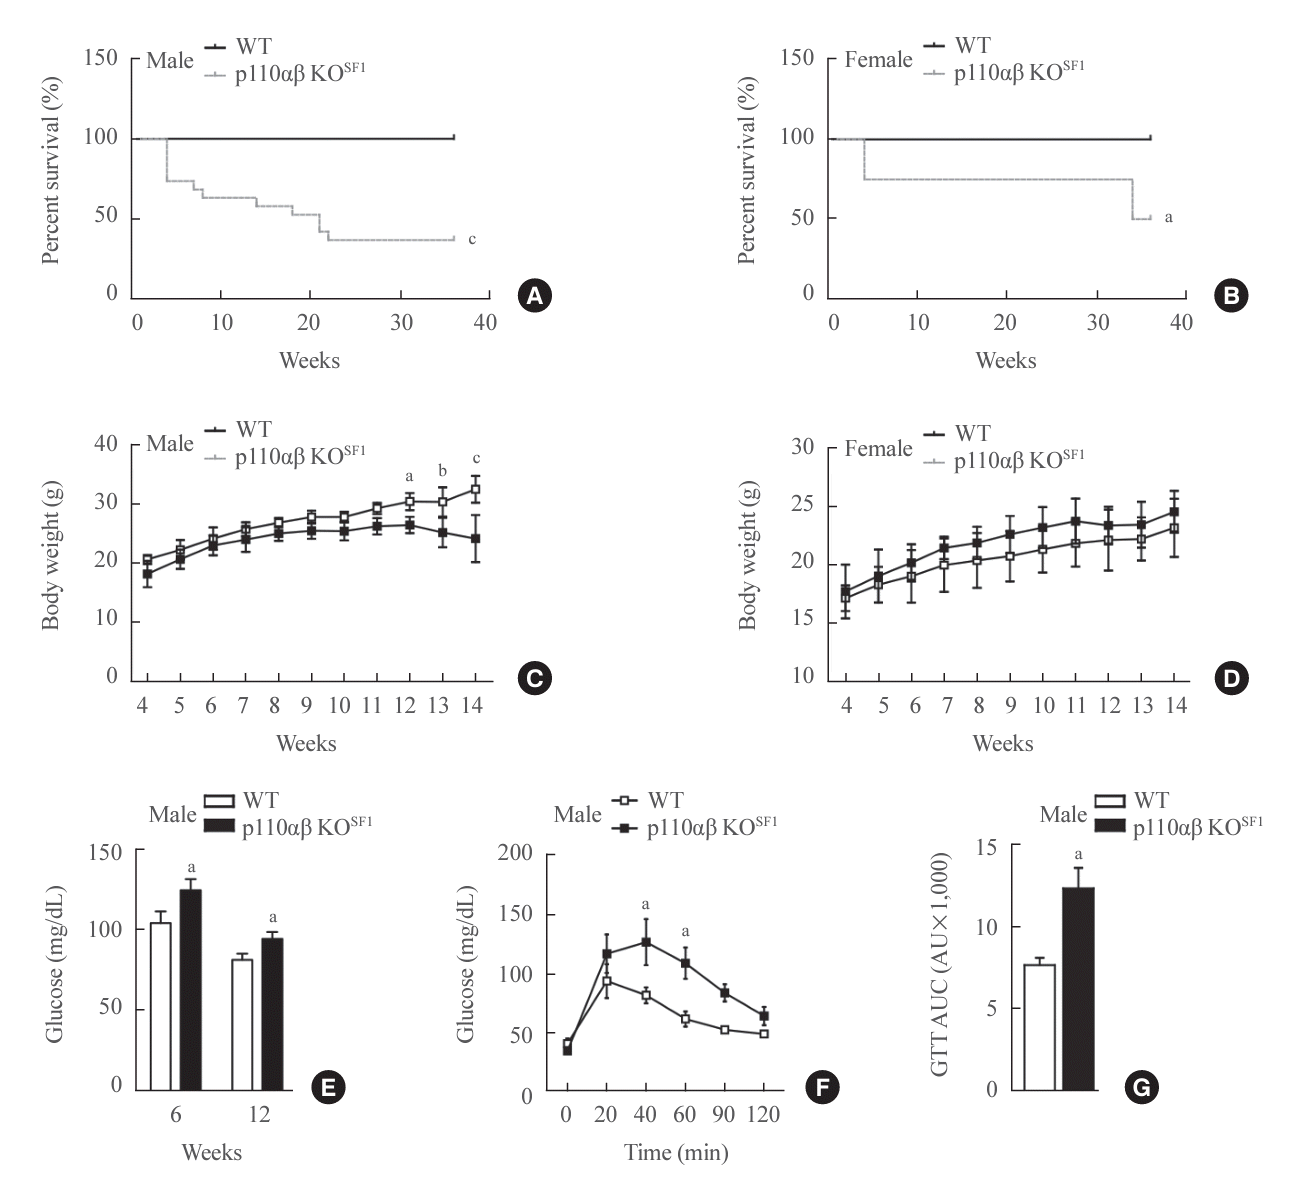 | Fig. 1.Phosphatidylinositol 3-kinase isoforms p110α and p110β in steroidogenic factor 1 (SF1)-expressing organs play key roles in the survival and normal development of mice. (A, B) Survival rates of (A) male and (B) female mice over a 36-week observation period (n=12 males and n=9 females for the wild-type [WT] group and n=19 males and n=8 females for the p110αβ knockout [KO]SF1 group). (C, D) Body weights of WT and p110αβ KOSF1 mice in both (C) males (n=4 for the WT group and n=6 for the p110αβ KOSF1 group) and (D) females (n=4 for each group). (E) Postprandial glucose levels in male mice at 6 and 12 weeks of age. (F, G) Glucose tolerance test (GTT) for male mice aged 6 to 10 weeks (n=7 for each group) (F) and the area under the curve (AUC) for the GTT (G). Data are presented as mean±standard error of the mean. AU, arbitrary unit. aP<0.05, bP<0.01, and cP<0.001 vs. WT group. |
Unaltered VMH structure and SF1 expression in p110αβ KOSF1 mice
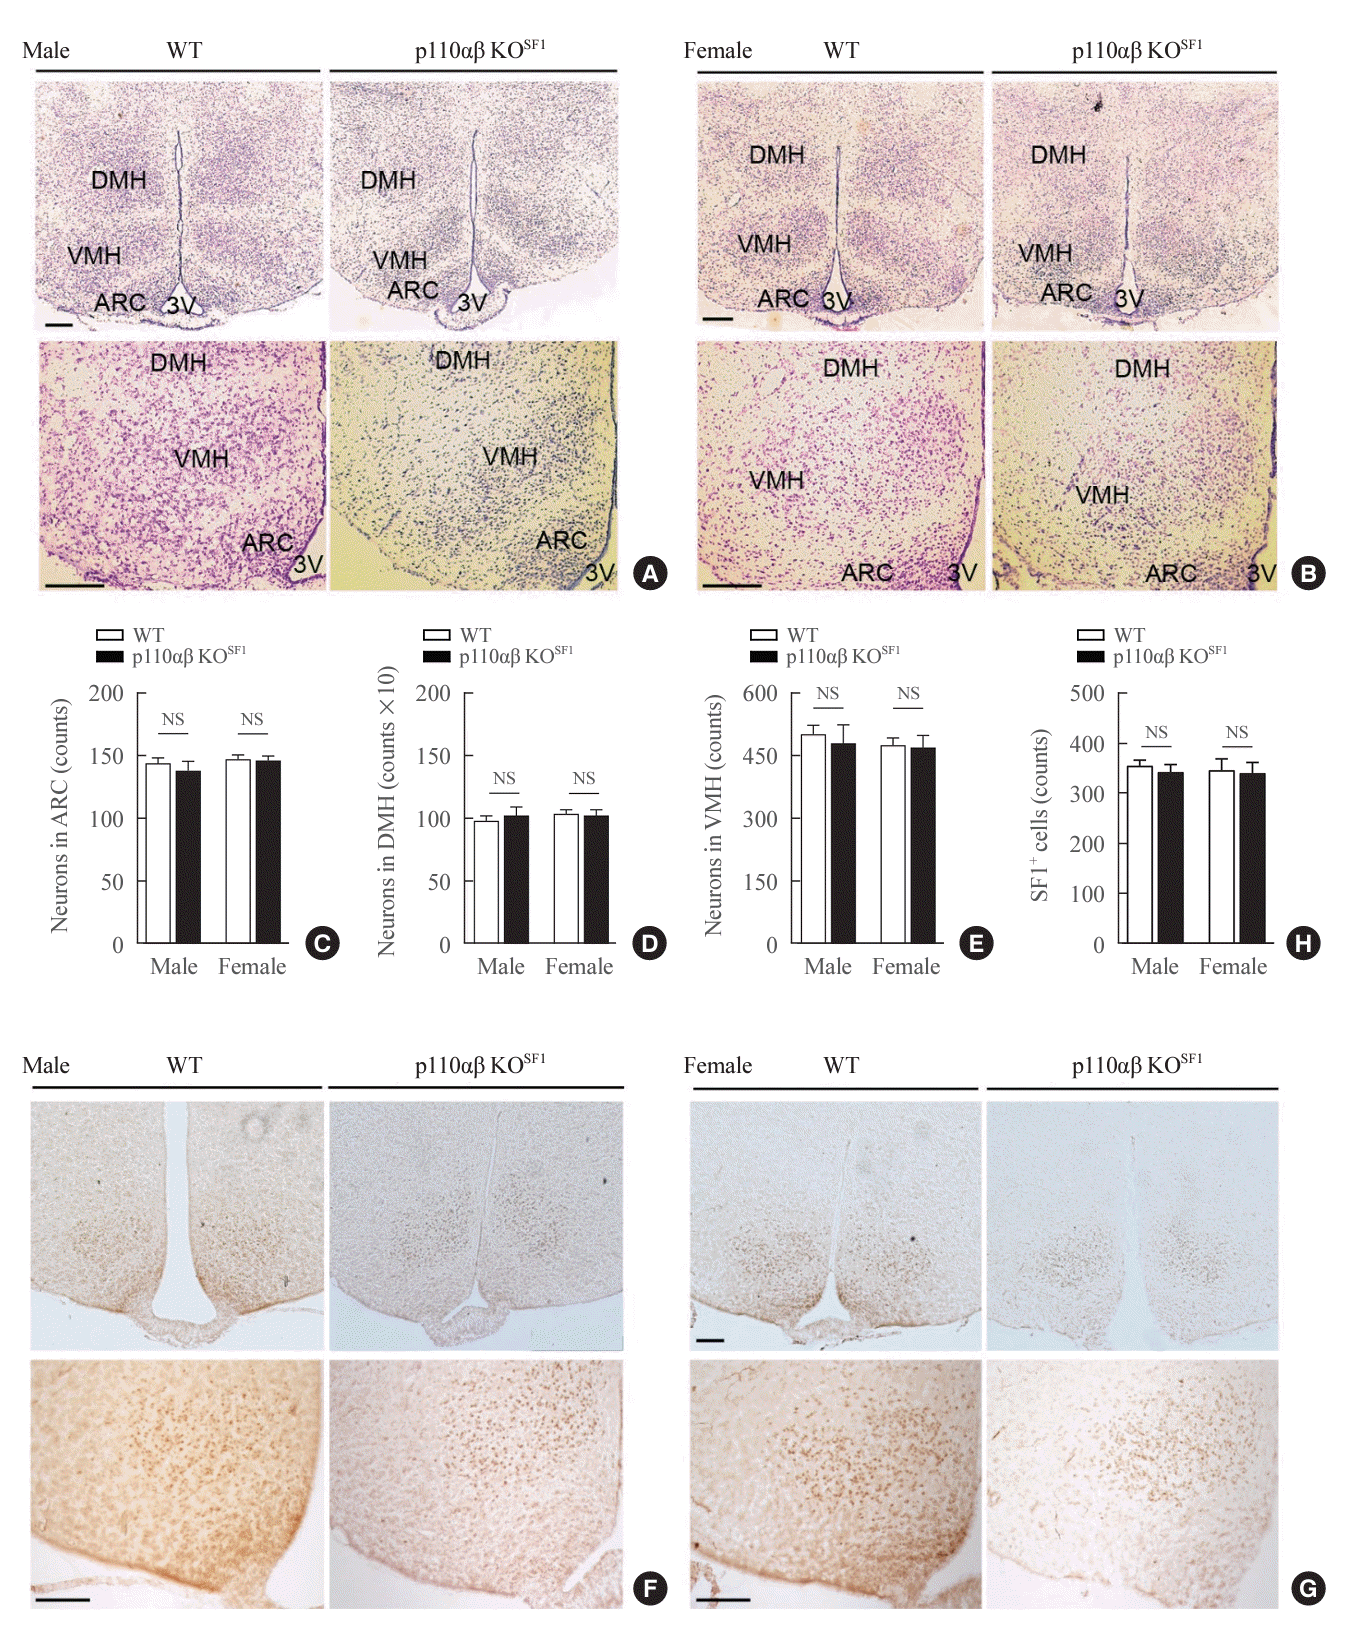 | Fig. 2.Conditional deletion of p110α and p110β in steroidogenic factor 1 (SF1) neurons does not significantly impact the formation of the ventromedial hypothalamus (VMH) or the expression of SF1. (A, B) Representative images of Nissl staining in the hypothalamus region of (A) male (n=2 for wild-type [WT] and n=1 for p110αβ knockout [KO]SF1) and (B) female (n=2 for each group) mice at 12 weeks of age. (C-E) Quantitative data indicating the numbers of neurons in the (C) arcuate nucleus (ARC), (D) dorsomedial hypothalamus (DMH), and (E) ventromedial hypothalamus (VMH). (F, G) Representative SF1 immunohistochemical staining in the brains of (F) male (n=2 for WT and n=1 for p110αβ KOSF1) and (G) female (n=1 for WT and n=2 for p110αβ KOSF1) mice. (H) Quantitative data indicating the numbers of SF1-positive cells in the VMH. The original magnification is ×100 (upper panel) and ×200 (lower panel). Scale bars represent 200 µm. Data are presented as mean±standard error of the mean. 3V, third ventricle; NS, not significant. |
Altered adrenal cortex development and hormone production in p110αβ KOSF1 mice
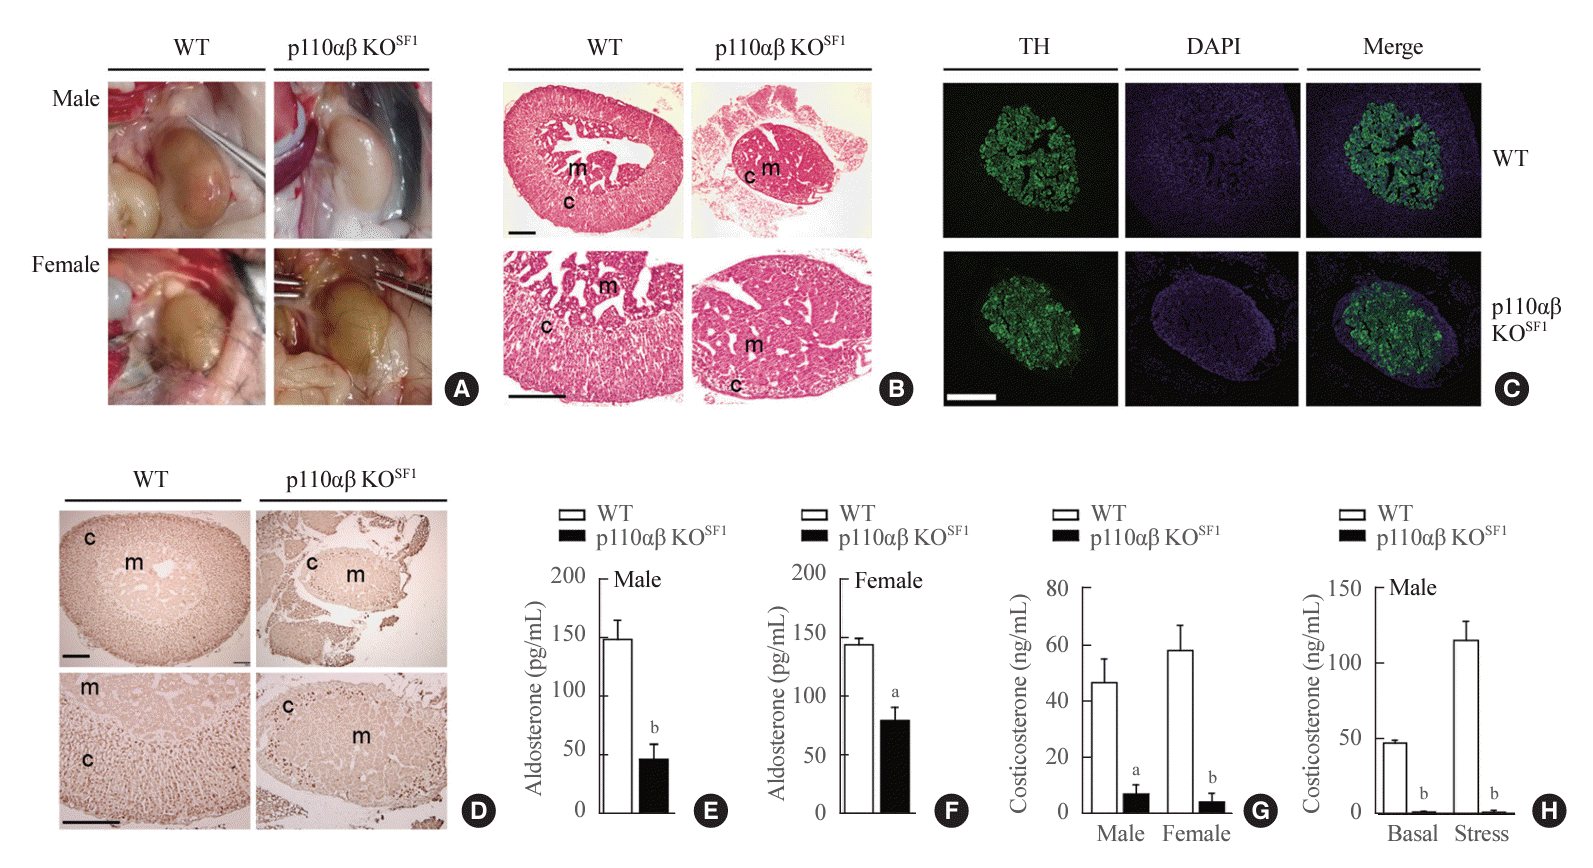 | Fig. 3.Ablation of p110α and p110β in cortical layers leads to impaired development of the adrenal cortex. (A) Representative image of adrenal glands dissected from wild-type (WT) and p110αβ knockout (KO)SF1 mice, with male specimens in the upper panel and female specimens in the lower panel. (B) Representative image of hematoxylin and eosin-stained adrenal glands from female mice. The original magnification is ×100 (upper panel) and ×200 (lower panel). Scale bars represent 200 µm. (C) Representative image of tyrosine hydroxylase (TH) immunofluorescent staining in the adrenal medulla of female mice. Original magnification, ×100. Scale bars represent 250 µm. (D) Representative image of steroidogenic factor 1 (SF1) immunohistochemical staining in the adrenal cortex of female mice. The original magnifications are ×100 (upper panel) and ×200 (lower panel). Scale bars represent 200 µm. (E, F) Aldosterone levels in 12-week-old (E) male (n=7 for each group) and (F) female (n=3 for the WT group and n=8 for the p110αβ KOSF1 group) mice. (G) Corticosterone levels in 8-week-old male (n=4 for the WT group and n=6 for the p110αβ KOSF1 group) and female (n=4 for the WT group and n=5 for the p110αβ KOSF1 group) mice under basal conditions. (H) Corticosterone levels in 12-week-old male mice (n=3 for the WT group and n=4 for the p110αβ KOSF1 group) under basal and stress conditions. Data are presented as mean±standard error of the mean. DAPI, 4´,6-diamidino2-phenylindole; c, adrenal cortex; m, adrenal medulla. aP<0.01 and bP<0.001 vs. WT group. |
Impaired reproductive organ development in p110αβ KOSF1 mice
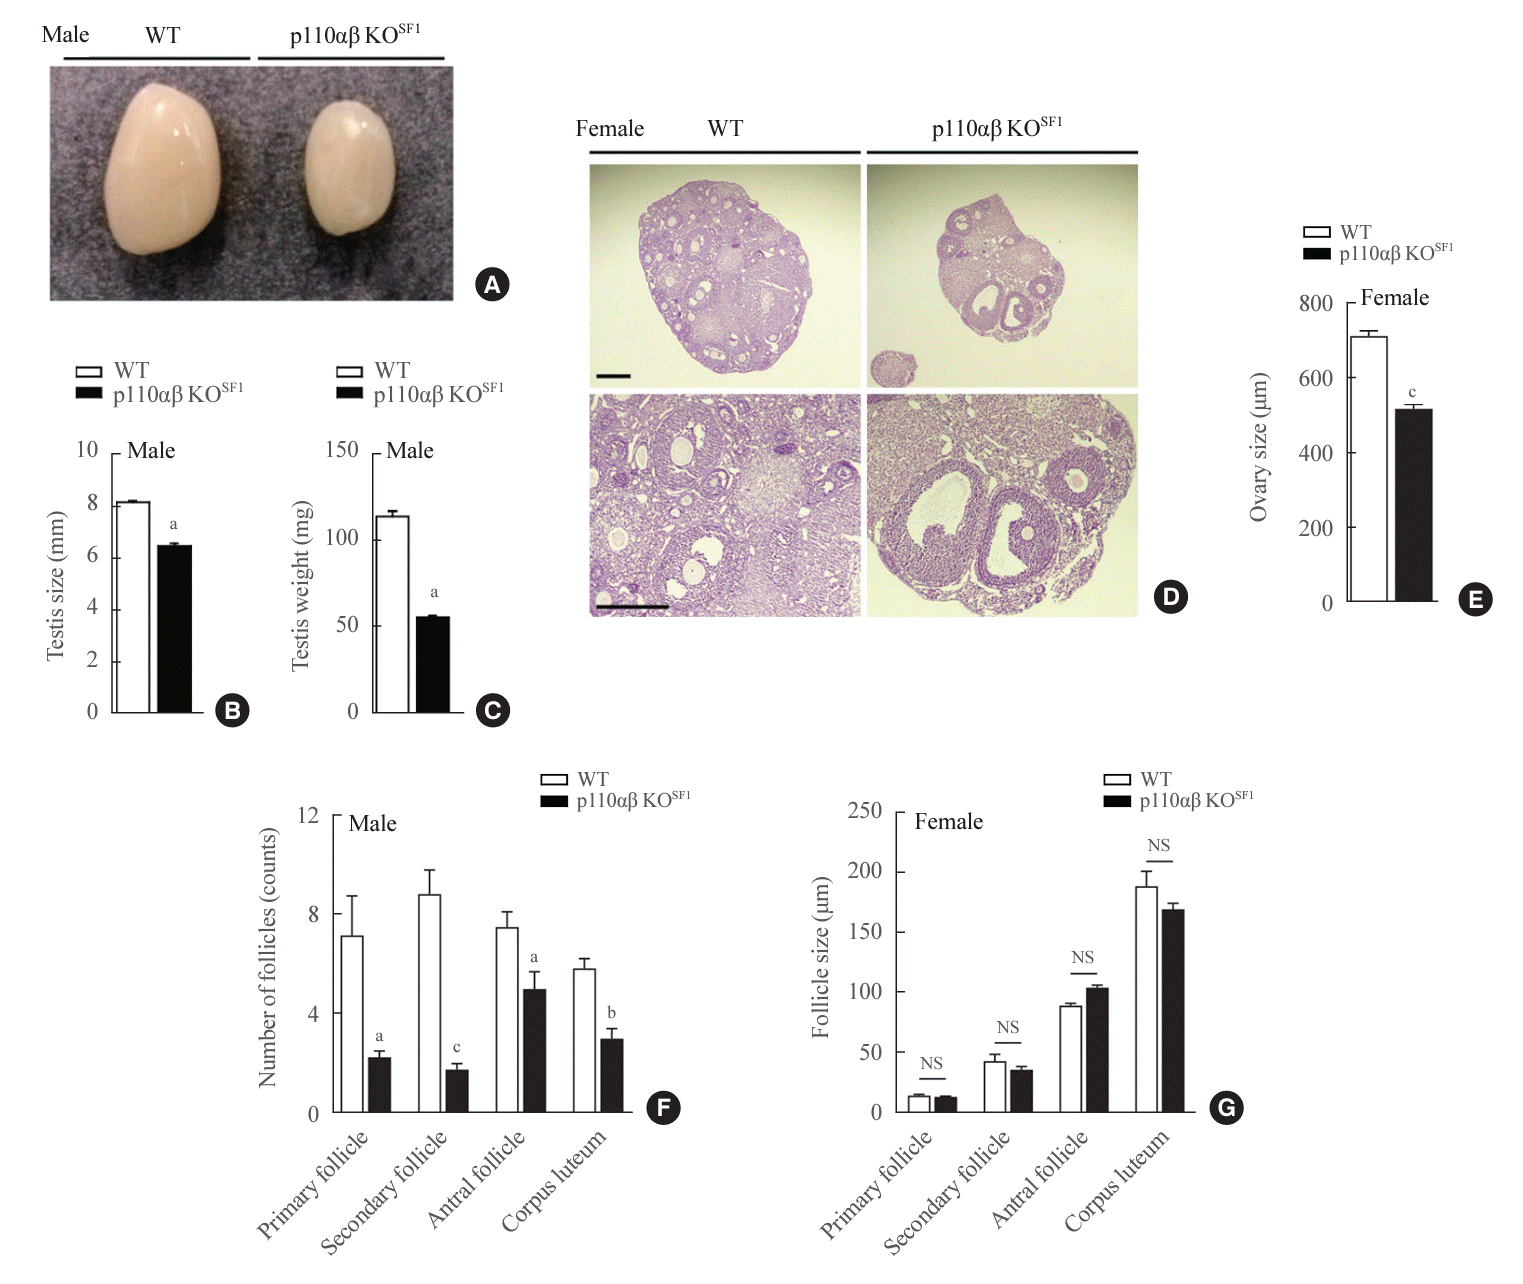 | Fig. 4.Absence of p110α and p110β in steroidogenic factor 1 (SF1)-expressing cells leads to severe testicular and ovarian hypotrophy. (A) Representative image of testes dissected from wild-type (WT) and p110αβ knockout (KO)SF1 mice. (B) Average size and (C) weight of testes from WT (n=5) and p110αβ KOSF1 (n=3) male mice. (D) Representative image of hematoxylin and eosin-stained ovaries. The original magnification is ×100 (upper panel) and ×200 (lower panel). Scale bars represent 200 µm (upper panel) and 100 µm (lower panel). (E) The size of ovaries from WT (n=2) and p110αβ KOSF1 (n=1) female mice. (F) The number and (G) size of follicles in WT (n=2) and p110αβ KOSF1 (n=1) female mice. Data are presented as mean±standard error of the mean. NS, not significant. aP<0.05, bP<0.001, and cP<0.0001 vs. WT group. |


 PDF
PDF Citation
 Print
Print


 XML Download