Journal List > Endocrinol Metab > v.39(5) > 1516088769

Jo, Ahn, Ohn, Shin, Ji, Kim, Jung, and Lee: Insulin Resistance and Impaired Insulin Secretion Predict Incident Diabetes: A Statistical Matching Application to the Two Korean Nationwide, Population-Representative Cohorts

Abstract

Background

To evaluate whether insulin resistance and impaired insulin secretion are useful predictors of incident diabetes in Koreans using nationwide population-representative data to enhance data privacy.

Methods

This study analyzed the data of individuals without diabetes aged >40 years from the Korea National Health and Nutrition Examination Survey (KNHANES) 2007–2010 and 2015 and the National Health Insurance Service-National Health Screening Cohort (NHIS-HEALS). Owing to privacy concerns, these databases cannot be linked using direct identifiers. Therefore, we generated 10 synthetic datasets, followed by statistical matching with the NHIS-HEALS. Homeostasis model assessment of insulin resistance (HOMA-IR) and homeostasis model assessment of β-cell function (HOMA-β) were used as indicators of insulin resistance and insulin secretory function, respectively, and diabetes onset was captured in NHIS-HEALS.

Results

A median of 4,580 (range, 4,463 to 4,761) adults were included in the analyses after statistical matching of 10 synthetic KNHANES and NHIS-HEALS datasets. During a mean follow-up duration of 5.8 years, a median of 4.7% (range, 4.3% to 5.0%) of the participants developed diabetes. Compared to the reference low–HOMA-IR/high–HOMA-β group, the high–HOMA-IR/low– HOMA-β group had the highest risk of diabetes, followed by high–HOMA-IR/high–HOMA-β group and low–HOMA-IR/low– HOMA-β group (median adjusted hazard ratio [ranges]: 3.36 [1.86 to 6.05], 1.81 [1.01 to 3.22], and 1.68 [0.93 to 3.04], respectively).

Conclusion

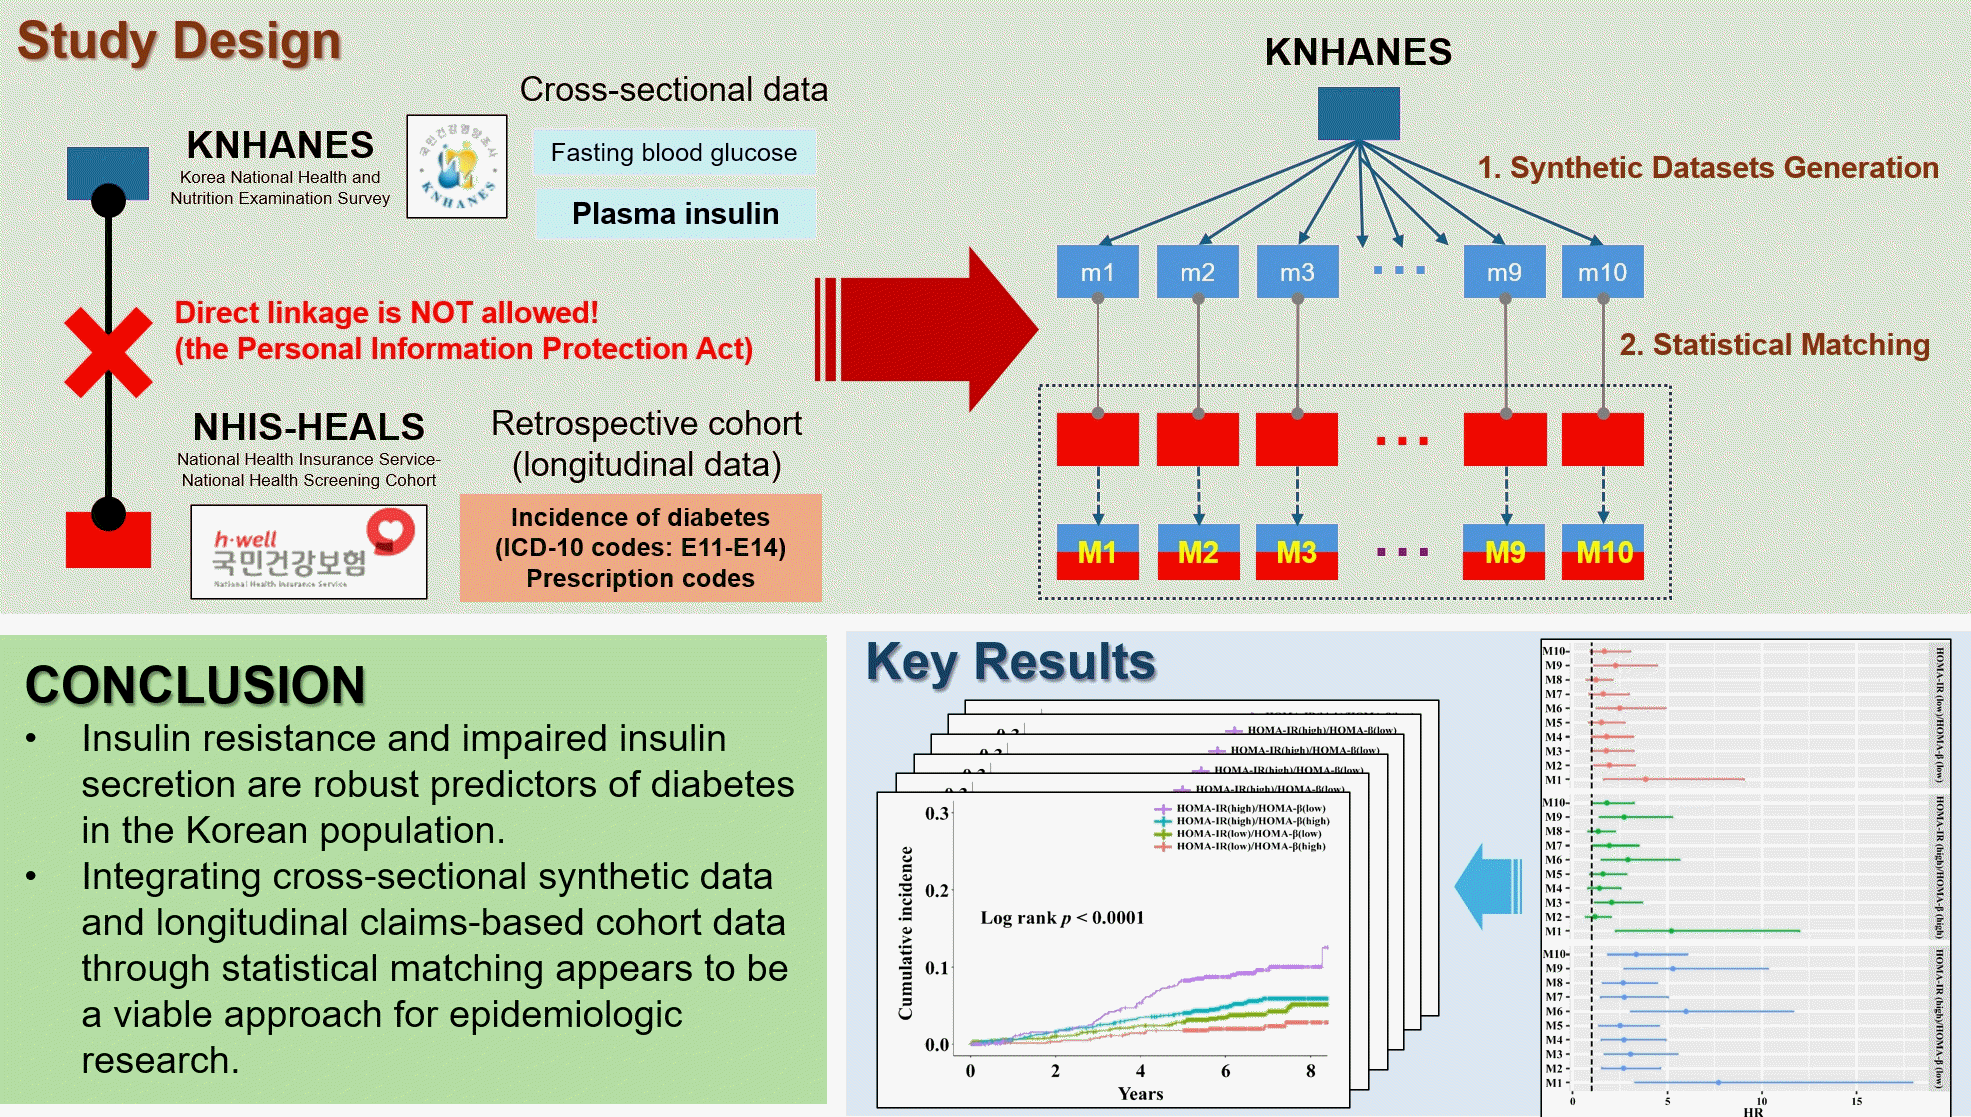
Insulin resistance and impaired insulin secretion are robust predictors of diabetes in the Korean population. A retrospective cohort constructed by combining cross-sectional synthetic and longitudinal claims-based cohort data through statistical matching may be a reliable resource for studying the natural history of diabetes.

GRAPHICAL ABSTRACT

INTRODUCTION

According to the Diabetes Fact Sheet published by the Korean Diabetes Association in 2020, one in six Korean adults aged over 30 years (16.7%) and three out of 10 aged over 65 years (30.1%) had diabetes [1]. The pathophysiology of diabetes is explained by insulin resistance and a deterioration in the insulin secretory function of pancreatic β-cells [2]. Previous population-based prospective cohort studies have described their roles in the natural history of type 2 diabetes with different conclusions depending on races and measures of insulin resistance and insulin secretory functions [3]. The Whitehall II study, a prospective cohort of 6,538 civil servants (91% Caucasian) in the United Kingdom followed up for 13 years, reported that the group with initially high insulin resistance had significantly more diabetes than those with low insulin secretory function [4]. Similarly, a study of 94,952 Chinese individuals in a nationwide, population-based cohort showed that insulin resistance was more strongly associated with incident diabetes than β-cell dysfunction measured with homeostasis model assessment of β-cell function (HOMA-β) which was more prominent among adults with obesity [5]. In contrast, in East Asians, several prospective cohort studies of Koreans and Japanese individuals have concluded that the decrease in insulin secretory function, as measured by the insulinogenic index from oral glucose tolerance tests, contributes more to the incident diabetes than insulin resistance [6,7].
Prospective cohort studies on the pathophysiology of diabetes can yield results with strong evidence. However, establishing and maintaining large prospective cohort studies on diabetes is costly and time-consuming. The Korea National Health and Nutrition Examination Survey (KNHANES) is a complex, stratified, multistage probability-cluster survey used to obtain a representative sample of South Koreans. KNHANES includes several health examinations, such as medical history-taking, physical examination, administration of a questionnaire, and anthropometric and biochemical measurements. As these surveys were conducted by well-trained visiting medical staff, objective and precise results were achieved [8-10]. The National Health Insurance Service-National Health Screening Cohort (NHIS-HEALS) provides nationwide annual claims data, including prescription and diagnosis code information provided by specialists, which enables researchers to infer the incidence of a specific disease [11,12]. Diabetes incidence was extracted from the NHIS-HEALS using International Classification of Disease (ICD) code diagnosed by physicians, and plasma insulin and glucose levels were obtained from the KNHANES data. The nature of the cross-sectional KNHANES can be expanded upon by incorporating longitudinal outcomes into the NHIS-HEALS; however, owing to privacy issues, integrating two datasets with a direct identifier is very limited.
In the present study, synthetically generated KNHANES datasets were matched with NHIS-HEALS. To date, there have been a community-based longitudinal study and a nationwide cross-sectional study in Korea [6,13]. However, this is the first study to conduct a longitudinal analysis of diabetes occurrence using the nationwide population-representative cohorts. Also, we hypothesize that the statistically matched cohort could confirm epidemiologically relevant results, a combination of insulin resistance and insulin secretory increased risk of diabetes.

METHODS

Study participants

This study incorporated synthetic data from the KNHANES and NHIS-HEALS. KNHANES is a nationwide survey conducted annually by the Korea Centers for Disease Control and Prevention (KCDC) to investigate the health and nutritional status of the population. Data were obtained by proportional allocation systematic sampling with multistage stratification to achieve representativeness of the whole population. A professional survey team consisting of nurses, clinical pathologists, radiologists, nutritionists, and dentists investigated four areas every week, and each area was surveyed for 3 days via standardized mobile check-up vehicle visits. We chose the 2007–2010 and 2015 KNHANES years when insulin levels were measured.
The NHIS is the single health insurance provider in South Korea and covers the entire South Korean population. The NHIS-HEALS is a subpopulation of individuals who participated in the health screening programs provided by the NHIS. To construct the NHIS-HEALS database, a sample cohort from the 2002 and 2003 health screening participants aged between 40 and 79 years was first selected in 2002 and followed up until 2015. This cohort included 514,866 participants chosen randomly from 10% of all health screening participants in 2002 to 2003 [14]. NHIS-HEALS includes public data on healthcare utilization, such as disease diagnoses, drug prescriptions, interventions, medical procedures, and physical health examination results. All data were provided only for studies approved by the Institutional Review Board and were anonymized prior to assessment.
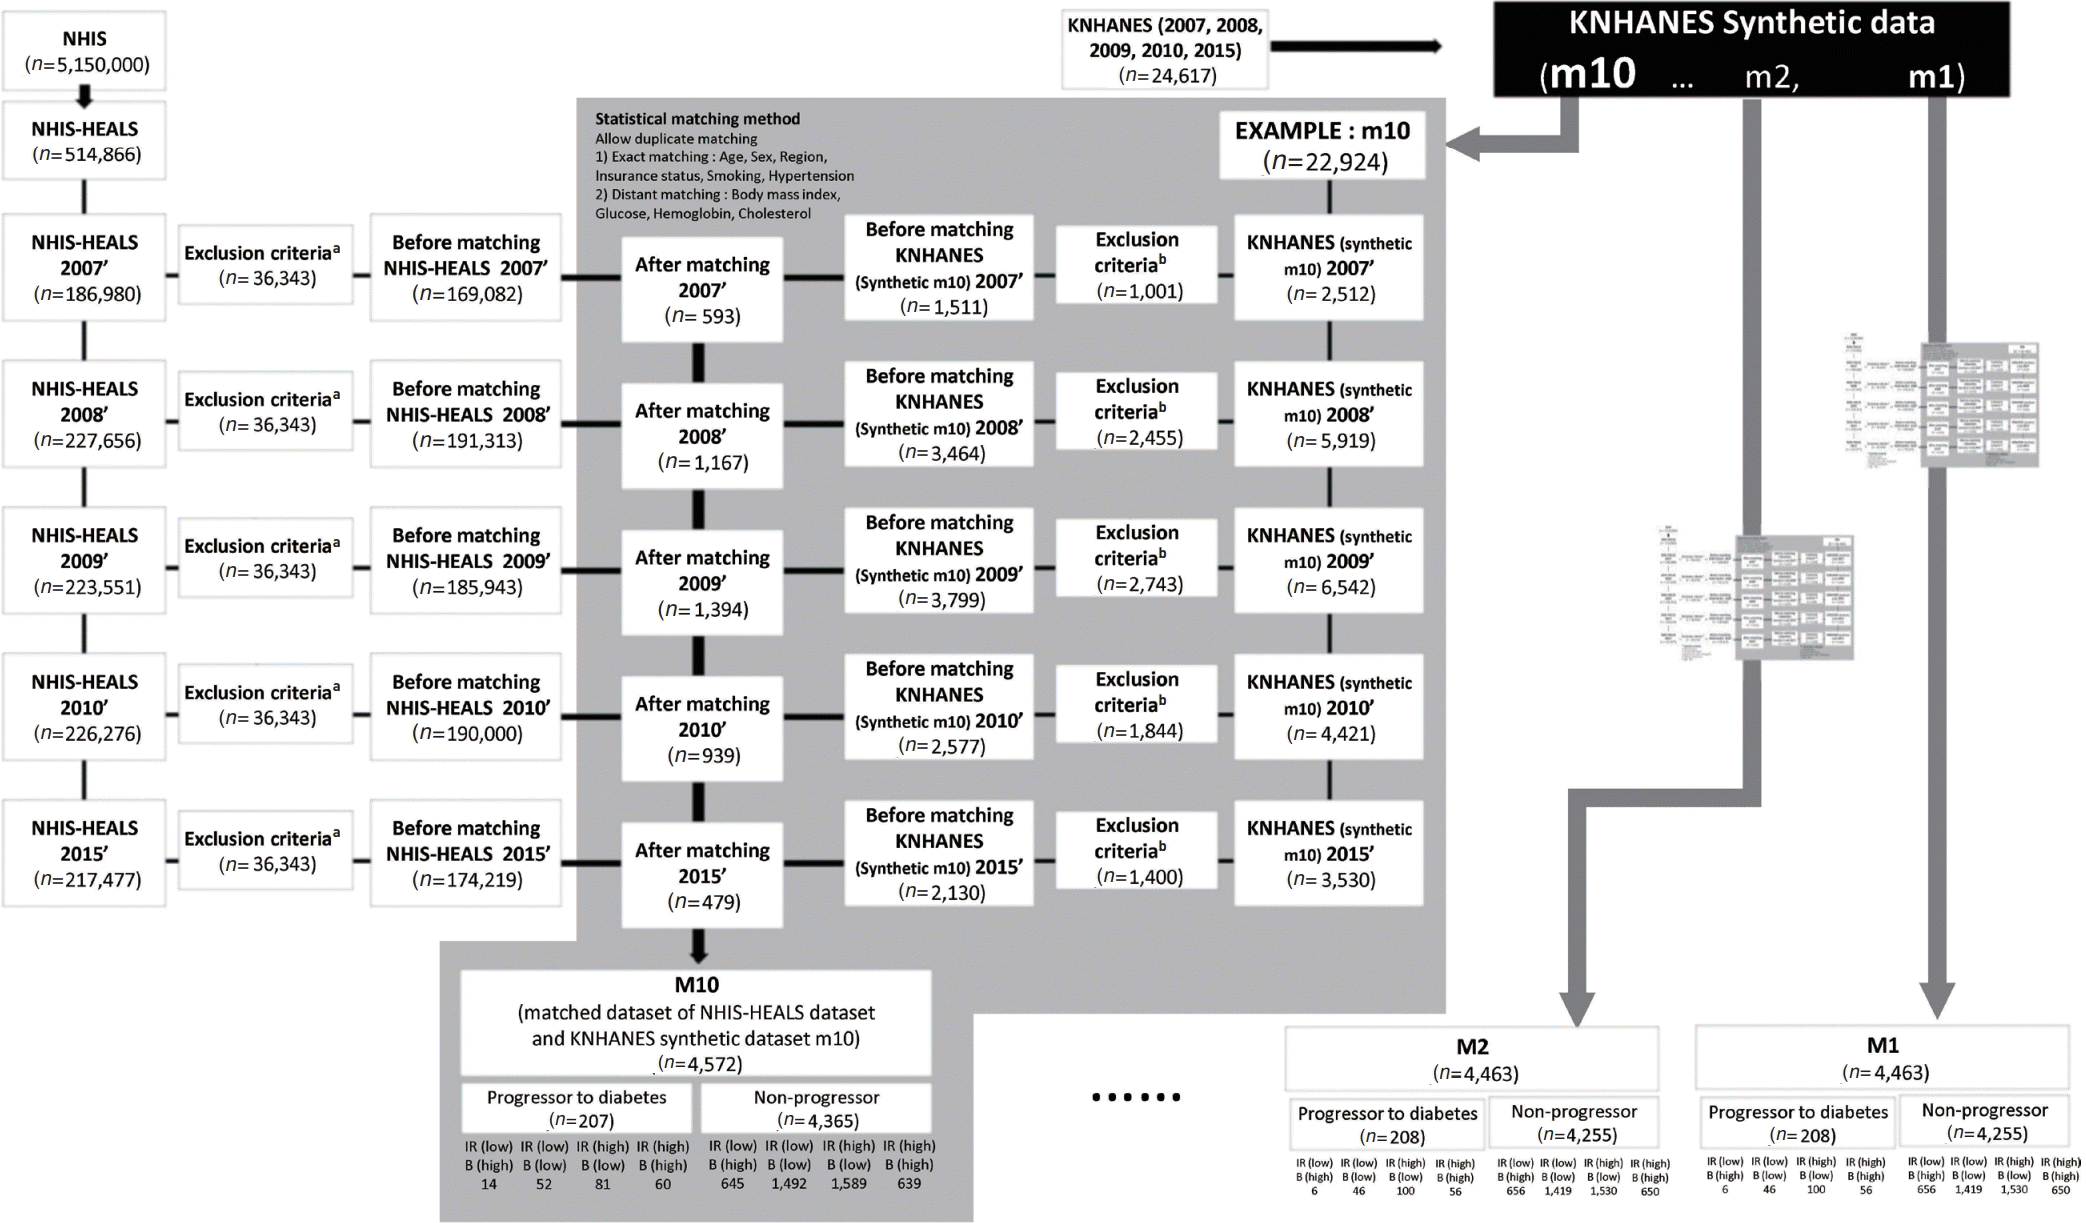
A total of 24,617 individuals from the KNHANES (for example, one synthetic dataset [m10] included 2,512 in 2007; 5,919 in 2008; 6,542 in 2009; 4,421 in 2010; and 3,530 in 2015) and 514,866 individuals from the NHIS-HEALS (186,980 examinees in 2007; 227,656 examinees in 2008; 223,551 examinees in 2009; 226,276 examinees in 2010; and 217,477 examinees in 2015) were investigated. As each individual surveyed in the KNHANES is likely to also participate in the NHIS survey as a South Korean citizen, we attempted to combine the KNHANES with the NHIS. However, due to the Personal Information Protection Act, it was impossible to both import KNHANES data into the data analysis center and establish a direct linkage. Consequently, we generated synthetic KNHANES data and constructed well-designed statistical matching to overcome these limitations. Participants from the same year as the NHIS-HEALS and KNHANES were matched to ensure high-quality matching. As the NHIS medical examination is conducted for those aged 40 years or older, participants aged over 40 were included. To exclude participants with diabetes at baseline, participants who exceeded a fasting glucose level of 126 mg/dL or had checked their previous diabetes history in the survey in both the NHIS-HEALS and KNHANES were excluded. Participants with missing data on the matching variables or medical beneficiaries were excluded. The flowchart shows details of the exclusion criteria (Fig. 1). Because the NHIS data includes tests that patients can undergo annually, duplicate data may occur; therefore, the previous year’s NHIS-KNHANES matched data were removed before the corresponding year’s matching.
This study excluded personal identification information, and the Institutional Review Board waived the requirement for informed consent. This study was approved by the Institutional Review Board of Seoul National University Bundang Hospital (IRB No. X-2004-608-905).

Matching variables

The variables used in matching were age, sex, residential area, smoking status, insurance type, hypertension, body mass index (BMI), hemoglobin, total cholesterol, and fasting glucose levels. Age was recorded based on the initial assessment year, but all ages ≥80 years were marked as 80 years old in the KNHANES; therefore, in the NHIS, those aged ≥80 years were also truncated as 80 years old before matching. Residential area was divided based on KNHANES, following 13-city code tables: Seoul, Busan, Daegu, Incheon, Gwangju, Daejeon, Ulsan, Gyeonggi, Gangwon, Chungcheong (Chungcheongbuk-do, Chungcheongnam-do, and Sejong city in NHIS city code were combined into Chungcheong), Jeolla (Jeollabuk-do and Jeollanam-do in NHIS city code were combined into Jeolla), Gyeongsang (Gyeongsangbuk-do and Gyeongsangnam-do in the NHIS city code were combined into Gyeongsang), and Jeju. Insurance types were divided into employment and local health insurance groups. Hypertension data were collected from the NHIS health examination history code table and KNHANES health interview questionnaire. Participants were considered current smokers, nonsmokers (having smoked less than 100 cigarettes in their lifetime), or past smokers, with smokers defined as both current and past smokers.
Height and weight were measured in the KNHANES health examinations to the nearest 0.1 cm and 0.1 kg, respectively, wearing light clothing and no shoes. BMI was calculated as weight in kilograms divided by the square of height in meters (kg/m2). Blood samples were collected from the antecubital vein of each participant in the morning after overnight fasting for at least 8 hours, processed, transferred in cold storage (2°C to 8℃) to the central laboratory of Neodin Medical Institute (Seoul, Korea), and analyzed within 24 hours. Fasting plasma glucose (FPG) measurements were performed using a Hitachi automatic analyzer 7600-210 (Hitachi Ltd., Tokyo, Japan).

Definition of incident diabetes mellitus

Data on incident diabetes were captured from the NHIS-HEALS database. As FPG, 2-hour postprandial plasma glucose from 75 g oral glucose tolerance test, or glycated hemoglobin (HbA1c), were not available, diabetes mellitus at NHIS-HEALS was defined by the combination of E11–14, ICD-10 codes for type 2 diabetes, and the use of medications for diabetes. The occurrence of diabetes was defined as a history of prescribing diabetes drugs, having more than two diabetes diagnoses (E10–14, ICD-10 codes) within the 90-day period, where any consecutive prescriptions occurred at least 28 days apart but no more than 1 year, and diagnosis cases other than E10 were included in at least one prescription to exclude type 1 diabetes cases. If multiple events were available, the date of the preceding event was designated as the date of diabetes occurrence.

Definition of HOMA-IR and HOMA-β

Fasting glucose and insulin levels in the KNHANES were used to measure insulin resistance and insulin secretion. Homeostasis model assessment of insulin resistance (HOMA-IR) and HOMA-β were calculated using the following formula [15]:
HOMA-IR=FPG (mg/dL)×fasting insulin (μU/mL)/405
HOMA-β=360×fasting insulin (μU/mL)/[FPG (mg/dL)–63].
We categorized the participants into four groups: low–HOMA-IR/high–HOMA-β, low–HOMA-IR/low–HOMA-β, high–HOMA-IR/high–HOMA-β, and high–HOMA-IR/low–HOMA-β using cutoff values of HOMA-IR (1.93) and HOMA-β (100.20) obtained as median values from the original KNHANES data collected between 2007–2010 and 2015.

Synthetic data generation and statistical matching

We generated synthetic data from the KNHANES for statistical matching with NHIS-HEALS. The concept of synthetic data generation is provided in Supplemental Fig. S1. A classification and regression tree method was applied to generate synthetic data. The following covariates were considered: year of examination; age; residential area; insurance type; smoking; hypertension; height; weight; BMI; waist circumference; hemoglobin, total cholesterol, HbA1c, fasting glucose, and insulin levels. The synthetic datasets were generated 10 times, with 23,741 records generated each time for the given covariates.
Both the KNHANES and the NHIS-HEALS were blocked into a combination of age, sex, residential area, insurance status, smoking, and hypertension, and records within each block were compared using Gower’s distance of the other continuous variables (BMI, fasting glucose, hemoglobin, and total cholesterol) to select nearest-neighbor 1-1 matched participant. To maximize the matching yield, we allowed unconstrained matching, where two or more participants in the NHIS-HEALS could match one participant in the KNHANES [16].

Statistical analysis

Data are presented as means with standard deviations, number (%), or hazard ratios (HRs) with 95% confidence intervals (CIs). We compared means using the Student t test and frequencies using chi-square tests for categorical variables. The Cox proportional hazards regression was used to estimate the adjusted HR (aHR) and 95% CI for the incidence of diabetes in three groups (low–HOMA-IR/low–HOMA-β, high–HOMA-IR/high– HOMA-β, and high–HOMA-IR/low–HOMA-β) relative to the low–HOMA-IR/high–HOMA-β groups. Data were adjusted for age, sex, systolic blood pressure, BMI, and cholesterol levels. All data were analyzed using R version 3.3 (R Foundation for Statistical Computing, Vienna, Austria). The ‘synthpop’ package for synthetic data generation and the ‘StatMatch’ package for statistical matching were used [17]. P values were two-tailed; those less than 0.05 were considered statistically significant.

RESULTS

Baseline characteristics of the study participants

A summary of the original data characteristics before and after matching is presented in Supplemental Tables S1, S2, respectively, corresponding to the synthetic datasets m1–m10 of the KNHANES and the NHIS-HEALS datasets. Characteristics of the original data after matching are presented to compare the baseline characteristics between the two groups (non-progressors and progressors to diabetes) in Table 1, Supplemental Table S3.
Among them, m10 data were chosen for the representative table for presentation purposes. In the M10 matched dataset, after synthetic KNHANES (m10)-NHIS-HEALS matching, diabetes developed in 207 (4.52%) of the 4,572 total participants; the mean follow-up duration was 5.8 years; age, hypertension, BMI, waist circumference, FPG, fasting insulin level, and HOMA-IR were significantly higher in the progressor to diabetes group than in the non-progressor group (Table 1). Similar results were observed for the remaining datasets (M1–M9, see Supplemental Table S3), indicating that the synthetic data shared a comparable distribution. In addition, higher hemoglobin levels (m2, m3, m6, m8, Supplemental Table S3), a higher proportion of smokers (m6–m8, Supplemental Table S3), and lower high-density lipoprotein cholesterol (HDL-C) levels (m2, m6, m8, Supplemental Table S3) were observed in the progressor to diabetes group. The m10 dataset showed no significant differences in sex, insurance, residence, smoking history, systolic and diastolic blood pressure, hemoglobin, total cholesterol, HDL-C, triglycerides, and HOMA-β levels.

Association between HOMA-IR/HOMA-β status and the risk for diabetes

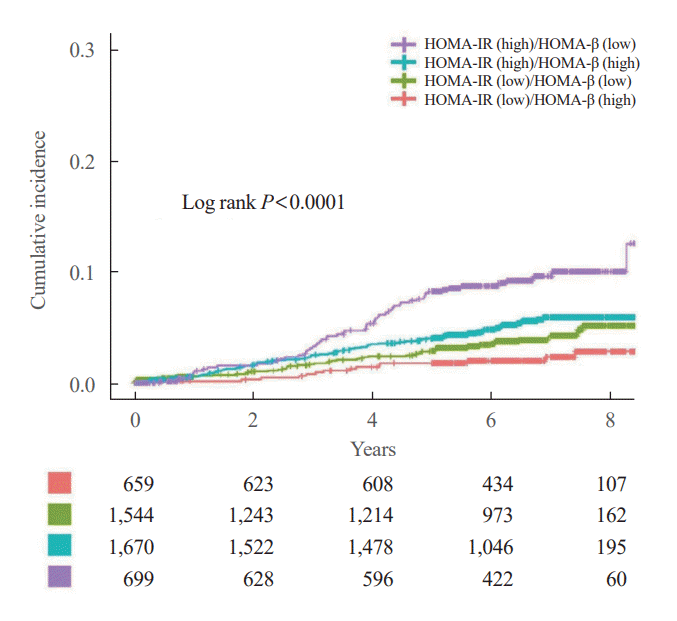
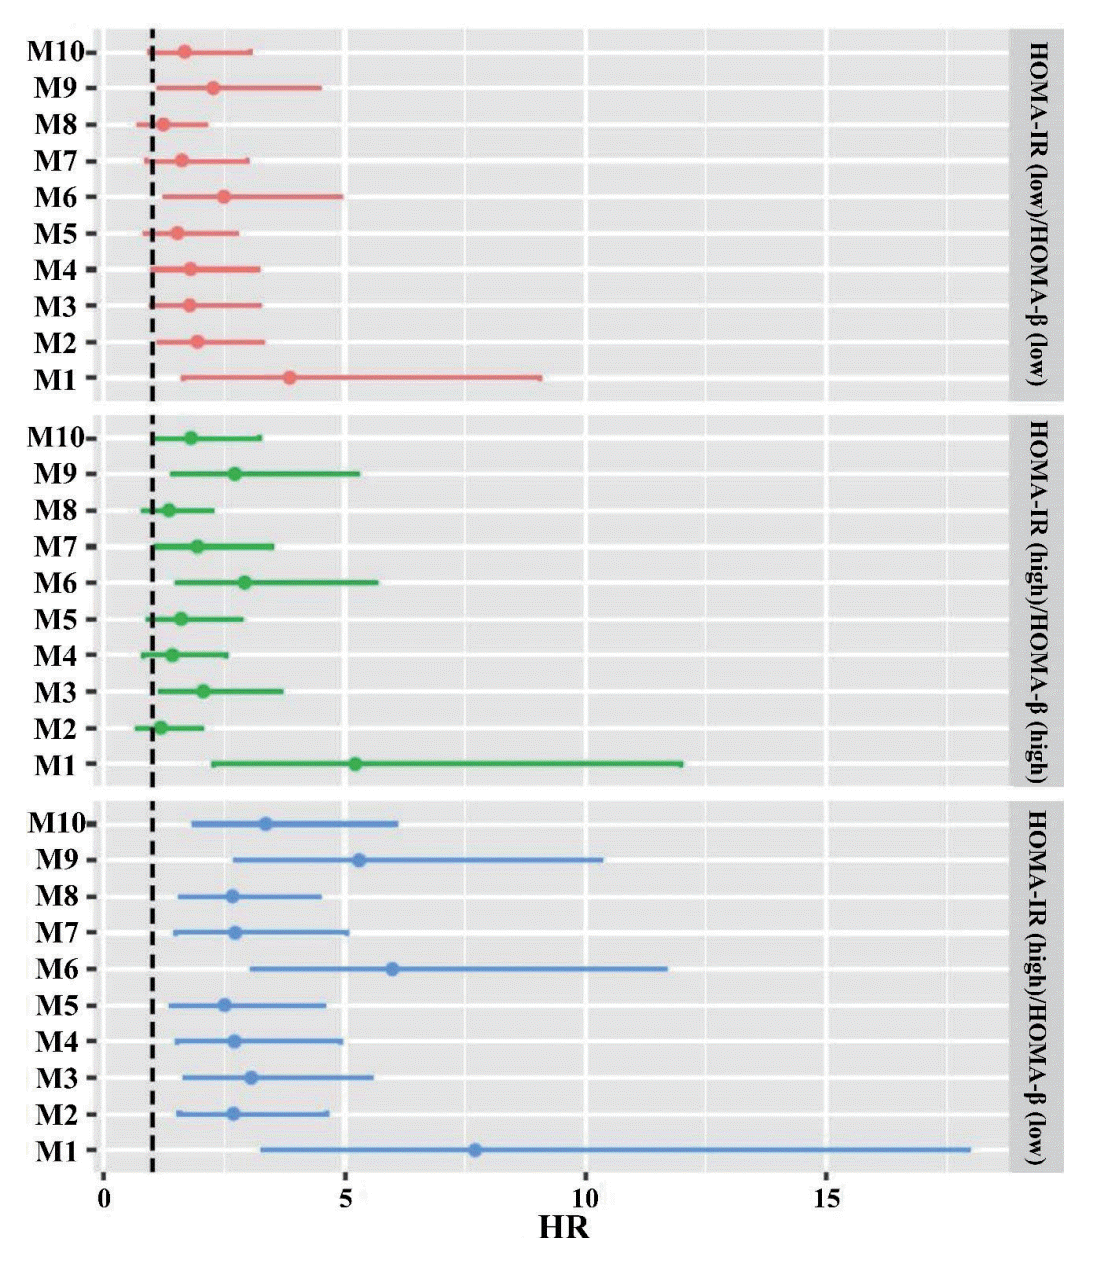
Next, we evaluated the risk of diabetes according to HOMA-IR and HOMA-β statuses using the 10 matched datasets (M1–M10) (Table 2, Supplemental Table S4). In the matched dataset of KNHANES synthetic dataset m10 and the NHIS-HEALS dataset, compared with the reference group (low–HOMA-IR/high–HOMA-β), the high–HOMA-IR/low–HOMA-β group showed the highest risk for diabetes (aHR, 3.36; 95% CI, 1.86 to 6.05) (Table 2), which is also observed in the remaining nine matched datasets (range of aHR, 2.67 to 7.71) (Supplemental Table S4). The high–HOMA-IR/high–HOMA-β group had an aHR of 1.81 (95% CI, 1.01 to 3.22), which was higher than that of the low–HOMA-IR/low–HOMA-β group (aHR, 1.68; 95% CI, 0.93 to 3.04) (Table 2). This trend was also evident in most of the remaining datasets, except for the two matched datasets (M2 and M4), which showed higher aHR in the low–HOMAIR/low–HOMA-β group than in the high–HOMA-IR/high– HOMA-β group (Supplemental Table S4). The Kaplan-Meier curves are presented in Fig. 2 (M10). In addition, forest plots of aHRs with 95% CIs for the 10 matched datasets are summarized in Fig. 3, Supplemental Fig. S2.

DISCUSSION

To the best of our knowledge, this is the first nationwide population-representative retrospective cohort study to investigate the contributions of insulin secretory function and insulin resistance to incident diabetes in the Korean population by generating synthetic data from the nationwide cross-sectional KNHANES and employing statistical matching with nationwide longitudinal claims data. Diabetes occurred in 4.5% of the participants over a mean follow-up of 5.8 years. This study, comprising properly generated synthetic data, revealed consistent trends across datasets for age, hypertension, BMI, waist circumference, FPG levels, and fasting insulin levels between progressors and non-progressors. In the 10 matched datasets, the high–HOMA-IR/low–HOMA-β group exhibited the highest risk compared to the reference group (low–HOMA-IR/high–HOMA-β group).
In the Asian population, where β-cell dysfunction is a predisposing metabolic disturbance, obesity-related insulin resistance that an increase in insulin secretion cannot offset is considered the pathogenesis of type 2 diabetes [18]. While the study observed a trend across the 10 datasets suggesting that both HOMA-β and HOMA-IR significantly impact the incidence of diabetes, the conclusion regarding the prioritization between the two was challenging. Out of 10 synthetic datasets, there were two datasets (M2 and M4) where aHR for incident diabetes was higher in low–HOMA-IR/low–HOMA-β than that in high– HOMA-IR/high–HOMA-β. Our study could not investigate the relative contribution of insulin resistance and insulin secretory function because regular follow-up data of HOMA-IR and HOMA-β were missing, and trajectory analyses of insulin resistance and insulin secretory function were not feasible.
Research using synthetic data has been employed in recent studies [19,20], which have been evaluated in various studies through classification models and have shown reliable results compared to real data [21,22]. Additionally, the evaluation of statistical matching methods remains an area of ongoing research. The adjusted HRs from the statistically matched datasets, which were the main outcome of this study, could be compared to those from the linked data using identifiers, such as ID, name, sex, and date of birth. In our study setting, because direct linkage of data was not possible, this concern could not be addressed. Nevertheless, the application of statistical matching using non-parametric methods to the synthetic data of KNHANES and NHIS-HEALS without identifiers did not show significant differences compared to previous research [23-25]. The resulting coefficients appear to be consistent, and our results are consistent with previous research findings, which supports the validity of our results. Research that uses synthetic data and statistical matching methods has implications for pilot studies. Analysis using synthetic data and statistical matching methods can yield novel and clinically significant findings. Although the supplementary analysis was conducted to demonstrate the consistency of plasma insulin values after synthetic data generation and statistical matching used in this study using the KNHANES dataset (Supplementary Fig. S3), which shows the consistency of insulin values despite the process of generating synthetic data and performing statistical matching, they should be validated by requesting direct data linkage using an identifier.
One of the strengths of our study lies in pioneering new approaches to big data research, particularly in overcoming privacy issues in the aggregation of nationwide big data. In South Korea, individuals can be uniquely identified through their resident registration numbers. Korea provides nationwide health insurance services to all citizens, meaning that the nation has accumulated high-quality health information for the entire population. Despite the capability to combine high-quality health data through resident registration numbers, stringent legal regulations exist at the national level, as defined by the “Personal Information Protection Act,” which prevent the unrestricted combination and linkage of data for various purposes, including research. These regulations are actively monitored by civic organizations, making it challenging to freely utilize such data for research purposes. The present study was conducted within the framework of these laws. Consequently, in accordance with South Korea’s Personal Information Protection Act, we could not directly analyze publicly available KNHANES data for data integration purposes. Instead, we analyzed it in the form of synthetic data. The generation of synthetic data is subject to physical constraints, limited to a closed server in specified locations, and extracting and exporting data is not straightforward within a restricted timeframe. Because we could use synthetic data without identifiers from the KNHANES, we attempted statistical matching between the NHIS and KNHANES synthetic datasets. Nevertheless, achieving consistent results with a certain trend holds significant meaning. In essence, synthetic data generation and matching, as in this study, can provide cost-effective and timely results while protecting personal information. This novel approach, which utilizes high-quality nationwide health insurance service data, has the potential to yield representative outcomes for the entire population, serving as an alternative to prospective cohort studies. In South Korea, only a limited number of public interest studies have undergone careful review, allowing for analysis using names and birthdates. In the case of analyzing two combined datasets in such a population, our statistical matching method, as employed in this study, could be used for validation through comparison. Validation studies may enhance the robustness of the research methodology.
Our study had several limitations. First, the study included participants with normal glucose tolerance and prediabetes but could not differentiate between the two groups due to the lack of 75 g oral glucose tolerance test data in the KNHANES. Therefore, we could not further investigate the predictive value of HOMA-IR and HOMA-β for incident diabetes in two distinct subgroups of normal glucose tolerance and prediabetes. The second limitation arose from the nature of the NHIS-HEALS dataset. The sample was drawn from individuals aged 40 years and older eligible for nationwide health check-ups. However, this approach may have limitations in addressing conditions, such as early-onset diabetes in younger individuals. Furthermore, due to the truncation of patients aged 80 years and above in the KNHANES datasets, there may be potential errors in calculating the average age. Third, as the definition of diabetes was not based on criteria set by the American Diabetes Association [26] or the World Health Organization but rather on diagnostic codes or prescription records in national claims data (NHIS-HEALS), the prevalence of diabetes could be underestimated because fasting, prandial plasma glucose, and HbA1c were not included in the definition of incident diabetes. Additionally, when excluding cases of previous diabetes mellitus from the KNHANES datasets, although all diabetes questionnaires were based on a standardized evaluation by experts, there remains the limitation of not using standard diagnostic criteria for diabetes. In this study, we were only allowed to access the data on the closed server for a limited period of up to 6 months. Due to this restricted access and the difficulty of reconstructing the data after it was deleted, we couldn’t perform subgroup analysis for high-risk populations (i.e., individuals with impaired fasting glucose [IFG]). Since individuals with IFG already experience compensatory changes in insulin resistance and insulin secretory function, HOMA-IR and HOMA-β may not provide additional predictive benefits for the future development of diabetes. Therefore, further studies are needed to clarify this issue. Moreover, we used HOMA-IR as an indicator of insulin resistance and HOMA-β as an indicator of insulin secretion. From the limitation of HOMA indices as surrogate measures of insulin resistance and β-cell function, these findings should be interpreted with caution [27,28]. Lastly, this research encountered constraints due to the unavailability of the primary data in the analysis laboratory, resulting in the generation of synthetic data for examination on a closed server within a limited timeframe. Nevertheless, there is a substantial demand for methodologies similar to ours. This study, centered on meeting these demands, makes a noteworthy contribution by implementing synthetic data and statistical matching in authentic clinical research.
In conclusion, our study on the Korean population confirmed that both insulin resistance and impaired insulin secretory function are crucial factors in the development of diabetes. Furthermore, non-identifying statistical matching with synthetic data produced similar results and trends even without using key identifiers, indicating the potential efficacy of non-identifying statistical matching. Hence, synthetic data generation and integration of these two large datasets is expected to become a reliable method in diabetes research. Continuous validation and supplementary studies are required to further enhance and refine this approach.

Supplementary Material

Supplemental Table S1.

NHIS and Synthetic KNHANES (m1–m10) before Matching
enm-2024-1986-Supplemental-Table-S1.pdf

Supplemental Table S2.

NHIS and Synthetic KNHANES (m1–m10) after Matching
enm-2024-1986-Supplemental-Table-S2.pdf

Supplemental Table S3.

Baseline Characteristics of Study Participants after KNHANES (Synthetic Data of m1–m9)-NHIS Matching according to the Development of Diabetes at the End of Follow-up
enm-2024-1986-Supplemental-Table-S3.pdf

Supplemental Table S4.

Incidence and Risk of Diabetes according to the Baseline HOMA-IR and HOMA-β Status (Matched Dataset of KNHANES Synthetic Dataset m1-m10 and NHIS-HEALS dataset [M1-M10])
enm-2024-1986-Supplemental-Table-S4.pdf

Supplemental Fig. S1.

Concept of synthetic data. Synthetic data refers to artificially generated data that simulates original data. It is created through computational algorithms and models to mimic the statistical properties and patterns of actual datasets. It is reconstituted to have the same distribution as the original data, and the same statistical analysis methods applicable to the original data can be used. Synthetic data can be used to protect sensitive information. Especially in healthcare, it enables researchers to create synthetic patient records for medical research while preserving patient privacy.
enm-2024-1986-Supplemental-Fig-S1.pdf

Supplemental Fig. S2.

Forest plots with hazard ratios (HRs) and 95% confidence interval for covariates from multivariable Cox regression models M1 to M10 are presented: (orange) the low–homeostasis model assessment of insulin resistance (HOMA-IR)/low–homeostasis model assessment of β-cell function (HOMA-β) group, the high–HOMA-IR/high–HOMA-β group, and the high–HOMA-IR/low–HOMA-β group with the low–HOMA-IR/high–HOMA-β group as the reference level; (green) age, sex with male as reference level, systolic blood pressure, total cholesterol, and body mass index (BMI).
enm-2024-1986-Supplemental-Fig-S2.pdf

Supplemental Fig. S3.

(A) Generation of validation dataset. The original Korea National Health and Nutrition Examination Survey (KNHANES) dataset (R, n=15,629), was split into a subset (Y) by randomly extracting 25% from the original dataset, and 10 synthetic datasets labeled R1, R2, ..., R10 were generated from the original data, respectively. (B) Statistical matching was performed between the subset of original dataset (Y) and the synthetic datasets (R1, R2, ..., R10) to obtain S1, S2, ..., S10, respectively. The scatterplot shows a weak but significant positive linear correlation (correlation coefficient r=0.23 to 0.25, P<2.2×10⁻¹⁶) between plasma insulin value from the original dataset (R) and that from the synthetic datasets (S1, S2, …, S10). When only (C) age- and sex-matching or (D) random matching was performed, no significant correlation was observed (r=–0.019 to 0.031, P=0.052 to 0.97).
enm-2024-1986-Supplemental-Fig-S3.pdf

Notes

CONFLICTS OF INTEREST

No potential conflict of interest relevant to this article was reported.

AUTHOR CONTRIBUTIONS

Conception or design: S.A., J.H.O., C.M.S. Acquisition, analysis, or interpretation of data: S.A., C.M.S., E.J., D.K., S.J.J. Drafting the work or revising: H.J., S.A., J.H.O., C.M.S., E.J., J.L. Final approval of the manuscript: H.J., S.A., J.H.O., C.M.S., E.J., D.K., S.J.J., J.L.

ACKNOWLEDGMENTS

This research was supported by a grant of the Korea Health Technology R&D Project through the Korea Health Industry Development Institute (KHIDI), funded by the Ministry of Health & Welfare, Republic of Korea (grant number: HI18C1140).

REFERENCES

1. Bae JH, Han KD, Ko SH, Yang YS, Choi JH, Choi KM, et al. Diabetes fact sheet in Korea 2021. Diabetes Metab J. 2022; 46:417–26.
crossref
2. Defronzo RA. Banting lecture. From the triumvirate to the ominous octet: a new paradigm for the treatment of type 2 diabetes mellitus. Diabetes. 2009; 58:773–95.
3. Kodama K, Tojjar D, Yamada S, Toda K, Patel CJ, Butte AJ. Ethnic differences in the relationship between insulin sensitivity and insulin response: a systematic review and meta-analysis. Diabetes Care. 2013; 36:1789–96.
4. Tabak AG, Jokela M, Akbaraly TN, Brunner EJ, Kivimaki M, Witte DR. Trajectories of glycaemia, insulin sensitivity, and insulin secretion before diagnosis of type 2 diabetes: an analysis from the Whitehall II study. Lancet. 2009; 373:2215–21.
crossref
5. Wang T, Lu J, Shi L, Chen G, Xu M, Xu Y, et al. Association of insulin resistance and β-cell dysfunction with incident diabetes among adults in China: a nationwide, populationbased, prospective cohort study. Lancet Diabetes Endocrinol. 2020; 8:115–24.
crossref
6. Ohn JH, Kwak SH, Cho YM, Lim S, Jang HC, Park KS, et al. 10-Year trajectory of β-cell function and insulin sensitivity in the development of type 2 diabetes: a community-based prospective cohort study. Lancet Diabetes Endocrinol. 2016; 4:27–34.
crossref
7. Morimoto A, Tatsumi Y, Deura K, Mizuno S, Ohno Y, Miyamatsu N, et al. Impact of impaired insulin secretion and insulin resistance on the incidence of type 2 diabetes mellitus in a Japanese population: the Saku study. Diabetologia. 2013; 56:1671–9.
crossref
8. Park S, Kim K, Lee BK, Ahn J. A healthy diet rich in calcium and vitamin C is inversely associated with metabolic syndrome risk in Korean adults from the KNHANES 2013-2017. Nutrients. 2021; 13:1312.
crossref
9. Park JH, Hong IY, Chung JW, Choi HS. Vitamin D status in South Korean population: seven-year trend from the KNHANES. Medicine (Baltimore). 2018; 97:e11032.
10. Yi DW, Khang AR, Lee HW, Son SM, Kang YH. Relative handgrip strength as a marker of metabolic syndrome: the Korea National Health and Nutrition Examination Survey (KNHANES) VI (2014-2015). Diabetes Metab Syndr Obes. 2018; 11:227–40.
11. Kim H, Lee M, Hwang H, Chung YJ, Cho HH, Yoon H, et al. The estimated prevalence and incidence of endometriosis with the Korean National Health Insurance Service-National Sample Cohort (NHIS-NSC): a national population-based study. J Epidemiol. 2021; 31:593–600.
crossref
12. Ahn SV, Lee E, Park B, Jung JH, Park JE, Sheen SS, et al. Cancer development in patients with COPD: a retrospective analysis of the National Health Insurance Service-National Sample Cohort in Korea. BMC Pulm Med. 2020; 20:170.
crossref
13. Son JW, Park CY, Kim S, Lee HK, Lee YS; Insulin Resistance as Primary Pathogenesis in Newly Diagnosed, Drug Naïve Type 2 Diabetes Patients in Korea (SURPRISE) Study Group. Changing clinical characteristics according to insulin resistance and insulin secretion in newly diagnosed type 2 diabetic patients in Korea. Diabetes Metab J. 2015; 39:387–94.
crossref
14. Seong SC, Kim YY, Park SK, Khang YH, Kim HC, Park JH, et al. Cohort profile: the National Health Insurance Service-National Health Screening Cohort (NHIS-HEALS) in Korea. BMJ Open. 2017; 7:e016640.
crossref
15. Matthews DR, Hosker JP, Rudenski AS, Naylor BA, Treacher DF, Turner RC. Homeostasis model assessment: insulin resistance and beta-cell function from fasting plasma glucose and insulin concentrations in man. Diabetologia. 1985; 28:412–9.
crossref
16. Gonzalez JC, van Delden A, de Waal T. Assessment of the effect of constraints in a new multivariate mixed method for statistical matching. Computational Stat Data Anal. 2023; 177:107569.
17. Nowok B, Raab GM, Dibben C. Synthpop: bespoke creation of synthetic data in R. J Stat Softw. 2016; 74:1–26.
18. Yabe D, Seino Y. Type 2 diabetes via β-cell dysfunction in east Asian people. Lancet Diabetes Endocrinol. 2016; 4:2–3.
crossref
19. Foraker RE, Yu SC, Gupta A, Michelson AP, Pineda Soto JA, Colvin R, et al. Spot the difference: comparing results of analyses from real patient data and synthetic derivatives. JAMIA Open. 2020; 3:557–66.
crossref
20. Rankin D, Black M, Bond R, Wallace J, Mulvenna M, Epelde G. Reliability of supervised machine learning using synthetic data in health care: model to preserve privacy for data sharing. JMIR Med Inform. 2020; 8:e18910.
crossref
21. Ping H, Stoyanovich J, Howe B. DataSynthesizer: privacy-preserving synthetic datasets. In : In: SSDBM ‘17 Proceedings of the 29th International Conference on Scientific and Statistical Database Management; 2017 Jun 27-29; Chicago, IL. Ney York, NY: Association for Computing Machinery;2017. p. 1–5.
22. Reiter JP. Using CART to generate partially synthetic public use microdata. J Off Stat. 2005; 21:441–62.
23. D’Orazio M, Di Zio M, Scanu M. Statistical matching: theory and practice. New York: John Wiley & Sons;2006.
24. D’Alberto R, Raggi M. Integrating rather than collecting: statistical matching in the data flood era. Stat Pap. 2024; 65:2135–63.
crossref
25. De Waal AG. Statistical matching: experimental results and future research questions [Internet]. Den Haag: CBS;2015. [cited 2024 Jun 21]. Available from: https://pure.uvt.nl/ws/portalfiles/portal/48726611/MTO_d_Waal_statistical_matching_2015.pdf.
26. ElSayed NA, Aleppo G, Aroda VR, Bannuru RR, Brown FM, Bruemmer D, et al. 2. Classification and diagnosis of diabetes: standards of care in diabetes-2023. Diabetes Care. 2023; 46(Suppl 1):S19–40.
27. Park SY, Gautier JF, Chon S. Assessment of insulin secretion and insulin resistance in human. Diabetes Metab J. 2021; 45:641–54.
crossref
28. Lee MJ, Bae JH, Khang AR, Yi D, Yun MS, Kang YH. Triglyceride-glucose index predicts type 2 diabetes mellitus more effectively than oral glucose tolerance test-derived insulin sensitivity and secretion markers. Diabetes Res Clin Pract. 2024; 210:111640.
crossref

Fig. 1.
Flow chart of the study. This figure illustrates the matching process between the National Health Interview Survey (NHIS) data and the synthetic data generated from the Korea National Health and Nutrition Examination Survey (KNHANES). Initially, 10 synthetic datasets (m1, ..., m10) were created from the KNHANES data. Subsequently, each of these synthetic datasets was matched with the NHIS source data, resulting in the 10 matched datasets (M1, ..., M10). Specifically, a statistically matched dataset (M10) was incorporated by linking KNHANES synthetic data (m10) with the National Health Insurance Service-National Health Screening Cohort (NHIS-HEALS) dataset. In total, 24,617 individuals from the m10 dataset, which includes 2,512, 5,919, 6,542, and 4,421 participants in the years 2007, 2008, 2009, 2010, and 2015, respectively, and 514,866 individuals from NHIS-HEALS, including 186,980, 227,656, 223,551, 226,276, and 217,477 examinees in 2007, 2008, 2009, 2010, and 2015, respectively, were linked using statistical matching method. The participants in the same year of NHIS-HEALS and KNHANES were matched to ensure high-quality matching. As NHIS data includes tests that patients can undergo annually, duplication of the data may occur; thus, the previous year’s NHIS-KNHANES matched data were removed before the corresponding year’s matching. Using the same method above, M1–M9 were constructed by concatenating the KNHANES synthetic datasets m1–m9 and the NHIS-HEALS dataset, respectively—diabetes mellitus (DM) and fasting blood glucose (FBS). HOMA-IR, homeostasis model assessment of insulin resistance; HOMA-β, homeostasis model assessment of -βcell function. aExclusion criteria: (1) missing values, (2) previous DM history (questionnaire, FBS ≥126 mg/dL), (3) medical beneficiaries, (4) age <80 years; bExclusion criteria: (1) missing values, (2) previous DM history (questionnaire, FBS ≥126 mg/dL), (3) age <40 years.
enm-2024-1986f1.tif
Fig. 2.
Kaplan-Meier curve of the risk for diabetes according to homeostasis model assessment of insulin resistance (HOMA-IR) and homeostasis model assessment of β-cell function (HOMA-β) statuses (representative matched dataset of Korea National Health and Nutrition Examination Survey synthetic dataset m10 and National Health Insurance Service-National Health Screening Cohort [NHIS-HEALS] dataset, M10).
enm-2024-1986f2.tif
Fig. 3.
Forrest plot of the risk of diabetes according to the baseline homeostasis model assessment of insulin resistance (HOMA-IR) and homeostasis model assessment of β-cell function (HOMA-β) status (matched dataset of Korea National Health and Nutrition Examination Survey synthetic dataset m1–m10 and National Health Insurance Service-National Health Screening Cohort [NHIS-HEALS] dataset: M1–M10). Adjusted hazard ratios (HRs) of the low–HOMA-IR/low–HOMA-β group (orange), the high–HOMA-IR/high–HOMA-β group (green), and the high–HOMA-IR/low–HOMA-β group (blue) were calculated using the low–HOMA-IR/high–HOMA-β group as a reference.
enm-2024-1986f3.tif
enm-2024-1986f4.tif
Table 1.
Baseline Characteristics of Study Participants after KNHANES (Synthetic Data of m10)-NHIS Matching (M10) according to the Development of Diabetes at the End of Follow-up
Characteristic Progressor to diabetes (n=207) Non-progressor (n=4,365) P value
Female sex 121 (58.50) 2,731 (62.60) 0.263
Age, yr 62.39±9.48 59.48±9.27 <0.001a
Employed insurance 132 (63.80) 2,639 (60.50) 0.379
Smoking 77 (37.20) 1,408 (32.30) 0.159
Hypertension 90 (43.50) 1,203 (27.06) <0.001a
BMI, kg/m2 24.95±2.81 23.84±2.97 <0.001a
Waist circumference, cm 85.24±8.42 82.18±8.80 <0.001a
Fasting plasma glucose, mg/dL 102.29±11.26 94.63±9.40 <0.001a
Hemoglobin, g/dL 13.93±1.52 13.76±1.41 0.096
Systolic BP, mm Hg 118.62±18.33 119.13±18.16 0.692
Diastolic BP, mm Hg 76.59±10.63 77.08±10.70 0.521
Total cholesterol, mmol/L 197.17±36.18 194.72±35.36 0.330
Fasting insulin, µIU/mL 11.69±8.73 9.42±5.25 <0.001a
HDL-C, mmol/L 48.15±10.98 48.79±11.39 0.425
Triglycerides, mmol/L 134.51±91.57 135.29±104.54 0.916
HOMA-IR 3.02±2.52 2.23±1.39 <0.001a
HOMA-β 110.55±66.93 113.52±64.17 0.516
HOMA-IR/HOMA-β status <0.001a
 HOMA-IR (low), HOMA-β (high) 14 (6.80) 645 (14.80)
 HOMA-IR (low), HOMA-β (low) 52 (25.10) 1,492 (34.20)
 HOMA-IR (high), HOMA-β (high) 81 (39.10) 1,589 (36.40)
 HOMA-IR (high), HOMA-β (low) 60 (29.00) 639 (14.60)

Values are expressed as number (%) or mean±standard deviation. P values were calculated using Student’s t test or chi-square test.

KNHANES, Korea National Health and Nutrition Examination Survey; NHIS, National Health Insurance Service; BMI, body mass index; BP, blood pressure; HDL-C, high-density lipoprotein cholesterol; HOMA-IR, homeostasis model assessment of insulin resistance; HOMA-β, homeostasis model assessment of β-cell function.

a Statistical significance.

Table 2.
Incidence and Risk of Diabetes according to the Baseline HOMA-IR and HOMA-β Status (Matched Dataset of KNHANES Synthetic Dataset m10 and NHIS-HEALS Dataset or M10)
No. Person-year (IRR) Model A
Model B
Model C
HR (95% CI) P value HR (95% CI) P value HR (95% CI) P value
HOMA-IR (low), HOMA-β (high) 14 4,159.82 1 (Ref) - 1 (Ref) - 1 (Ref) -
HOMA-IR (low), HOMA-β (low) 52 8,439.04 (1.83) 1.83 (1.02–3.31) 0.044a 1.70 (0.94–3.07) 0.080 1.68 (0.93–3.04) 0.085
HOMA-IR (high), HOMA-β (high) 81 10,021.28 (2.40) 2.40 (1.36–4.23) 0.003a 2.31 (1.31–4.07) 0.004a 1.81 (1.01–3.22) 0.045a
HOMA-IR (high), HOMA-β (low) 60 4,048.49 (4.40) 4.40 (2.46–7.86) <0.001a 4.07 (2.27–7.29) <0.001a 3.36 (1.86–6.05) <0.001a

Model A: unadjusted; Model B: adjusted for age and sex; Model C: adjusted for age, sex, systolic blood pressure, body mass index, and total cholesterol.

HOMA-IR, homeostasis model assessment of insulin resistance; HOMA-β, homeostasis model assessment of β-cell function; KNHANES, Korea National Health and Nutrition Examination Survey; NHIS-HEALS, National Health Insurance Service-National Health Screening Cohort; IRR, incidence risk ratio; HR, hazard ratio; CI, confidence interval.

a Statistical significance.

TOOLS
Similar articles