Abstract
Background
Methods
Results
SUPPLEMENTARY MATERIALS
Supplementary Fig. 1.
Notes
ACKNOWLEDGMENTS
REFERENCES
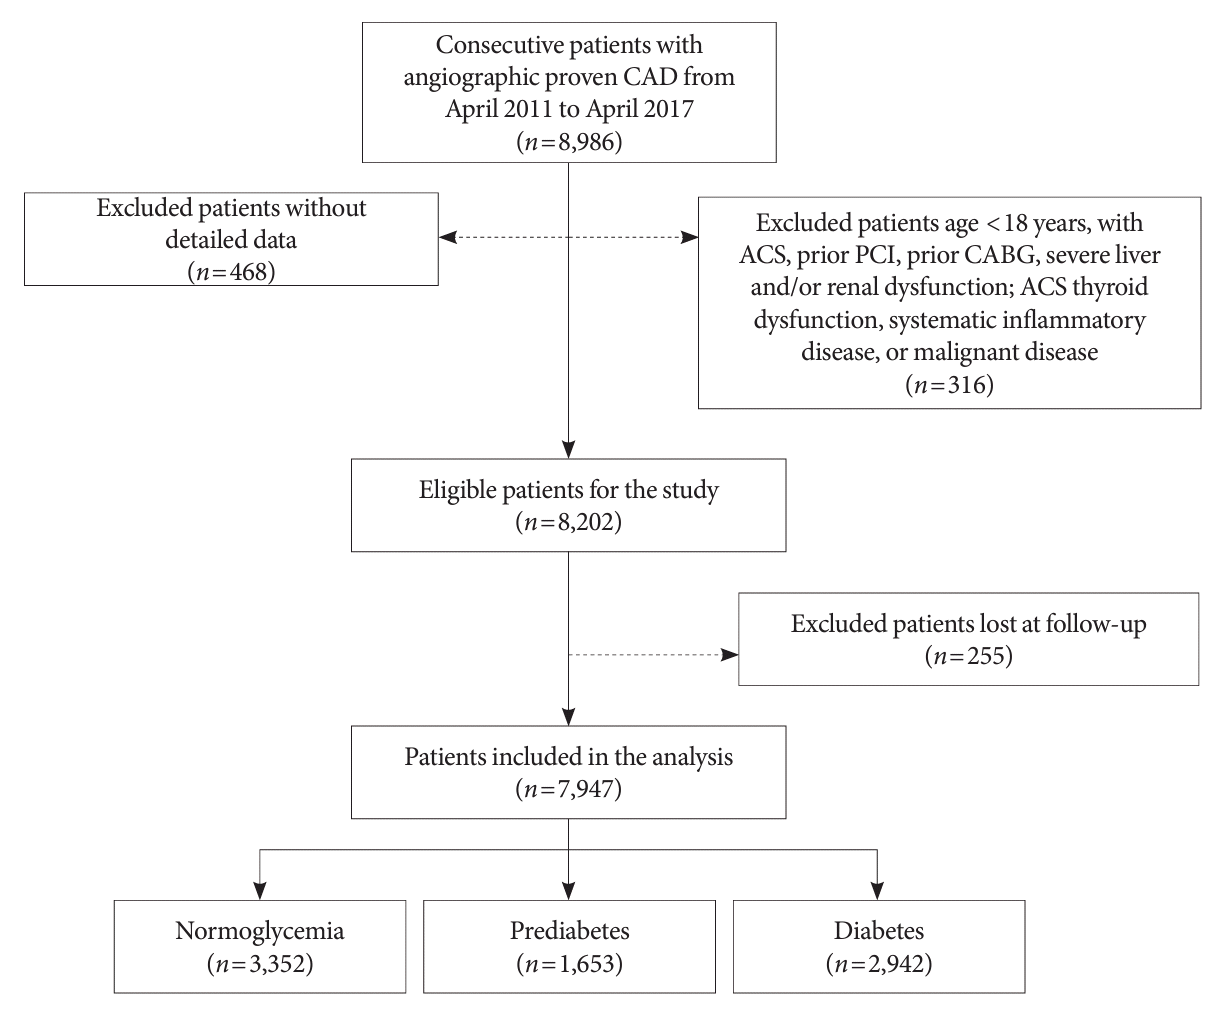
Fig. 1.

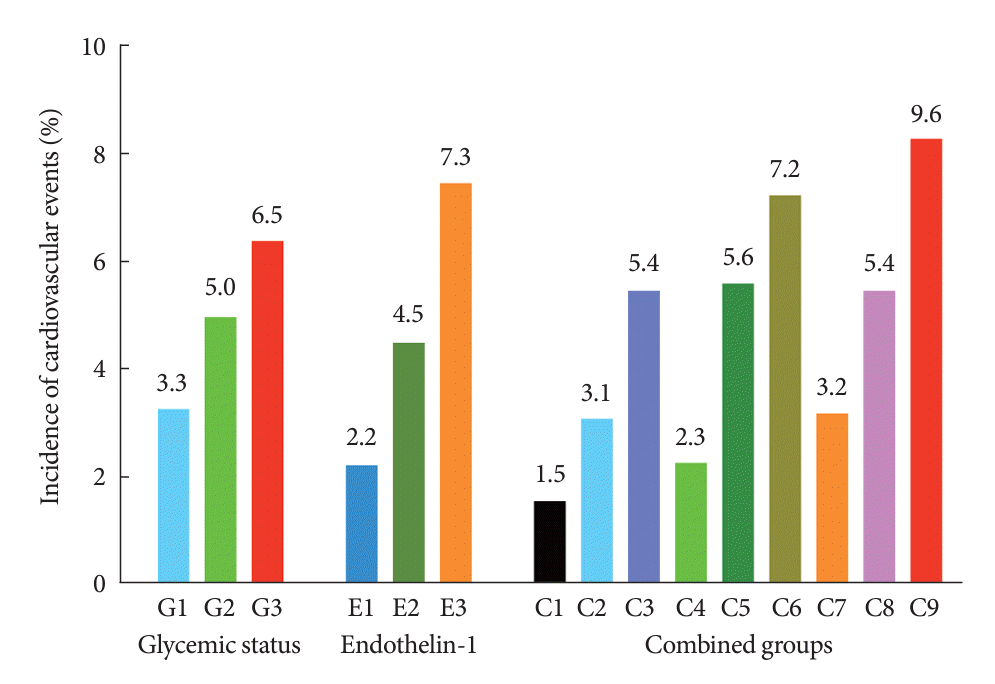
Fig. 2.

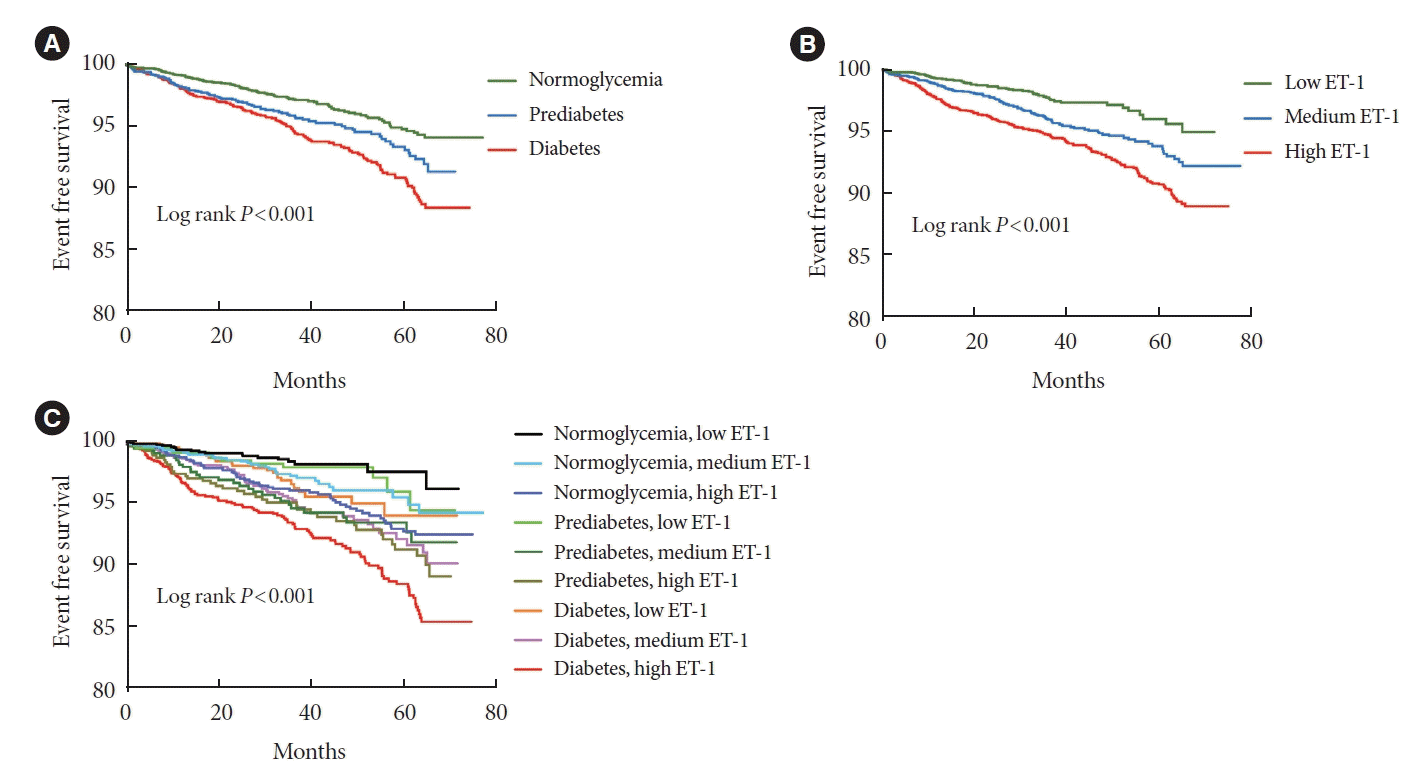
Fig. 3.

Table 1.
Values are presented as mean±standard deviation, number (%), or median (interquartile range).
BMI, body mass index; FPG, fasting plasma glucose; HbA1c, glycosylated hemoglobin; LDL-C, low-density lipoprotein cholesterol; HDL-C, high-density lipoprotein cholesterol; NT-proBNP, N-terminal pro–B-type natriuretic peptide; PCI, percutaneous coronary artery intervention; CABG, coronary artery bypass grafting.
Table 2.
| Variable | Events/Subject |
HR (95% CI) |
|
|---|---|---|---|
| Crude model | Adjusted model | ||
| Composite cardiovascular events | |||
| Low ET-1 | 58/2,628 | Reference | Reference |
| Medium ET-1 | 115/2,565 | 1.743 (1.270–2.391)a | 1.465 (1.051–2.043)a |
| High ET-1 | 208/2,754 | 2.509 (1.870–3.366)a | 1.750 (1.272–2.406)a |
| Nonfatal myocardial infarction | |||
| Low ET-1 | 9/2,628 | Reference | Reference |
| Medium ET-1 | 30/2,565 | 3.038 (1.441–6.403)a | 3.167 (1.432–7.002)a |
| High ET-1 | 58/2,754 | 4.848 (2.393–9.820)a | 4.501 (2.090–9.692)a |
| Stroke | |||
| Low ET-1 | 39/2,628 | Reference | Reference |
| Medium ET-1 | 49/2,565 | 1.062 (0.696–1.619) | 0.977 (0.625–1.528) |
| High ET-1 | 75/2,754 | 1.242 (0.838–1.840) | 0.997 (0.646–1.539) |
| Cardiovascular death | |||
| Low ET-1 | 10/2,628 | Reference | Reference |
| Medium ET-1 | 36/2,565 | 3.222 (1.598–6.497)a | 2.077 (1.016–4.244)a |
| High ET-1 | 75/2,754 | 5.463 (2.815–10.600)a | 2.493 (1.255–4.953)a |
Univariate and multivariate Cox proportional hazards regression analysis was performed in crude and adjusted models respectively. Model adjusted for age, sex, body mass index, current smoking, hypertension, peripheral artery disease, family history of coronary artery disease, left ventricular ejection fraction, glycosylated hemoglobin, N-terminal pro–B-type natriuretic peptide, triglyceride, low-density lipoprotein cholesterol, high-density lipoprotein cholesterol, lipoprotein(a), fibrinogen, diseased vessels, and baseline statins, aspirin, angiotensin II receptor blockers, β-blockers, and calcium channel blockers treatments.
ET-1, endothelin-1; HR, hazard ratio; CI, confidence interval.
Table 3.
| ET-1 | Events/Subject |
HR (95% CI) |
|
|---|---|---|---|
| Crude model | Adjusted model | ||
| Normoglycemia | |||
| Low ET-1 | 19/1,232 | Reference | Reference |
| Medium ET-1 | 33/1,073 | 1.724 (0.980–3.033) | 1.415 (0.790–2.534) |
| High ET-1 | 57/1,047 | 2.450 (1.455–4.126)a | 1.695 (0.983–2.922) |
| Prediabetes | |||
| Low ET-1 | 13/576 | 1.379 (0.681–2.792) | 1.099 (0.536–2.250) |
| Medium ET-1 | 30/537 | 2.920 (1.642–5.192)a | 2.091 (1.152–3.796)a |
| High ET-1 | 39/540 | 3.318 (1.913–5.753)a | 1.910 (1.069–3.413)a |
| Diabetes | |||
| Low ET-1 | 26/820 | 2.007 (1.111–3.626) | 1.497 (0.803–2.791) |
| Medium ET-1 | 52/955 | 2.941 (1.738–4.977)a | 1.932 (1.113–3.352)a |
| High ET-1 | 112/1,157 | 4.640 (2.848–7.559)a | 2.661 (1.582–4.476)a |
Univariate and multivariate Cox proportional hazards regression analysis was performed in crude and adjusted models respectively. Model adjusted for age, sex, body mass index, current smoking, hypertension, peripheral artery disease, family history of coronary artery disease, left ventricular ejection fraction, N-terminal pro–B-type natriuretic peptide, triglyceride, low-density lipoprotein cholesterol, high-density lipoprotein cholesterol, lipoprotein(a), fibrinogen, diseased vessels, and baseline statins, aspirin, angiotensin II receptor blockers, β-blockers, and calcium channel blockers treatments.
ET-1, endothelin-1; HR, hazard ratio; CI, confidence interval.


 PDF
PDF Citation
 Print
Print


 XML Download