Journal List > Diabetes Metab J > v.48(5) > 1516088718

Park, Lee, Choi, Min, Han, Ahn, Lim, Kim, Ahn, Choi, Yoon, and the Practical Evidence of Antidiabetic Combination Therapy in Korea (PEAK) study investigators: Efficacy and Safety of Alogliptin-Pioglitazone Combination for Type 2 Diabetes Mellitus Poorly Controlled with Metformin: A Multicenter, Double-Blind Randomized Trial

Abstract

Background

Guidelines for switching to triple combination therapy directly after monotherapy failure are limited. This study investigated the efficacy, long-term sustainability, and safety of either mono or dual add-on therapy using alogliptin and pioglitazone for patients with type 2 diabetes mellitus (T2DM) who did not achieve their target glycemic range with metformin monotherapy.

Methods

The Practical Evidence of Antidiabetic Combination Therapy in Korea (PEAK) was a multicenter, placebo-controlled, double-blind, randomized trial. A total of 214 participants were randomized to receive alogliptin+pioglitazone (Alo+Pio group, n=70), alogliptin (Alo group, n=75), or pioglitazone (Pio group, n=69). The primary outcome was the difference in glycosylated hemoglobin (HbA1c) levels between the three groups at baseline to 24 weeks. For durability, the achievement of HbA1c levels <7% and <6.5% was compared in each group. The number of adverse events was investigated for safety.

Results

After 24 weeks of treatment, the change of HbA1c in the Alo+Pio, Alo, and Pio groups were –1.38%±0.08%, –1.03%±0.08%, and –0.84%±0.08%, respectively. The Alo+Pio group had significantly lower HbA1c levels than the other groups (P=0.0063, P<0.0001) and had a higher proportion of patients with target HbA1c achievement. In addition, insulin sensitivity and β-cell function, lipid profiles, and other metabolic indicators were also improved. There were no significant safety issues in patients treated with triple combination therapy.

Conclusion

Early combination triple therapy showed better efficacy and durability than the single add-on (dual) therapy. Therefore, combination therapy with metformin, alogliptin, and pioglitazone is a valuable early treatment option for T2DM poorly controlled with metformin monotherapy.

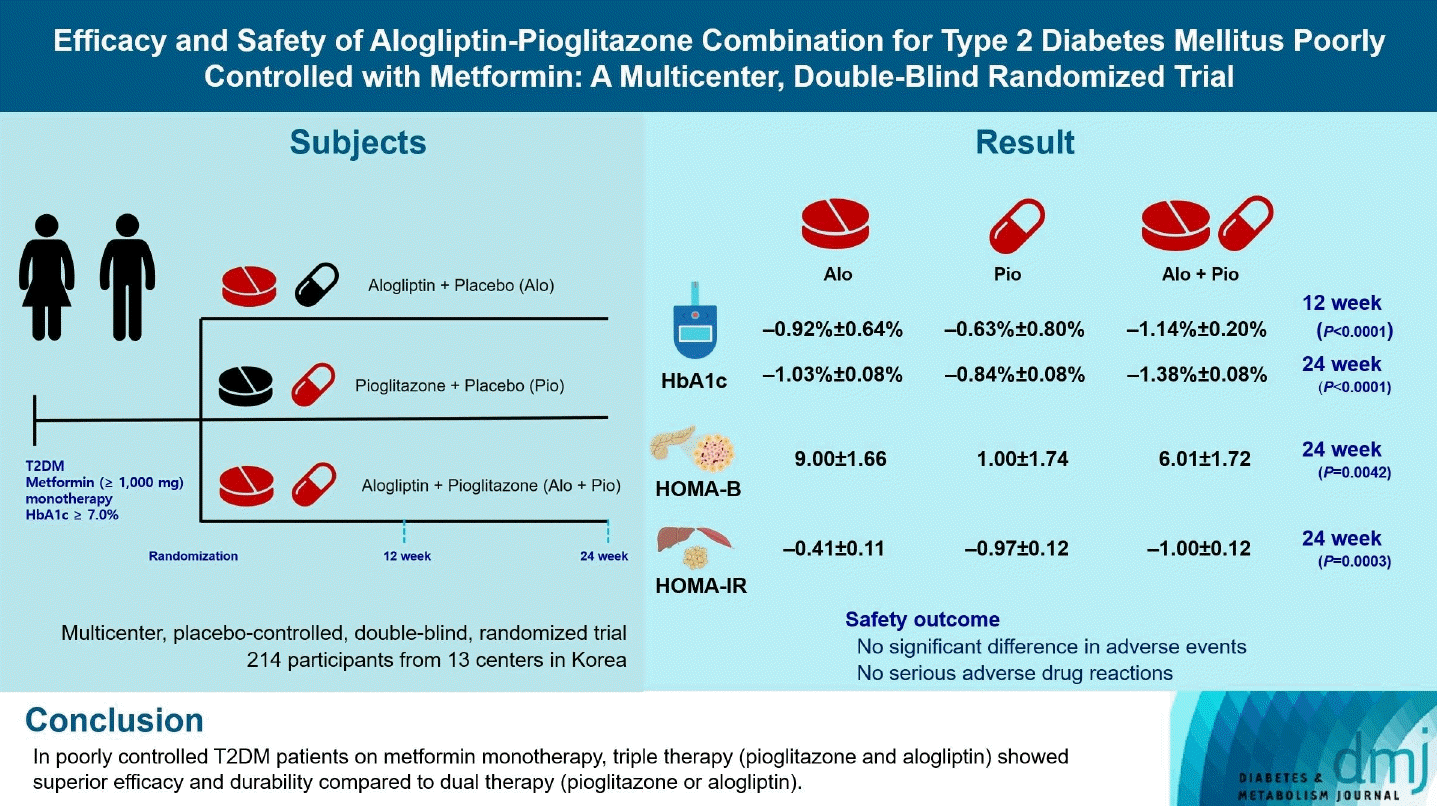
GRAPHICAL ABSTRACT

Highlights

• In metformin-treated T2DM, pioglitazone and alogliptin dual therapy outperformed mono add-on.
• Pioglitazone and alogliptin dual add-on therapy improve β-cell function and insulin resistance.
• No serious adverse events were in pioglitazone and alogliptin dual add-on therapy group.

INTRODUCTION

Type 2 diabetes mellitus (T2DM) is a highly prevalent, yet poorly controlled chronic disorder characterized by hyperglycemia. Approximately 16.8% of adults have diabetes: however, less than one-third of patients achieve the target glycemic level (glycosylated hemoglobin [HbA1c] <6.5%) [1,2]. For those who fail to reach the target glycemic level, current guidelines recommend a stepwise addition of oral hypoglycemic agents (OHAs). Metformin remains the most commonly prescribed first-line drug, with 77.8% of patients (39.8% dual therapy, 38% triple therapy or more) adhering to multiple OHAs [2]. Interestingly, cumulative evidence suggests the benefits of early combination therapy with antidiabetic drugs [3-5]. However, there is little evidence regarding the benefits of combination therapy in Asian populations. Given the availability of multiple classes of OHAs on the market [6], it is important to validate the optimal combination of OHAs to achieve target glycemic levels in patients with T2DM.
Among the various classes of OHAs, thiazolidinedione decreases insulin resistance primarily by acting as a peroxisome proliferator-activated receptor-gamma (PPARγ) agonist in adipose tissues, resulting in increased insulin-mediated glucose uptake in peripheral tissues [7]. Dipeptidyl peptidase-4 (DPP4) inhibitors potentiate glucose-stimulated insulin secretion from pancreatic β-cells by increasing serum incretin levels [8]. The key process in T2DM pathogenesis involves increased insulin resistance and a subsequent progressive decline in β-cell function. In this context, a combination of thiazolidinedione and DPP-4 inhibitors may be ideal for stabilizing glucose homeostasis in patients with T2DM. Pioglitazone is the most commonly used thiazolidinedione, with proven long-term efficacy and safety [9,10]. Alogliptin is a selective and potent DPP-4 inhibitor with proven efficacy and safety [11-13]. However, to the best of our knowledge, the efficacy and safety of combining pioglitazone with alogliptin after failure of metformin monotherapy has not been thoroughly studied in Asian populations [14]. To address this issue, we investigated the efficacy and safety of metformin, alogliptin, and pioglitazone combination therapy compared with metformin, alogliptin or metformin, and pioglitazone in Korean patients with T2DM who had insufficient control with metformin monotherapy.

METHODS

Study design

The Practical Evidence of Antidiabetic Combination Therapy in Korea (PEAK) study was a multicenter, double-blinded, randomized, placebo-controlled, three-arm parallel trial conducted across 13 centers in Korea. Between January 30, 2015 and October 4, 2018, we enrolled 279 patients with T2DM who were receiving metformin (≥1,000 mg). Of these, 214 eligible participants were randomized into one of three treatment groups: the metformin+alogliptin+pioglitazone placebo (Alo) group (n=75), the metformin+pioglitazone+alogliptin placebo (Pio) group (n=69), and the metformin+alogliptin+pioglit azone (Alo+Pio) group (n=70). Following a 4-week screening period, each patient was prescribed OHAs corresponding to their assigned group, maintaining the same metformin dosage from the screening period until the end of the trial (Supplementary Fig. 1).
The participants underwent assessments every 12 weeks for 24 weeks from the initiation of the randomized treatment. In addition to pharmaceutical intervention, all participants received education on diet, exercise, and lifestyle modification. They were also provided a diary for self-monitoring blood glucose. Demographic, anthropometric (height, weight, and body mass density), lifestyle (alcohol consumption and smoking habits), and medication data were collected. Physical examinations and laboratory assessments were performed at each visit.
Written informed consent was obtained from all study participants. The study was approved by the Institutional Review Board at each center and conducted following the ethical principles of the Declaration of Helsinki (Approval No: KC14MIM V0127) (Clinical Trial Registration Number: clinicaltrial.gov, NCT02231021).

Study participants

This study’s inclusion criteria were as follows: age between 19 to 75 years, diagnosis of T2DM a minimum of 6 months prior to the initiation of the study, body mass index (BMI) within the range of 18.5 to 45 kg/m2, baseline HbA1c levels from 7.0% to 10.0%, indicating suboptimal glycemic control, despite being on a stable metformin regimen (≥1,000 mg of the maximally tolerated dose), fasting C-peptide level >0.78 ng/mL (0.26 nmol/L), systolic/diastolic blood pressure ≤160/100 mm Hg, and a hemoglobin level of at least 12 g/dL for men and 10 g/dL for women.
Exclusion criteria included the use of medications that significantly influence blood glucose control, such as glucocorticoids and pregnancy or lactation. Those with clinically significant liver disease, manifested by aspartate aminotransferase and alanine aminotransferase levels ≥2.5 times the upper normal limit, or substantial renal disease, indicated by an estimated glomerular filtration rate of <50 mL/min, were also ineligible. Additional conditions for exclusion included New York Heart Association (NYHA) Class III–IV heart failure classification; diagnoses of hypopituitarism or adrenal insufficiency; a history of major surgical procedures, severe infections, or severe trauma within the past 6 months; a history of malignancy within the past 5 years; and the presence of active bladder cancer. Individuals with rare hereditary problems, such as galactose intolerance, Lapp lactase deficiency, or glucose-galactose malabsorption, were deemed unsuitable for this study. A documented history of hypersensitivity to alogliptin, pioglitazone, or any of their components also led to exclusion, as did heavy alcohol consumption patterns (≥30 g daily, ≥5 days a week).
The study protocol stipulated that if a participant exhibited an HbA1c level >9% and demonstrated symptoms of hyperglycemia at the 12-week visit, their involvement in the clinical trial would be discontinued, and rescue medications would be prescribed to maintain glucose control.

Outcome assessment

This study aimed to assess the efficacy and safety of alogliptin and pioglitazone as combination therapy compared to each drug individually in managing patients with T2DM who failed to achieve glycemic control with metformin monotherapy. The principal efficacy endpoint was the change in HbA1c level from baseline to week 24. Durability was assessed by comparing the number of participants who attained their target HbA1c levels (<7.0% or <6.5%) across each group at the end of 24 weeks. Secondary endpoints included changes in BMI, insulin sensitivity, β-cell function, glycoalbumin (GA), and the GA/HbA1c ratio to evaluate glucose variability as well as fasting insulin and glucose levels from baseline to week 24. The incidence rate of rescue treatments within the 24-week period was also recorded. Our exploratory data analysis evaluated the changes in lipid profile parameters, including total cholesterol, triglycerides, high-density lipoprotein cholesterol (HDL-C), low-density lipoprotein cholesterol (LDL-C), free fatty acid (FFA), and apolipoprotein B, from baseline to week 24. Safety endpoints included the incidence rates of hypoglycemia, severe hypoglycemia (defined as hypoglycemia requiring the intervention of another person to elevate glucose levels and promote neurological recovery), and adverse events of special interest. These include heart failure, cardiovascular effects, edema, weight gain, bladder tumors, macular edema, bone fractures, pancreatitis, hypersensitivity to alogliptin or pioglitazone, and serious adverse events. All adverse events were meticulously monitored and documented by an investigator who adjudicated the severity and potential relationship with the medication. Efficacy at 12 and 24 weeks was evaluated using standard laboratory measurements conducted at a central laboratory (Meditree Central Lab Service, Seoul, Korea).

Statistical analysis

Baseline characteristics are expressed as mean±standard deviation for normally distributed variables or as median (interquartile range) for non-normally distributed variables. Changes from baseline in efficacy variables were analyzed using the analysis of covariance model, with treatment as a fixed factor and the baseline value serving as a continuous covariate. The primary analysis compared the least-squares mean change in HbA1c levels from baseline to week 24 between the treatment groups. The Tukey-Kramer adjustment was used for post hoc analyses, with the significance level set at α<0.05. Intra-group differences in measurements from baseline to weeks 12 and 24 were assessed using the paired t-test or Wilcoxon signed-rank test. The proportion of patients achieving HbA1c levels <7.0% and <6.5% at week 24 was analyzed using the chi-square test, depending on the data distribution. Missing values were extrapolated using the last observation carried forward in all the efficacy analyses. The study was designed to include a randomized sample size of 100 patients per treatment arm, providing 90% power to detect a 0.48% difference in HbA1c change (with an assumed standard deviation of 0.73%) between the Alo+Pio group and either the Alo or Pio group at a two-sided significance level of 0.05. This calculation accounts for an anticipated dropout rate of 20%. Randomization of the study groups was stratified according to participating sites and baseline HbA1c levels (<8.5% or ≥8.5%). All statistical analyses were performed using the SAS software version 9.4 (SAS Institute, Cary, NC, USA). Statistical significance was set at P<0.05.

RESULTS

Baseline characteristics

Of the 216 eligible participants, 214 were randomized into three groups (Alo group, n=75; Pio group, n=69; Alo+Pio group, n=70) (Supplementary Figs. 1 and 2). The baseline characteristics of the study participants measured at the randomization point are described in Table 1. The average age of the study population was 58.9±9.2 years. The mean HbA1c was 8.0%±0.4%, and the average BMI was calculated to be 25.4±3.3 kg/m². The mean duration of T2DM was 9.1±5.7 years. There were no significant differences in mean age, sex distribution, BMI, HbA1c levels, blood pressure, fasting glucose, or lipid profiles among the three groups after randomization. There were no significant differences in alcohol consumption, smoking history, diabetes duration, physical examination, hypertension, dyslipidemia, other comorbidities, medication, and medical compliance (Table 1).

Comparison of glycemic efficacy between alogliptin/pioglitazone combination therapy and alogliptin or pioglitazone mono add-on therapy

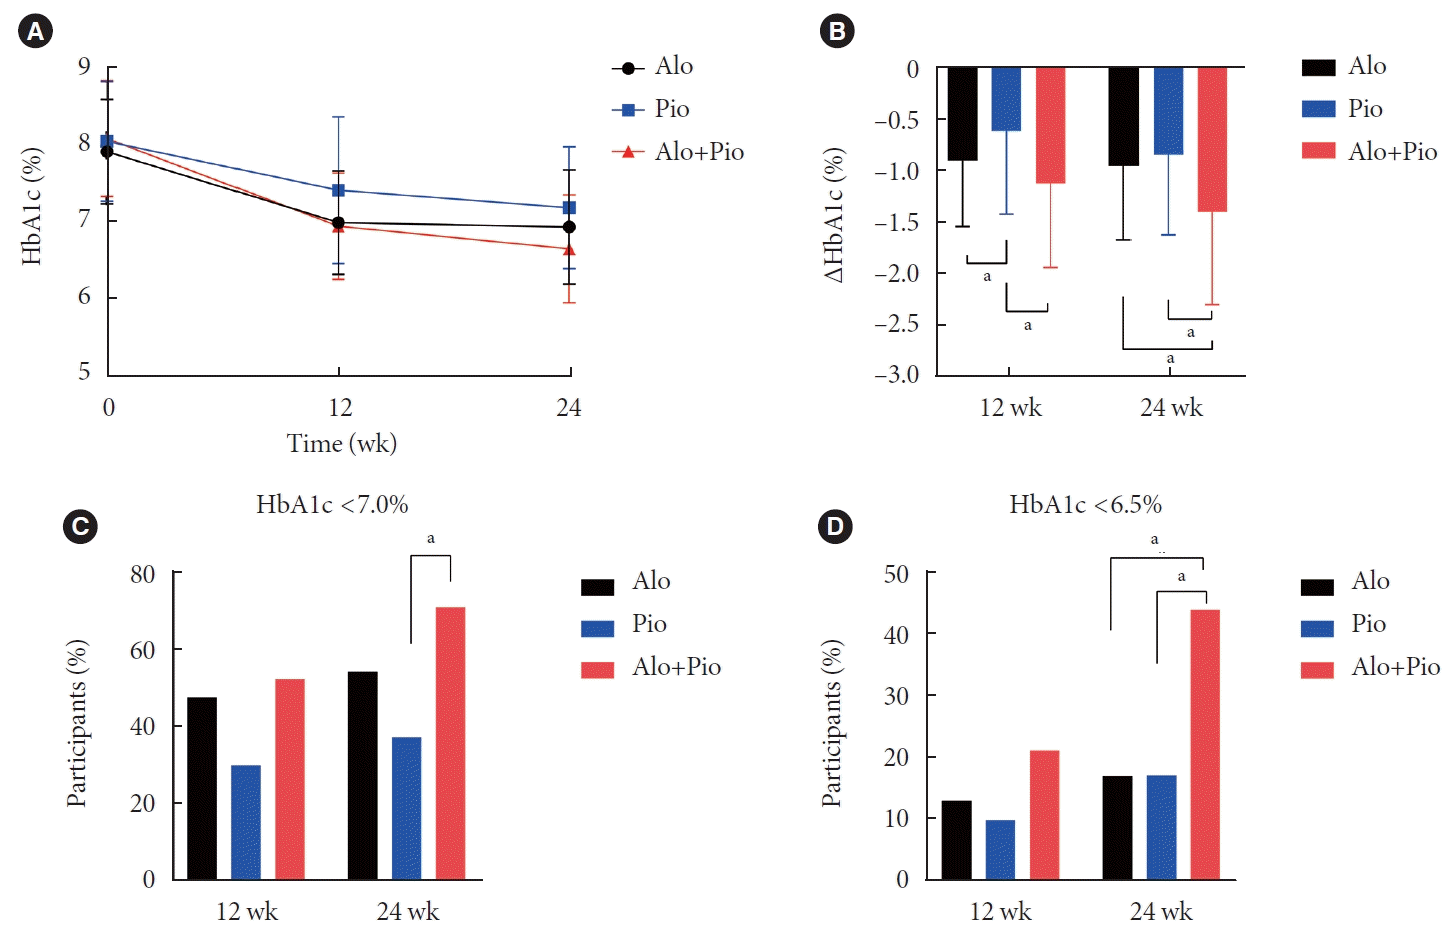
Over the study period, the average HbA1c level significantly decreased in all groups, with the Alo+Pio group showing the greatest reduction. From baseline to week 12, HbA1c decreased by –1.14%±0.2%, –0.92%±0.64%, and –0.63%±0.8% in the Alo+Pio, Alo, and Pio groups, respectively. This trend persisted through week 24, with the Alo+Pio group showing a further decrease to –1.38%±0.08%, while the Alo and Pio groups reached –1.03%±0.08% and –0.84%±0.08%, respectively (Fig. 1A and B). At week 24, 71.43% of the participants in the Alo+Pio group achieved HbA1c levels below 7.0%, significantly higher than that in the Alo (54.67%) and Pio (37.68%) groups (Fig. 1C). Similarly, the Alo+Pio group had a higher proportion of participants (44.29%) achieving an HbA1c level of less than 6.5% than the Alo (17.33%) and Pio groups (17.39%) (Fig. 1D). Furthermore, when comparing the rate of change (%) in HbA1c at the 12- and 24-week intervals across the groups, the Alo+Pio group demonstrated a more pronounced, continuous decrease in HbA1c. The number of participants achieving the target HbA1c level of less than 6.5% was significantly higher in the triple therapy group than in the other groups. None of the participants required hyperglycemic rescue treatment, a provision intended for individuals with HbA1c levels exceeding 9% at the 12-week checkpoint. In summary, the Alo+Pio combination was the most effective at reducing HbA1c levels, ensuring that a larger proportion of participants achieved the target glycemic range.

Comparison of metabolic parameters between alogliptin/pioglitazone combination therapy and alogliptin or pioglitazone mono add-on therapy

We further explored whether triple or dual combination add-on OHA regimens changed the metabolic parameters in patients with T2DM. The mean body weight and BMI in the Alo+Pio group (0.63±0.93 kg/m2) increased significantly at 24 weeks from baseline compared to the Alo group (–0.05±0.74 kg/m2), with no discernible difference when juxtaposed with the Pio group (0.50±0.78 kg/m2) (P<0.0001). The Alo+Pio cohort witnessed a substantial reduction in the mean change of fasting glucose (–39.00±3.21 mg/dL) when contrasted with the Alo (–25.57±3.10 mg/dL) and Pio (–25.43±3.22 mg/dL) groups, a difference that was statistically significant at 24 weeks (P<0.0001). As for fasting insulin, a notable decrease was identified in the Pio (–1.54±0.28 μU/mL) and Alo+Pio (–1.4±0.28 μU/mL) but not in Alo (0.02±0.27 μU/mL) groups (P<0.0001). Homeostatic model assessment for insulin resistance (HOMAIR) was significantly decreased in the Pio (–0.97±0.12) and Alo+Pio (–1.00±0.12) group, underscoring the benefits of pioglitazone’s efficacy in ameliorating insulin resistance. With regard to β-cell function, there was a significant increase of homeostatic model assessment for β-function (HOMA-β) in the Alo (9.00±1.66) and Alo+Pio (6.01±1.72) groups which reached a statistically significant difference from the Pio group (1.00±1.74, P=0.0042). The mean change in GA levels from baseline to 24 weeks demonstrated a significant drop in the Alo+ Pio group than that in the Pio group (P=0.0005). However, the change in GA/HbA1c ratio was not significantly different among the three groups (P=0.1610) (Table 2). Overall, the combination therapy of Alo and Pio concurrently enhanced insulin resistance and β-cell functionality in patients with T2DM.

Comparison of lipid profiles between alogliptin/ pioglitazone combination therapy and alogliptin or pioglitazone mono add-on therapy

Previous studies suggested a possible correlation between thiazolidinedione, DPP-4 inhibitor, and lipid metabolism [15-17]. Based on these previous reports, we further studied whether different alogliptin and/or pioglitazone regimens could change the lipid profiles in patients with T2DM. Upon evaluating the lipid profile changes at 24 weeks relative to the baseline, a trend towards a decrease in total cholesterol was observed exclusively in the Alo group; however, this trend was not statistically significant across the three groups. For triglycerides, the Pio (–37.09±11.22 mg/dL) and Alo+Pio (–36.33±11.15 mg/dL) groups showed a greater reduction than the Alo group (–4.19±10.73 mg/dL, P=0.0520). HDL-C levels were more increased in the Alo+Pio group (6.34±1.12 mg/dL) than in the Alo group (–2.06±1.08, P=0.0001) and were similar to those in the Pio group (6.23±1.13 mg/dL, P=0.9970). LDL-C levels tended to decrease in the Alo group, although no significant differences were detected between the groups. FFA changes were more substantial in the Pio (–176.54±30.06 μEq/L) and Alo+Pio (–147.02±29.99 μEq/L) groups compared to the Alo group (46.87±28.79 μEq/L) (P=0.0051). Apolipoprotein B levels showed a downward trend in all three groups, with the Alo+Pio group experiencing the greatest decrease, albeit without significant differences among the groups. In short, the triple therapy by the dual addition of alogliptin and pioglitazone exhibited benefits in lipid profile alterations comparable to the effects observed in dual therapy with the addition of pioglitazone alone.

Characteristics of patients who fail on alogliptin or pioglitazone combination therapy

To further elucidate who may benefit from early combination (triple) therapy, we analyzed the baseline characteristics of patients who failed to achieve the target glycemic level (HbA1c ≥6.5%) with alogliptin or pioglitazone add-on therapy (Table 3). In comparison to those who achieved the target HbA1c, patients who failed to respond to alogliptin mono add-on therapy exhibited higher HbA1c levels (7.61%±0.64% vs. 7.99%±0.68%, P=0.0222), lower HOMA-IR values (3.05±2.15 vs. 2.23±1.61, P=0.0678), and lower HOMA-β values (31.55±17.93 vs. 23.37±13.41, P=0.0678). Similarly, patients who did not achieve the target HbA1c with pioglitazone mono add-on therapy demonstrated higher HbA1c levels (7.48%±0.34% vs. 8.19%±0.79%, P=0.0055), fasting blood sugar (FBS; 138.33±15.67 mg/dL vs. 163.65±44.22 mg/dL, P=0.0366), lower fasting C-peptide levels (1.97±0.56 ng/dL vs. 1.75±0.94 ng/dL, P=0.0469), and lower HOMA-β values (37.28±12.95 vs. 24.99±15.48, P=0.0039). Additionally, patients who failed on pioglitazone monotherapy had a lower BMI (25.43±3.28 kg/m²) compared to those who achieved the target glycemic level (27.17±3.06 kg/m²), although this difference did not reach statistical significance (P=0.0595). No significant differences were found in age, sex, duration of T2DM, metformin dose, hypertension, dyslipidemia, smoking status, alcohol consumption, GA, and GA/HbA1c ratio between those who succeeded or failed on alogliptin or pioglitazone mono add-on therapy.
On the contrary, there was no difference in FBS (163.71±35.33 mg/dL vs. 166.90±38.53 mg/dL, P=0.6362), HOMA-IR (2.39±0.98 vs. 2.28±1.31, P=0.2820), or HOMA-β (24.38±15.82 vs. 21.87±14.46, P=0.3149) between those who succeeded or failed to achieve the target HbA1c with the alogliptin and pioglitazone triple combination therapy. To sum up, high FBS, low HOMA-IR level, and low HOMA-β levels are the characteristics of patients who fail on alogliptin or pioglitazone mono add-on therapy.

Safety outcomes

During the study period, the incidence of adverse events varied across the three groups: 34.67% (42 cases) in the Alo group, 23.19% (31 cases) in the Pio group, and 32.86% (33 cases) in the Alo+Pio group. However, the difference was not statistically significant, and no adverse reactions were attributed to the clinical trial treatment. Hypoglycemia incidence during the trial was low and similar across groups, as reported by one (1.33%) participant in the Alo group and one (1.43%) participant in the Alo+Pio group. Importantly, no severe hypoglycemic events were reported. Serious adverse events were reported in 7.14% (six cases) of the participants in the Alo group, 2.37% (two cases) in the Pio group, and 2.9% (two cases) in the Alo+Pio group. One patient in the Alo+Pio group experienced acute pancreatitis and acute cholecystitis due to biliary stones but was fully treated. Two cases of ureteral cancer and pruritus were potentially linked to drug usage, whereas the other cases were deemed unlikely or impossible to evaluate for drug association. Adverse events of special interest, such as cardiovascular events, were reported in 1.45% of the Pio group and 1.43% of the Alo+Pio group. Edema occurred in six participants: one (1.33%) in the Alo group, three (4.35%) in the Pio group, and two (2.86%) in the Alo+Pio group. However, these incidents did not differ significantly between the groups (Table 4). In summary, the combined use of Alo and Pio did not significantly increase the incidence of adverse events.

DISCUSSION

The PEAK trial was a multicenter, randomized, double-blind, three-arm study that evaluated the efficacy and safety of alogliptin and pioglitazone dual add-on therapy compared to alogliptin or pioglitazone mono add-on therapy in adult patients with inadequately controlled T2DM who were already receiving metformin therapy. The results of this study demonstrated that triple therapy with metformin, pioglitazone, and alogliptin could lead to better glycemic control than dual therapies (metformin+pioglitazone or metformin+alogliptin). Furthermore, triple therapy alleviated insulin resistance and enhanced β-cell function without increasing the incidence of adverse events.
Our results indicate that the early combination of pioglitazone and alogliptin after the failure of metformin therapy can provide better glycemic control than pioglitazone or alogliptin single add-on therapy. Previous studies have demonstrated the benefits of early combination therapy. In the Vildagliptin Efficacy in combination with metfoRmIn For earlY treatment of type 2 diabetes (VERIFY) study, the use of metformin plus vildagliptin from the early stage of T2DM provided more durable long-term clinical benefits than metformin monotherapy; this finding has also been validated in Asian populations [3,18,19]. The Efficacy and Durability of Initial Combination Therapy for Type 2 Diabetes (EDICT) study compared early three-drug combination therapy (metformin, pioglitazone, and exenatide) with sequential therapy (metformin followed by sulfonylurea and insulin glargine) in patients newly diagnosed with T2DM. Early three-drug combination therapy provided superior and durable glycemic control compared to sequential therapy [4]. In our study, the Alo+Pio group showed a continuous decrease in HbA1c at 24 weeks (Fig. 1B), suggesting a durable glycemic efficacy of the triple combination therapy. In line with previous studies, our study demonstrates the effectiveness and durability of glycemic control with early combination therapy in patients with T2DM.
By subgroup analysis, we delineate the specific group of T2DM patients who might potentially benefit from early alogliptin and pioglitazone combination therapy following metformin treatment (Table 3). The characteristic of patients who failed to reach target blood sugar levels (HbA1c 6.5%) in the alogliptin group and pioglitazone group was lower in β-cell function. On the other hand, compared to the pioglitazone group or the alogliptin group, we could observe a higher HbA1c target achievement rate in the triple combination group, which was regardless of their baseline β-cell function. Therefore, T2DM patients with low β-cell function might exceptionally benefit from early triple combination therapy. Given that low β-cell function is characteristic of Korean T2DM patients, our study provides practical evidence supporting the implementation of early combination therapy in this particular patient population.
Insulin resistance and subsequent β-cell dysfunction are key components of T2DM pathogenesis. Pioglitazone acts as a PPARγ agonist in adipocytes, decreasing FFA spillage into the muscles or liver, thus increasing insulin sensitivity. Alogliptin acts on β-cells to increase glucose-stimulated insulin secretion and on α-cells to decrease glucagon secretion [20]. Consistent with this previous knowledge, our data indicate that pioglitazone and alogliptin combination therapy can decrease serum-FFA levels and HOMA-IR but increase HOMA-β. While the HOMA-β value in the alogliptin and pioglitazone dual add-on therapy group was lower than that in the alogliptin monotherapy group, we speculate that this could be attributed to the improvement in hyperinsulinemia achieved through the use of pioglitazone. Furthermore, fasting glucose levels were significantly lower in the triple combination group than in the dual combination group, which may be attributed to the combined effect of increased hepatic insulin sensitivity caused by pioglitazone and decreased glucagon caused by alogliptin (Tables 2 and 5) [20,21]. Serum HDL-C levels increased in the pioglitazone alone and the alogliptin/pioglitazone combination groups (Table 5). This result is consistent with previous reports [16,22] and is thought to be mediated by the increased expression of apolipoprotein A1 by thiazolidinedione [23].
Patients with T2DM in East Asia are characterized by high visceral fat mass and lower β-cell volume. These characteristics make East Asian patients with T2DM more susceptible to insulin resistance and β-cell failure [24,25]. Given this pathophysiological background, East Asian patients with T2DM may benefit from early combination therapy with thiazolidinedione and DPP-4 inhibitors. To note, the baseline BMI of the participants in our study was 25.4±3.3 kg/m2, yet they still exhibited insulin resistance (HOMA-IR in Table 2) despite relatively high doses of metformin usage (1,434.8±353.1 mg). We speculate that the participants in our study represented the typical characteristics of patients with T2DM in East Asia, providing further practical evidence for the prescription of OHAs. The efficacy of the pioglitazone and alogliptin combination therapy was previously studied by another group [14]. This double-blind, randomized controlled trial evaluated the glycemic profiles between alogliptin and alogliptin/pioglitazone combination add-on groups after failure of metformin monotherapy in patients with T2DM. However, only a small proportion (7.86%) of Asian populations was included in the study. Additionally, a study conducted in Korea compared the non-inferiority of pioglitazone add-on therapy with glimepiride after a combination of metformin and alogliptin dual therapy [26]. Our study differs from this in that we compared the efficacy and safety of alogliptin and pioglitazone combination therapy with those of alogliptin or pioglitazone mono add-on therapy in patients who did not achieve the target glycemic level with metformin. To the best of our knowledge, this study is the first to demonstrate the efficacy and safety of pioglitazone/alogliptin combination therapy after the failure of metformin treatment in patients with T2DM in East Asia.
Alogliptin and pioglitazone combination treatment was well tolerated by most participants and very few experienced serious adverse events. We observed slight weight gain in the pioglitazone and pioglitazone/alogliptin treatment groups. Wellknown thiazolidinedione-related side effects, such as heart failure and fractures, were not observed during the study period. However, long-term data should be followed to strengthen the findings of our study.
In Korea, DPP-4 inhibitors remain the most commonly prescribed second-line OHAs after metformin treatment, whereas the prescription rate of thiazolidinediones remains relatively low [2]. Our data provide practical evidence to encourage early combination therapy with thiazolidinediones and DPP-4 inhibitors following metformin treatment. Thiazolidinediones have beneficial effects, particularly with respect to cerebrovascular complications [27-30]. Pioglitazone has been shown to reduce all-cause mortality, nonfatal myocardial infarction, and stroke in T2DM patients with a previous history of macrovascular complications [27]. Pioglitazone has also been shown to reduce cerebrovascular events in non-diabetic but insulin-resistant populations with a history of stroke [30]. Given the high burden of cerebrovascular complications in Asian patients with T2DM [31,32], early combination therapy with thiazolidinedione and DPP-4 inhibitors may provide additional benefits that were not covered in this study.
The present study had several limitations. First, the study was followed up for a relatively short period (24 weeks) with a small number of participants. We planned a long-term extension study but failed because of the low participation rate. Second, since this study used only specific regimens, the results for other types of DPP-4 inhibitors and thiazolidinediones are unknown. A large-scale retrospective analysis of early combination therapy with thiazolidinediones and DPP-4 inhibitors would strengthen the significance of this study. Third, there are limitations to cost-effectiveness because of the increase in the number of drugs administered during early combined therapy.
In conclusion, this study demonstrated the efficacy and safety of dual add-on of alogliptin+pioglitazone compared with alogliptin and pioglitazone added on alone in patients with T2DM poorly controlled with metformin. We speculate that this study provides practical evidence for physicians to prescribe OHAs to Korean patients, who may benefit from a pathophysiological standpoint. Future large-scale, long-term data will further strengthen the value of this study.

SUPPLEMENTARY MATERIALS

Supplementary materials related to this article can be found online at https://doi.org/10.4093/dmj.2023.0259.
Supplementary Fig. 1.
Study scheme. Patients with type 2 diabetes mellitus who fail to achieve target glycosylated hemoglobin on metformin monotherapy were radomized to alogliptin (Alo) mono add-on, pioglitazone (Pio) mono add-on, or Alo+Pio double add-on.
dmj-2023-0259-Supplementary-Fig-1.pdf
Supplementary Fig. 2.
Patients enrollment. T2DM, type 2 diabetes mellitus; MFOM, metformin; Alo, alogliptin; Pio, pioglitazone.
dmj-2023-0259-Supplementary-Fig-2.pdf

Notes

CONFLICTS OF INTEREST

The study received financial support from Takeda Pharmaceuticals Korea Co., Ltd. in the form of an investigator-initiated study grant. The funder had no involvement in the study’s design, data collection, statistical analysis, data interpretation, decision to publish, or the preparation of the manuscript. It should be noted that one of the co-authors, Yoon-Hee Choi, holds the position of CEO at Medical Excellence, a CRO (Contract Research Organization) company that received funding from Takeda Pharmaceuticals Korea. Yoon-Hee Choi participated in statistical analysis of the data produced by this study.

Kyung Mook Choi has been editor-in-chief of the Diabetes & Metabolism Journal from 2022 to 2023. He was not involved in the review process of this article. Otherwise, there was no conflict of interest.

AUTHOR CONTRIBUTIONS

Conception or design: Y.H.C., K.H.Y.

Acquisition, analysis, or interpretation of data: J.Y.P., J.L., Y. H.C., K.A.H.

Drafting the work or revising: all authors.

Final approval of the manuscript: all authors.

FUNDING

None

ACKNOWLEDGMENTS

None

REFERENCES

1. Saeedi P, Petersohn I, Salpea P, Malanda B, Karuranga S, Unwin N, et al. Global and regional diabetes prevalence estimates for 2019 and projections for 2030 and 2045: results from the International Diabetes Federation Diabetes Atlas, 9th edition. Diabetes Res Clin Pract. 2019; 157:107843.
crossref
2. Bae JH, Han KD, Ko SH, Yang YS, Choi JH, Choi KM, et al. Diabetes fact sheet in Korea 2021. Diabetes Metab J. 2022; 46:417–26.
crossref
3. Matthews DR, Paldanius PM, Proot P, Chiang Y, Stumvoll M, Del Prato S, et al. Glycaemic durability of an early combination therapy with vildagliptin and metformin versus sequential metformin monotherapy in newly diagnosed type 2 diabetes (VERIFY): a 5-year, multicentre, randomised, double-blind trial. Lancet. 2019; 394:1519–29.
crossref
4. Abdul-Ghani MA, Puckett C, Triplitt C, Maggs D, Adams J, Cersosimo E, et al. Initial combination therapy with metformin, pioglitazone and exenatide is more effective than sequential add-on therapy in subjects with new-onset diabetes: results from the Efficacy and Durability of Initial Combination Therapy for Type 2 Diabetes (EDICT): a randomized trial. Diabetes Obes Metab. 2015; 17:268–75.
5. Yoo SJ, Chang SA, Sohn TS, Kwon HS, Lee JM, Moon S, et al. Long-term glycaemic durability of early combination therapy strategy versus metformin monotherapy in Korean patients with newly diagnosed type 2 diabetes mellitus. Diabetes Metab J. 2021; 45:954–9.
crossref
6. Hur KY, Moon MK, Park JS, Kim SK, Lee SH, Yun JS, et al. 2021 Clinical practice guidelines for diabetes mellitus of the Korean Diabetes Association. Diabetes Metab J. 2021; 45:461–81.
crossref
7. Cariou B, Charbonnel B, Staels B. Thiazolidinediones and PPARγ agonists: time for a reassessment. Trends Endocrinol Metab. 2012; 23:205–15.
crossref
8. Deacon CF. Dipeptidyl peptidase 4 inhibitors in the treatment of type 2 diabetes mellitus. Nat Rev Endocrinol. 2020; 16:642–53.
crossref
9. Dormandy J, Bhattacharya M, van Troostenburg de Bruyn AR; PROactive investigators. Safety and tolerability of pioglitazone in high-risk patients with type 2 diabetes: an overview of data from PROactive. Drug Saf. 2009; 32:187–202.
crossref
10. Cusi K, Orsak B, Bril F, Lomonaco R, Hecht J, Ortiz-Lopez C, et al. Long-term pioglitazone treatment for patients with nonalcoholic steatohepatitis and prediabetes or type 2 diabetes mellitus: a randomized trial. Ann Intern Med. 2016; 165:305–15.
crossref
11. Covington P, Christopher R, Davenport M, Fleck P, Mekki QA, Wann ER, et al. Pharmacokinetic, pharmacodynamic, and tolerability profiles of the dipeptidyl peptidase-4 inhibitor alogliptin: a randomized, double-blind, placebo-controlled, multiple-dose study in adult patients with type 2 diabetes. Clin Ther. 2008; 30:499–512.
crossref
12. Feng J, Zhang Z, Wallace MB, Stafford JA, Kaldor SW, Kassel DB, et al. Discovery of alogliptin: a potent, selective, bioavailable, and efficacious inhibitor of dipeptidyl peptidase IV. J Med Chem. 2007; 50:2297–300.
crossref
13. Ueki K, Tanizawa Y, Nakamura J, Yamada Y, Inagaki N, Watada H, et al. Long-term safety and efficacy of alogliptin, a DPP-4 inhibitor, in patients with type 2 diabetes: a 3-year prospective, controlled, observational study (J-BRAND Registry). BMJ Open Diabetes Res Care. 2021; 9:e001787.
crossref
14. DeFronzo RA, Burant CF, Fleck P, Wilson C, Mekki Q, Pratley RE. Efficacy and tolerability of the DPP-4 inhibitor alogliptin combined with pioglitazone, in metformin-treated patients with type 2 diabetes. J Clin Endocrinol Metab. 2012; 97:1615–22.
crossref
15. Monami M, Lamanna C, Desideri CM, Mannucci E. DPP-4 inhibitors and lipids: systematic review and meta-analysis. Adv Ther. 2012; 29:14–25.
crossref
16. Betteridge DJ. Effects of pioglitazone on lipid and lipoprotein metabolism. Diabetes Obes Metab. 2007; 9:640–7.
crossref
17. Nagashima K, Lopez C, Donovan D, Ngai C, Fontanez N, Bensadoun A, et al. Effects of the PPARgamma agonist pioglitazone on lipoprotein metabolism in patients with type 2 diabetes mellitus. J Clin Invest. 2005; 115:1323–32.
18. Chan JC, Paldanius PM, Mathieu C, Stumvoll M, Matthews DR, Del Prato S. Early combination therapy delayed treatment escalation in newly diagnosed young-onset type 2 diabetes: a subanalysis of the VERIFY study. Diabetes Obes Metab. 2021; 23:245–51.
19. Ji L, Chan JC, Yu M, Yoon KH, Kim SG, Choi SH, et al. Early combination versus initial metformin monotherapy in the management of newly diagnosed type 2 diabetes: an East Asian perspective. Diabetes Obes Metab. 2021; 23:3–17.
20. Ahren B, Foley JE. Improved glucose regulation in type 2 diabetic patients with DPP-4 inhibitors: focus on alpha and beta cell function and lipid metabolism. Diabetologia. 2016; 59:907–17.
crossref
21. Gastaldelli A, Casolaro A, Pettiti M, Nannipieri M, Ciociaro D, Frascerra S, et al. Effect of pioglitazone on the metabolic and hormonal response to a mixed meal in type II diabetes. Clin Pharmacol Ther. 2007; 81:205–12.
crossref
22. Goldberg RB, Kendall DM, Deeg MA, Buse JB, Zagar AJ, Pinaire JA, et al. A comparison of lipid and glycemic effects of pioglitazone and rosiglitazone in patients with type 2 diabetes and dyslipidemia. Diabetes Care. 2005; 28:1547–54.
crossref
23. Zhang LH, Kamanna VS, Ganji SH, Xiong XM, Kashyap ML. Pioglitazone increases apolipoprotein A-I production by directly enhancing PPRE-dependent transcription in HepG2 cells. J Lipid Res. 2010; 51:2211–22.
crossref
24. Chan JC, Malik V, Jia W, Kadowaki T, Yajnik CS, Yoon KH, et al. Diabetes in Asia: epidemiology, risk factors, and pathophysiology. JAMA. 2009; 301:2129–40.
25. Yoon KH, Lee JH, Kim JW, Cho JH, Choi YH, Ko SH, et al. Epidemic obesity and type 2 diabetes in Asia. Lancet. 2006; 368:1681–8.
crossref
26. Kim JM, Kim SS, Kim JH, Kim MK, Kim TN, Lee SH, et al. Efficacy and safety of pioglitazone versus glimepiride after metformin and alogliptin combination therapy: a randomized, open-label, multicenter, parallel-controlled study. Diabetes Metab J. 2020; 44:67–77.
crossref
27. Dormandy JA, Charbonnel B, Eckland DJ, Erdmann E, MassiBenedetti M, Moules IK, et al. Secondary prevention of macrovascular events in patients with type 2 diabetes in the PROactive Study (PROspective pioglitAzone Clinical Trial In macroVascular Events): a randomized controlled trial. Lancet. 2005; 366:1279–89.
28. Yaghi S, Furie KL, Viscoli CM, Kamel H, Gorman M, Dearborn J, et al. Pioglitazone prevents stroke in patients with a recent transient ischemic attack or ischemic stroke: a planned secondary analysis of the IRIS trial (Insulin Resistance Intervention After Stroke). Circulation. 2018; 137:455–63.
crossref
29. Young LH, Viscoli CM, Curtis JP, Inzucchi SE, Schwartz GG, Lovejoy AM, et al. Cardiac outcomes after ischemic stroke or transient ischemic attack: effects of pioglitazone in patients with insulin resistance without diabetes mellitus. Circulation. 2017; 135:1882–93.
crossref
30. Kernan WN, Viscoli CM, Furie KL, Young LH, Inzucchi SE, Gorman M, et al. Pioglitazone after ischemic stroke or transient ischemic attack. N Engl J Med. 2016; 374:1321–31.
crossref
31. Tu WJ, Zhao Z, Yin P, Cao L, Zeng J, Chen H, et al. Estimated burden of stroke in China in 2020. JAMA Netw Open. 2023; 6:e231455.
crossref
32. Venketasubramanian N, Yoon BW, Pandian J, Navarro JC. Stroke epidemiology in South, East, and South-East Asia: a review. J Stroke. 2017; 19:286–94.
crossref

Fig. 1.
Comparison of glycosylated hemoglobin (HbA1c) Changes between alogliptin (Alo) and pioglitazone (Pio) combination therapy and mono add-on therapy. (A, B) Changes in HbA1c during the study period. HbA1c of each group was compared by analysis of covariance (ANCOVA) test. The proportion of participants who reached (C) HbA1c <7.0% and (D) HbA1c <6.5% in each group was compared by chi-square test. aP<0.0001.
dmj-2023-0259f1.tif
dmj-2023-0259f2.tif
Table 1.
Baseline characteristics of the participants
Variable Group
P value
Total (n=214) Alo (n=75) Pio (n=69) Alo+Pio (n=70)
Age, yr 58.9±9.2 58.9±8.7 58.12±9.9 59.7±9.0 0.6822a
Age <65 year 144 (67.29) 55 (73.33) 45 (65.22) 44 (62.86) 0.3671
Male sex 122 (57.01) 44 (58.67) 41 (59.42) 37 (52.86) 0.6907
Weight, kg 67.4±11.2 67.8±11.7 69.3±11.3 65.2±10.2 0.1555a
BMI, kg/m2 25.4±3.3 25.5±3.3 25.7±3.3 25.1±3.4 0.4418a
Duration of T2DM, yr 9.1±5.7 9.6 ± 5.6 8.1± 5.6 9.7± 5.8 0.1295a
Metformin dose, mg/day 1,434.8±353.1 1,416.0±361.3 1,476.1±339.4 1,414.3±358.9 0.5226a
Hypertension 128 (59.81) 48 (64.00) 40 (57.97) 40 (57.14) 0.6531
Dyslipidemia 169 (78.97) 61 (81.33) 51 (73.91) 57 (81.43) 0.4562
Current smoker 34 (15.89) 10 (13.33) 14 (20.29) 10 (14.29) 0.7615
Alcohol 96 (44.86) 34 (45.33) 26 (37.68) 36 (51.43) 0.2638
HbA1c, % 8.0±0.4 7.9±0.7 8.1±0.8 8.1±0.8 0.3238a
FBS, mg/dL 160.1±38.4 155.8±36.3 159.3±41.8 165.5±36.9 0.0069a
Fasting C-peptide, ng/dL 1.72±0.75 1.73±0.74 1.79±0.89 1.64±0.61 0.7908a
Glycoalbumin, % 20.3±3.7 19.8±3.5 20.1±3.9 20.9±3.8 0.2220b
GA/HbA1c ratio 2.5±0.4 2.5±0.3 2.5±0.4 2.6±0.4 0.3105b
Total cholesterol, mg/dL 163.6±37.4 163.5±33.3 157.7±34.4 169.4±43.6 0.3751a
Triglyceride, mg/dL 170.4±262.5 163.9±151.9 137.4±68.7 210.0±425.0 0.2791a
HDL-C, mg/dL 51.6±11.7 50.3±11.0 52.9±13.5 51.8±10.6 0.4817a
LDL-C, mg/dL 94.5±30.6 96.3±32.1 91.0±29.8 96.0±30.1 0.4464a

Values are presented as mean±standard deviation or number (%).

Alo, alogliptin; Pio, pioglitazone; BMI, body mass index; T2DM, type 2 diabetes mellitus; HbA1c, glycosylated hemoglobin; FBS, fasting blood sugar; GA, glycoalbumin; HDL-C, high-density lipoprotein cholesterol; LDL-C, low-density lipoprotein cholesterol.

a Kruskal-Wallis test for nonparametric statistical analysis,

b Analysis of variance (ANOVA) test for parametric analysis.

Table 2.
Comparison of metabolic parameters between alogliptin/pioglitazone combination therapy and alogliptin or pioglitazone mono add-on therapy
Measurement Group
P value
Alo (n=75) Pio (n=69) Alo+Pio (n=70)
Body weight, kg
 Baseline 68.1±11.6 69.5±11.5 65.2±10.1
 12-week 68.0±11.8 70.4±11.6 66.4±10.1
  Change from baseline –0.09±1.78 0.87±1.73 1.19±1.93 <0.0001
 24-week 67.9±11.6 70.9±11.6 66.9±10.3
  Change from baseline –0.16±1.99 1.33±2.13 1.65±2.49 <0.0001
BMI, kg/m2
 Baseline 25.7±3.3 25.8±3.3 25.1±3.3
 12-week 25.6±3.4 26.2±3.4 25.5±3.4
  Change from baseline –0.03±0.65 0.33±0.66 0.46±0.75 <0.0001
 24-week 25.6±3.3 26.3±3.4 25.7±3.4
  Change from baseline –0.05±0.74 0.50±0.78 0.63±0.93 <0.0001
FBS, mg/dL
 Baseline 155.8±36.3 159.3±41.8 165.5±36.9 0.0693a
 12-week 134.7±24.3 136.4±32.8 123.4±24.1 0.0041a
  Change from baseline –24.0±2.85 –23.41±2.98 –38.27±2.96 0.0004a
 24-week 133.3±27.3 134.4±33.9 122.6±24.5 0.0075a
  Change from baseline –25.57±3.10 –25.43±3.22 –39.00±3.21 0.0031a
Fasting insulin, μU/mL
 Baseline 5.91±3.24 6.67±4.63 5.68±2.43 0.5672a
 12-week 5.91±3.24 6.72±4.65 5.68±2.43 0.5225a
  Change from baseline –0.00±0.03 0.05±0.03 –0.00±0.03 0.3560a
 24-week 6.05±3.09 4.72±2.20 4.56±2.25 0.0063a
  Change from baseline 0.02±0.27 –1.54±0.28 –1.40±0.28 <0.0001a
HOMA-β
 Baseline 24.79±14.50 27.13±15.70 22.98±15.02 0.1784a
 24-week 33.84±20.50 27.49±17.17 29.57±15.27 0.2415a
  Change from baseline 9.00±1.66 1.00±1.74 6.01±1.72 0.0042a
HOMA-IR
 Baseline 2.37±1.73 2.77±2.86 2.32±1.17 0.4203a
 24-week 2.05±1.28 1.56±0.78 1.45±0.91 0.0016a
  Change from baseline –0.41±0.11 –0.97±0.12 –1.00±0.12 0.0003a
Glycoalbumin, %
 Baseline 19.8±3.5 20.1±3.9 20.9±3.8 0.2220b
 12-week 16.6±2.7 18.4±4.3 16.5±3.2 0.0017a
  Change from baseline –3.34±0.32 –1.74±0.33 –4.07±0.33 <0.0001a
 24-week 17.0±3.1 18.2±3.7 16.8±3.3 0.0529a
  Change from baseline –3.01±0.31 –2.02±0.32 –3.82±0.32 0.0005a
GA/HbA1c ratio
 Baseline 2.5±0.3 2.5±0.4 2.6±0.4 0.3105b
 12-week 2.4±0.3 2.5±0.4 2.4±0.3 0.2201a
  Change from baseline –0.13±0.03 –0.03±0.03 –0.18±0.03 0.0016b
 24-week 2.4±0.3 2.5±0.3 2.5±0.4 0.5703b
  Change from baseline –0.06±0.03 0.02±0.03 –0.05±0.03 0.1610b

Values are presented as mean±standard deviation.

Alo, alogliptin; Pio, pioglitazone; BMI, body mass index; FBS, fasting blood sugar; HOMA-β, homeostatic model assessment for β-function; HOMA-IR, homeostatic model assessment for insulin resistance; GA, glycoalbumin; HbA1c, glycosylated hemoglobin.

a Kruskal-Wallis test,

b Analysis of variance (ANOVA) test were used for nonparametric statistical analyses.

Table 3.
Comparison of baseline characteristics of patients with treatment failure at 24 weeks
Variable Alogliptin
Pioglitazone
Alogliptin+Pioglitazone
HbA1c <6.5% HbA1c ≥6.5% P value HbA1c <6.5% HbA1c ≥6.5% P value HbA1c <6.5% HbA1c ≥6.5% P value
Number (%) 13 (17.33) 62 (82.67) 12 (17.39) 57 (82.61) 31 (44.29) 39 (55.71)
Age, yr 57.69±7.98 59.13±8.87 0.5913 58.00±10.73 58.14±9.81 0.9684a 61.16±9.12 58.62±8.85 0.2482a
Male sex 10 (76.92) 34 (54.84) 0.1415 6 (50.00) 35 (61.40) 0.5274c 15 (48.39) 22 (56.41) 0.5042b
Weight, kg 68.95±10.04 67.49±12.02 0.5519a 71.63±10.40 68.77±11.56 0.3224a 66.06±10.78 64.48±9.81 0.5246
BMI, kg/m2 26.05±3.71 25.42±3.27 0.5899a 27.17±3.06 25.43±3.28 0.0595a 25.76±3.97 24.49±2.75 0.1271a
Duration of T2DM, yr 8.23±5.72 9.89±5.64 0.3918a 6.50±5.39 8.40±5.68 0.2803a 9.26±5.25 10.03±6.23 0.6740a
Metformin dose, mg/day 1,323.08±363.21 1,435.48±360.83 0.3493a 1,350.00±365.56 1,502.63±330.91 0.1979a 1,400.00±347.37 1,425.64±371.85 0.7516a
Hypertension 9 (69.23) 39 (62.90) 0.7594c 9 (75.00) 31 (54.39) 0.1885b 20 (64.52) 20 (51.28) 0.2664b
Dyslipidemia 12 (92.31) 49 (79.03) 0.4402c 10 (83.33) 41 (71.93%) 0.7184c 25 (80.65) 32 (82.05) 0.8806b
Current smoker 1 (7.69) 9 (14.52) 0.1107c 2 (16.67) 12 (21.05) 0.0465c 5 (16.13) 5 (12.82) 0.9198b
Alcohol 46 (46.15) 28 (45.16) 0.9479b 4 (33.33) 22 (38.60) 1.0000c 14 (45.16) 22 (56.41) 0.3496b
HbA1c, % 7.61±0.64 7.99±0.68 0.0222a 7.48±0.34 8.19±0.79 0.0055a 7.84±0.65 8.30±0.77 0.0066a
Glycoalbumin, % 18.54±3.17 20.07±3.47 0.1458 17.44±3.70 20.69±3.73 0.0078 20.20±3.50 21.38±4.00 0.2008
GA/HbA1c ratio 2.43±0.26 2.51±0.34 0.4233 2.33±0.45 2.52±0.34 0.0986 2.57±0.35 2.57±0.36 0.9377
FBS, mg/dL 156.62±39.98 155.63±35.83 0.6899a 138.33±15.67 163.65±44.22 0.0366a 163.71±35.33 166.90±38.53 0.6362a
Fasting C-peptide, ng/dL 1.99±0.98 1.67±0.68 0.2906a 1.97±0.56 1.75±0.94 0.0469a 1.77±0.58 1.54±0.63 0.0328a
HOMA-IR 3.05±2.15 2.23±1.61 0.0678a 2.59±0.87 2.80±3.13 0.1612a 2.39±0.98 2.28±1.31 0.2820a
HOMA-β 31.55±17.93 23.37±13.41 0.0678a 37.28±12.95 24.99±15.48 0.0039a 24.38±15.82 21.87±14.46 0.3149a
Total cholesterol, mg/dL 150.08±31.43 166.26±33.25 0.1119 158.58±29.23 157.54±35.67 0.9251 168.87±52.98 169.82±35.06 0.4491a
Triglyceride, mg/dL 230.46±328.87 149.90±74.67 0.5900a 151.83±60.03 134.37±70.54 0.2319a 274.26±618.92 158.95±139.76 0.1347a
HDL-C, mg/dL 50.81±11.26 50.23±11.02 0.8337a 53.86±16.28 52.72±12.97 0.6576a 49.08±8.29 53.96±11.72 0.0537
LDL-C, mg/dL 77.46±31.11 100.26±31.05 0.0186 92.67±29.11 90.61±30.16 0.8300 92.48±31.27 98.82±29.19 0.3851
Free fatty acid, μEq/L 695.77±254.87 771.82±219.30 0.2726 721.00±222.05 751.30±257.40 0.7061 807.13±340.18 864.23±330.34 0.3979a

Values are presented as number (%) or mean±standard deviation. The baseline characteristics of patients with treatment failure at 24 weeks.

HbA1c, glycosylated hemoglobin; BMI, body mass index; T2DM, type 2 diabetes mellitus; GA, glycoalbumin; FBS, fasting blood sugar; HOMA-IR, homeostatic model assessment for insulin resistance; HOMA-β, homeostatic model assessment for β-function; HDL-C, high-density lipoprotein cholesterol; LDL-C, low-density lipoprotein cholesterol.

a Wilcoxon rank sum test was used for nonparametric statistical analysis,

b Chi-square test,

c Fishers exact test, and Student’s t-test for parametric analysis.

Table 4.
Serious adverse events
Measurement Group
Alo (n=75) Pio (n=69) Alo+Pio (n=70)
Subjects with SAEs 2 (2.67) [2] 2 (2.90) [2] 5 (7.14) [6]
Cardiac disorders
 Angina unstable 0 (0.00) [0] 1 (1.53) [1] 0 (0.00) [0]
Gastrointestinal disorders
 Oesophageal perforation 0 (0.00) [0] 1 (1.53) [1] 0 (0.00) [0]
 Pancreatitis acute 0 (0.00) [0] 0 (0.00) [0] 1 (1.43) [1]
Hepatobiliary disorders
 Cholecystitis acute 0 (0.00) [0] 0 (0.00) [0] 1 (1.43) [1]
Infections and infestations
 Bronchiolitis 0 (0.00) [0] 1 (1.53) [1] 0 (0.00) [0]
Injury, poisoning and procedural complications
 Meniscus injury 1 (1.33) [1] 0 (0.00) [0] 0 (0.00) [0]
Musculoskeletal and connective tissue disorders
 Osteoarthritis 0 (0.00) [0] 0 (0.00) [0] 1 (1.43) [1]
Neoplasms benign, malignant and unspecified
 Ureteric cancer 0 (0.00) [0] 0 (0.00) [0] 1 (1.43) [1]
Reproductive system and breast disorders
 Breast calcifications 0 (0.00) [0] 0 (0.00) [0] 1 (1.43) [1]
Skin and subcutaneous tissue disorders
 Pruritus 0 (0.00) [0] 0 (0.00) [0] 1 (1.43) [1]
Hypoglycemia 1 (1.33) 0 (0.00) 1 (1.43)

Values are presented as number (%) [no. of events].

Alo, alogliptin; Pio, pioglitazone; SAE, serious adverse event.

Table 5.
Comparison of lipid profiles between alogliptin/pioglitazone combination therapy and alogliptin or pioglitazone mono add-on therapy
Measurement Group
P value
Alo (n=75) Pio (n=69) Alo+Pio (n=70)
TC, mg/dL
 Baseline 163.5±33.3 157.7±34.4 169.4±43.6 0.3751
 12-week 157.7±33.8 159.0±33.4 162.5±36.7 0.8200
  Change from baseline –5.85±3.28 –1.43±3.44 –4.14±3.41 0.6480
 24-week 157.2±30.4 162.5±35.7 164.8±38.4 0.6579
  Change from baseline –6.27±3.25 2.13±3.41 –1.95±3.38 0.2050
TG, mg/dL
 Baseline 163.9±151.9 137.4±68.7 210.0±425.0 0.2791
 12-week 152.1±85.8 114.9±64.9 122.8±88.0 0.0011
  Change from baseline –17.75±8.91 –52.56±9.31 –51.22±9.25 0.0094
 24-week 165.0±95.1 126.9±70.1 141.8±140.4 0.0015
  Change from baseline –4.19±10.73 –37.09±11.22 –36.33±11.15 0.0520
HDL-C, mg/dL
 Baseline 50.3±11.0 52.9±13.5 51.8±10.6 0.4817
 12-week 49.0±10.1 58.7±13.9 56.0±11.5 <0.0001
  Change from baseline –1.61±0.88 6.08±0.92 4.25±0.91 <0.0001
 24-week 48.5±11.5 58.9±14.6 58.1±14.0 <0.0001
  Change from baseline –2.06±1.08 6.23±1.13 6.34±1.12 <0.0001
LDL-C, mg/dL
 Baseline 96.3±32.1 91.0±29.8 96.0±30.1 0.4464
 12-week 91.8±30.7 87.9±31.2 92.3±32.4 0.5869
  Change from baseline –4.05±2.56 –4.08±2.68 –3.30±2.65 0.9720
 24-week 90.8±28.0 90.6±33.9 92.4±31.6 0.8979
  Change from baseline –4.97±2.64 –1.44±2.76 –3.19±2.73 0.6520
Free fatty acid, μEq/L
 Baseline 758.6±225.9 746.0±250.3 838.9±333.5 0.5162
 12-week 748.9±256.9 591.9±249.0 635.9±225.6 0.0007
  Change from baseline –24.43±26.25 –177.21±27.39 –164.54±27.33 <0.0001
 24-week 726.9±250.4 593.3±258.1 652.2±280.6 0.0118
  Change from baseline –46.87±28.79 –176.54±30.06 –147.02±28.99 0.0051
Apolipoprotein B, mg/dL
 Baseline 90.2±23.8 83.6±22.3 90.0±20.4 0.0462
 12-week 84.5±22.9 75.8±22.7 78.7±22.5 0.0016
  Change from baseline –5.14±1.83 –8.93±1.92 –10.82±1.89 0.0900
 24-week 85.7±20.8 78.7±23.1 79.9±23.8 0.0482
  Change from baseline –3.82±1.92 –6.22±2.01 –9.49±1.98 0.1200

Values are presented as mean±standard deviation. The Kruskal-Wallis test was used for nonparametric statistical analyses.

TC, total cholesterol; TG, triglyceride; HDL-C, high-density lipoprotein cholesterol; LDL-C, low-density lipoprotein cholesterol.

TOOLS
Similar articles