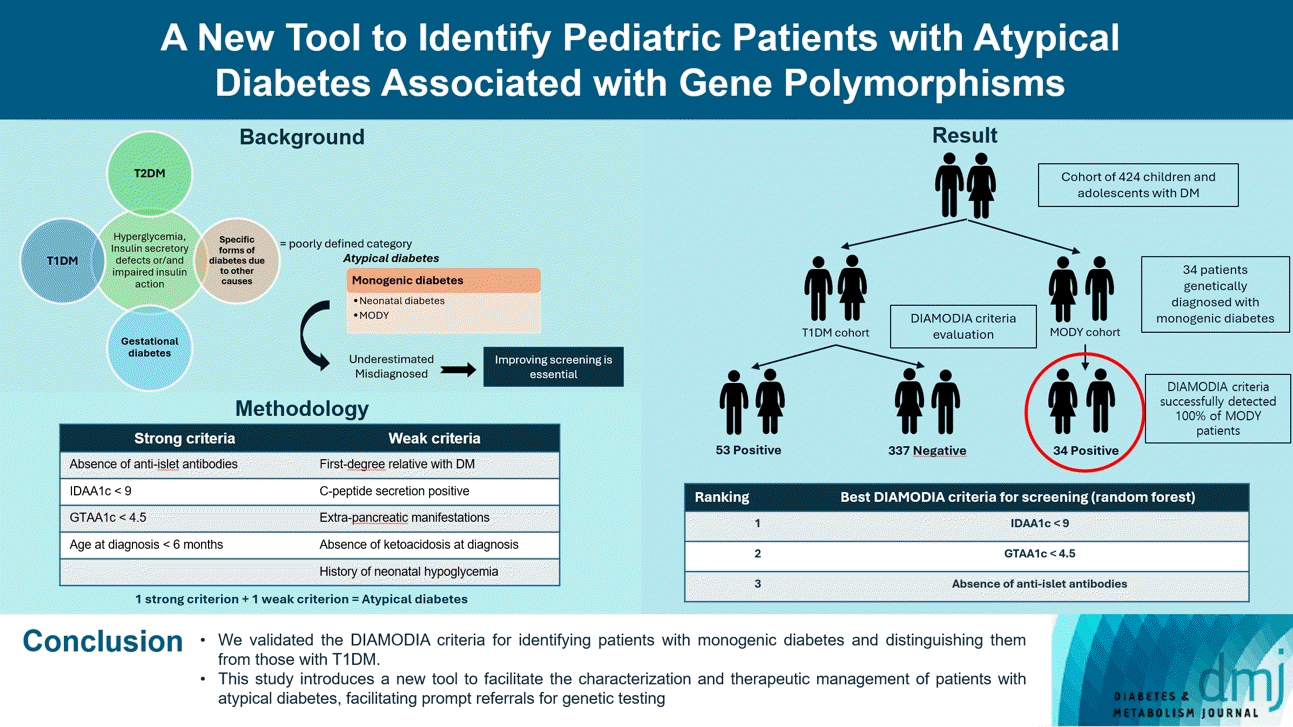
Highlights
INTRODUCTION
METHODS
Study context
Patient selection
Creation of the DIAMODIA criteria
Study design
Statistical analyses
RESULTS
Characterization of MODY patients
Table 1.
| Variable | Total (n=424)a | Baseline T1DM (n=390) | MODY (n=34) | P value |
|---|---|---|---|---|
| Patient data | ||||
| Gender (girls), % | 49 | 50 | 41 | 0.32b,g |
| Neonatal history | ||||
| Birth weight, kg | 3.33±0.6 | 3.35±0.6 | 3.15±0.6 | 0.04c,f |
| Birht height, cm | 49.92±2.9 | 49.97±2.8 | 49.47±3.9 | 0.24b,f |
| Term, % | ||||
| Pre-term | 7.3 | 7.3 | 7.7 | 0.97b,g |
| Term | 84.8 | 84.8 | 84.6 | 0.97b,g |
| Post-term | 7.9 | 7.9 | 7.7 | 0.97b,g |
| Neonatal hypoglycemia, % | 5.1 | 3.1 | 25.9 | <0.001e |
| Gestationnal diabetes, % | 3.9 | 3.0 | 14.3 | 0.003d |
| Diabetes diagnosis | ||||
| Age, yr | 8.09±3.9 | 8.19±3.8 | 6.98±4.9 | 0.08b,f |
| Height-SDS | 0.02±1.2 | 0.05±1.1 | –0.31±1.3 | 0.07b,f |
| Weight-SDS | –0.43±1.3 | –0.46±1.3 | –0.07±1.2 | 0.04c,f |
| BMI-SDS | –0.72±1.6 | –0.78±1.6 | 0.07±1.6 | 0.002d,f |
| Glycemia, mg/dL | 446.36±224.9 | 465.84±215.8 | 203.38±194.7 | <0.001e,f |
| HbA1c, % | 11.05±2.5 | 11.36±2.2 | 7.14±2.2 | <0.001e,f |
| Diabetic ketoacidosis, % | 34.5 | 36.3 | 12.1 | 0.005d,g |
| Autoimmune disease (yes), % | 12.4 | 13.2 | 2.9 | <0.001e,g |
| Glycemic parameters | ||||
| HbA1c, % | 7.25±1.1 | 7.34±1.1 | 6.18±0.9 | <0.001e,f |
| TIR70-180, % | 46.66±14.8 | 44.64±12.1 | 76.70±17.3 | <0.001e,f |
| IDAA1c score | 10.78±1.8 | 11.06±1.5 | 7.09±1.9 | <0.001e,f |
| GTAA1c score | 5.89±1.3 | 6.04±1.1 | 3.79±1.3 | <0.001e,f |
| Chronic treatment | ||||
| Insulin treatment, % | 93.9 | 99.5 | 26.6 | NA |
| Antidiabetic drugs, % | ||||
| Biguanide | 4.0 | 3.6 | 8.8 | NA |
| Sulfonylureas | 0.4 | 0 | 5.8 | NA |
| Glinides | 0.2 | 0 | 2.9 | NA |
Values are presented as mean±standard deviation. Percentages may not total 100 due to rounding. Differences between T1DM cohort and MODY cohort were considered as significant when P value was under 0.05.
T1DM, type 1 diabetes mellitus; MODY, maturity-onset diabetes of the young; SDS, standard deviation score; BMI, body mass index; HbA1c, glycosylated hemoglobin; TIR70-180, time in range (70 to 180 mg/dL); IDAA1c, insulin-dose adjusted A1c; GTAA1c, glycemic target-adjusted A1c; NA, not applicable.
Evaluation of DIAMODIA criteria in the MODY cohort
Table 2.
| Variable | Tdia (n=337) | Adia (n=53) | MODY (n=34) |
P value |
|
|---|---|---|---|---|---|
| Tdia vs. Adia | Tdia vs. MODY | ||||
| Patient data | |||||
| Gender (girls), % | 51.6 | 42.7 | 41.2 | 0.26a,f | 0.84a,f |
| Neonatal history | |||||
| Birth weight, kg | 3.35±0.6 | 3.37±0.5 | 3.15±0.6 | 0.81a,e | 0.06a,e |
| Birht height, cm | 49.81±2.8 | 50.68±2.8 | 49.47±3.9 | 0.04b,e | 0.62a,e |
| Term, % | |||||
| Pre-term | 8.3 | 1.9 | 7.7 | 0.10a,f | 0.92a,f |
| Term | 83.7 | 90.7 | 84.6 | 0.20a,f | 0.81a,f |
| Post-term | 8.0 | 7.4 | 7.7 | 0.91a,f | 0.87a,f |
| Neonatal hypoglycemia, % | 2.9 | 3.9 | 25.9 | 0.75a,f | <0.001d,f |
| Gestationnal diabetes, % | 2.9 | 3.6 | 14.3 | 0.75a,f | <0.001d,f |
| Diabetes diagnosis | |||||
| Age, yr | 8.18±3.8 | 8.24±3.8 | 6.98±4.9 | 0.91a,e | 0.16a,e |
| Height-SDS | 0.03±1.1 | 0.12±1.4 | –0.31±1.3 | 0.64a,e | 0.14a,e |
| Weight-SDS | –0.49±1.2 | –0.30±1.3 | –0.07±1.2 | 0.32a,e | 0.06a,e |
| BMI-SDS | –0.82±1.6 | –0.61±1.8 | 0.07±1.6 | 0.51a,e | 0.002b,e |
| Glycemia, mg/dL | 478.95±215.2 | 405.28±209.9 | 203.38±194.7 | 0.02b,e | <0.001d,e |
| HbA1c, % | 11.47±2.2 | 10.88±2.4 | 7.14±2.2 | 0.09a,e | <0.001d,e |
| Diabetic ketoacidosis, % | 38.1 | 28.4 | 12.1 | 0.17a,f | 0.002c,f |
| Autoimmune disease (yes), % | 14.6 | 6.8 | 2.9 | 0.17a,f | 0.04b,f |
| Glycemic parameters | |||||
| HbA1c, % | 7.49±1.1 | 6.59±0.7 | 6.18±0.9 | <0.001d,e | <0.001d,e |
| TIR70-180, % | 43.12±10.9 | 51.62±15.2 | 76.70±17.3 | 0.003d,e | <0.001d,e |
| IDAA1c score | 11.34±1.4 | 9.71±1.4 | 7.09±1.9 | <0.001d,e | <0.001d,e |
| GTAA1c score | 6.25±1.0 | 4.97±0.8 | 3.79±1.3 | <0.001d,e | <0.001d,e |
| Chronic treatment | |||||
| Insulin treatment, % | 100 | 96 | 26.5 | NA | NA |
| Antidiabetic drugs, % | |||||
| Biguanide | 3.3 | 6.7 | 8.8 | NA | NA |
| Sulfonylureas | 0 | 0 | 5.8 | NA | NA |
| Glinides | 0 | 0 | 2.9 | NA | NA |
Values are presented as mean±standard deviation. Percentages may not total 100 due to rounding. Differences between the three cohorts were considered as significant when P value was under 0.05.
Tdia, cohort of type 1 diabetes mellitus patients; Adia, cohort of patients with atypical diabetes; MODY, maturity-onset diabetes of the young; SDS, standard deviation score; BMI, body mass index; HbA1c, glycosylated hemoglobin; TIR70-180, time in range (70 to 180 mg/dL); IDAA1c, insulin-dose adjusted A1c; GTAA1c, glycemic target-adjusted A1c; NA, not applicable.
The level of significance is represented as follows:
Table 3.
| DIAMODIA criteria | Tdia (n=337) | Adia (n=53) | MODY (n=34) |
P value |
|
|---|---|---|---|---|---|
| Tdia vs. Adia | Tdia vs. MODY | ||||
| Strong criteria | |||||
| Absence of anti-islet antibodies, % | 0.6 | 59.4 | 100 | <0.001d | <0.001d |
| IDAA1c <9, % | 0.6 | 23.5 | 80.0 | <0.001d | <0.001d |
| GTAA1c <4.5, % | 0.9 | 28.6 | 81.5 | <0.001d | <0.001d |
| Age at diagnosis <6 months, % | 0 | 0 | 8.8 | NA | <0.001d |
| Weak criteria | |||||
| First-degree relative with diabetes, % | 41.0 | 56.8 | 85.3 | 0.02b | <0.001d |
| C-peptide secretion positive, % | 23.9 | 59.4 | 90.6 | <0.001d | <0.001d |
| Extra-pancreatic manifestations, % | 8.5 | 13.3 | 38.7 | 0.27a | 0.002c |
| Absence of ketoacidosis at diagnosis, % | 61.8 | 71.6 | 87.9 | 0.14a | 0.001d |
| History of neonatal hypoglycemia, % | 2.9 | 3.9 | 25.9 | 0.69a | <0.001d |
Percentages may not total 100 due to rounding. Differences between the three groups were considered as significant when P value was under 0.05. All P values have been calculated using the chi-square test (or their respective non-parametric tests).
DIAMODIA, DIAgnose MOnogenic DIAbetes; Tdia, cohort of type 1 diabetes mellitus patients; Adia, cohort of patients with atypical diabetes; MODY, maturity-onset diabetes of the young; IDAA1c, insulin-dose adjusted A1c; GTAA1c, glycemic target-adjusted A1c; NA, not applicable.
The level of significance is represented as follows:
Characterization of baseline T1DM cohort
Evaluation of DIAMODIA criteria in the baseline T1DM cohort
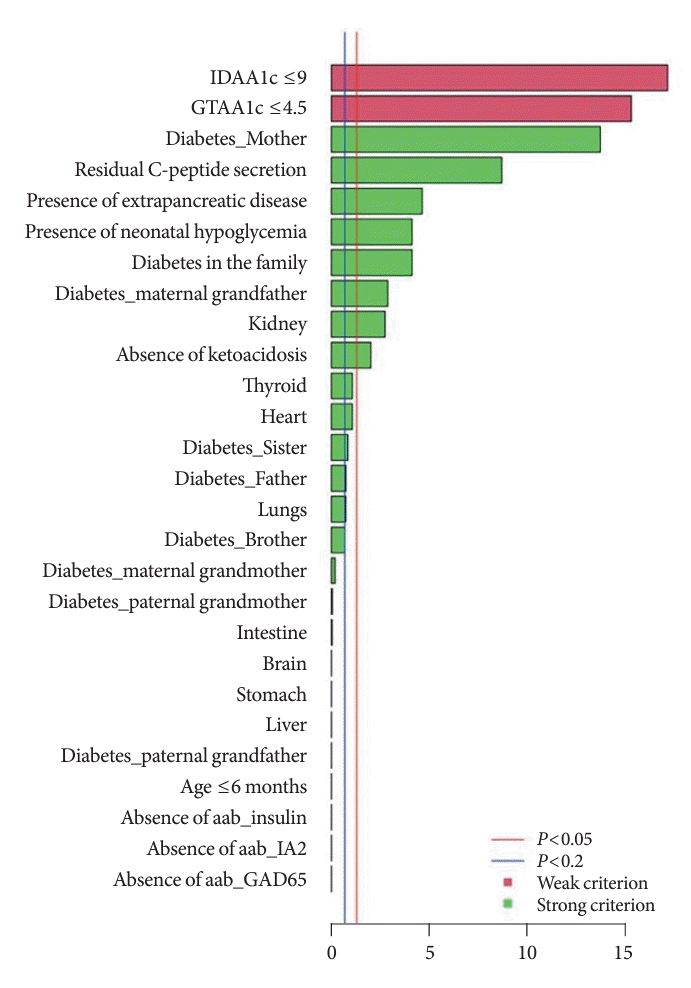
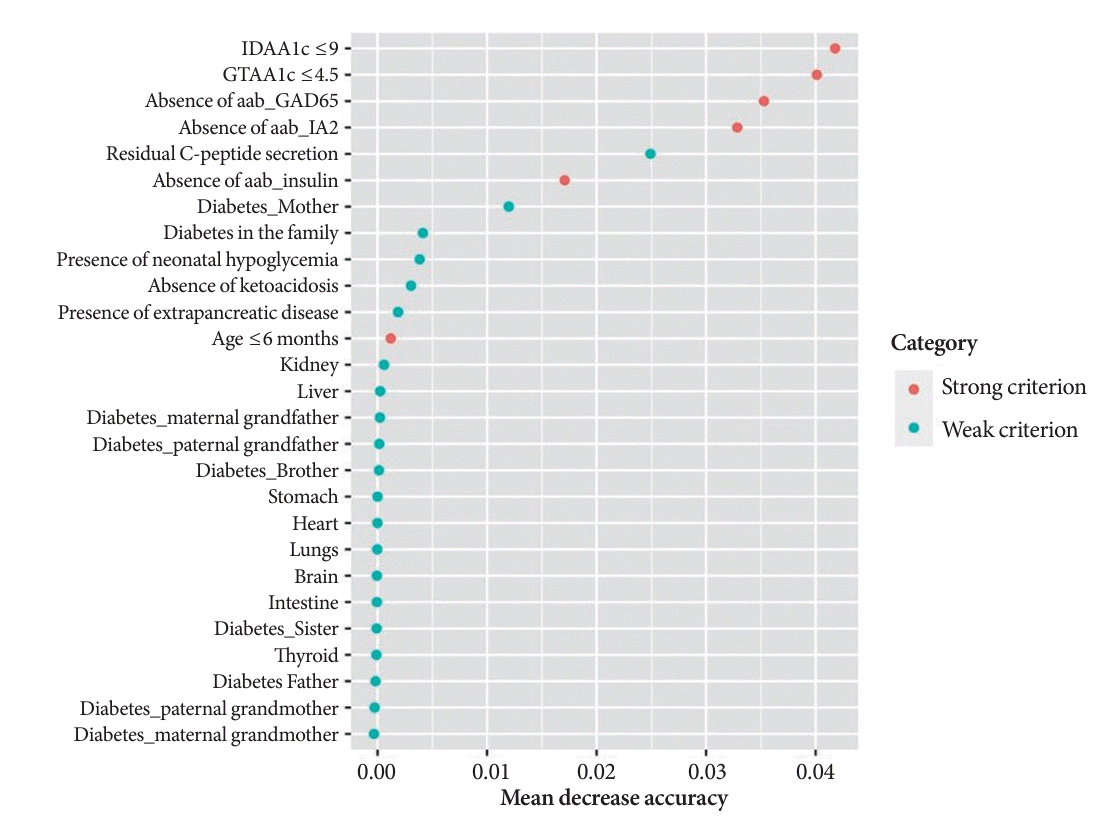
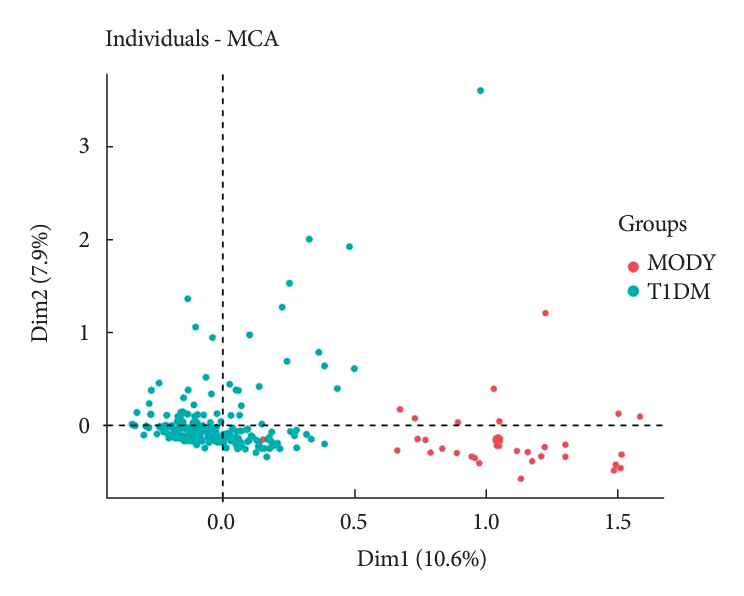
Evaluation of DIAMODIA variables
Fig. 2.

Fig. 3.


 PDF
PDF Citation
 Print
Print


 XML Download