

 PDF
PDF Citation
 Print
Print


INTRODUCTION
As one of the most important causes of liver disease, the burden of non-alcoholic fatty liver disease (NAFLD) has increased significantly in the past few decades, affecting approximately 25% of the population worldwide [1]. The former definition of NAFLD, with or without a history of heavy drinking, was applied as the criterion for distinguishing NAFLD from alcoholic fatty liver disease [1]. As emerging evidence suggests that metabolic abnormalities play an important role in the occurrence and prognosis of NAFLD, a panel of international experts proposed a new definition in 2020: metabolic dysfunction-associated fatty liver disease (MAFLD) [2]. Compared with NAFLD, MAFLD clearly distinguishes metabolic-related fatty liver from other types of fatty liver. As the prevalence rates of MAFLD and NAFLD have been explored in multiple ethnic populations [3-6], the discrepancies in the incidence densities of these two conditions and their comorbidity remain unclear. Since 2020, studies have also shown that MAFLD is associated with health conditions, such as all-cause mortality [3], cardiovascular disease (CVD) [4], and cancer [7]. However, few studies have explored the modifiable risk factors for MAFLD.
Physical activity, dietary intake, smoking, and alcohol intake are well-established modifiable lifestyle factors associated with NAFLD [8-11]. However, to our knowledge, no study has explored how these lifestyle factors and their combinations may be associated with the risk of MAFLD. As an overall reflection of lifestyle, a combination of multiple lifestyle factors may provide a more realistic and complicated representation of daily life. Previous studies have shown that a higher overall healthy lifestyle is associated with a lower risk of metabolic diseases, such as coronary disease [12] and type 2 diabetes mellitus [13]. Furthermore, a better overall healthy lifestyle may attenuate the risk of MAFLD.
This study aimed to use a large population-based prospective cohort to explore whether adherence to an overall healthy lifestyle can reduce the risk of MAFLD. Furthermore, the prevalence and incidence densities of MAFLD, NAFLD, and their comorbidities were estimated to fill the gap regarding the epidemiological features of MAFLD in Chinese.
METHODS
Study design and population
The present cohort study was based on the Tianjin Chronic Low-grade Systemic Inflammation and Health Cohort Study (TCLSIH), which was a large prospective dynamic cohort study conducted on the general population of Tianjin, China. Detailed information on the TCLSIH has been described previously [14]. A total of 39,593 participants who provided informed consent, completed the study questionnaire, and underwent health screening between 2013 and 2019 were included in this study. We excluded participants who had CVD (n=1,866) or cancer (n=305). Therefore, 37,422 participants were included to estimate the prevalence of MAFLD, NAFLD, and their comorbidities based on the health screening results. Furthermore, participants who had MAFLD at baseline (n=11,367) or did not have full data on follow-up health screenings (n=7,092) were excluded (Fig. 1). Finally, 18,964 participants were included in the cohort analyses. The protocol of this study was approved by the Institutional Review Board of Tianjin Medical University (TMUhMEC201430), and written informed consent was obtained from participants to participate in the study. The study protocol conforms to the ethical guidelines of the 1975 Declaration of Helsinki and was registered with the UMIN Clinical Trial Registry as UMIN000027174.

Assessment of healthy lifestyle factors and other covariates
Four well-established fatty liver disease-related lifestyle factors (smoking status, alcohol consumption, physical activity, and dietary intake) [8-11] were selected to construct a healthy lifestyle score. Smoking status was categorised as current or no current smoking. Heavy alcohol consumption was defined as ≥15 g/day according to the 2022 version of the Dietary Guidelines for Chinese Residents [15]. Physical activity was assessed using the Short Form of the International Physical Activity Questionnaire [16]. Based on the recommendations of the Dietary Guidelines for Chinese Residents and American Heart Association [15,17], regular physical activity was defined as at least 150 minutes of moderate activity per week, 75 minutes of vigorous activity per week, or an equivalent combination, or engaging in moderate physical activity at least 5 days per week or vigorous activity once per week. A healthy diet was defined based on our previous study, which found that a higher vegetable dietary intake was associated with a better prognosis of NAFLD [18] (detailed information on dietary data collection and processing is presented in Supplementary Methods). A vegetable pattern score derived using factor analysis (Supplementary Table 1) higher than the median value was defined as having a healthy diet. We assigned 1 point to a healthy level and 0 points to an unhealthy level for each lifestyle factor. Adding the scores of the four lifestyle factors produced an overall score ranging from 0 to 4, with higher scores indicating healthier lifestyle. Participants were classified into four categories based on their scores (0–1, 2, 3, or 4). In the sensitivity analyses, we constructed a weighted healthy lifestyle score based on the regression coefficient of each lifestyle factor in the Cox proportional hazards regression model including all four lifestyle factors, age, sex, and body mass index (BMI). The lifestyle factors (coded as 0 or 1) were multiplied by their regression coefficients, summed, divided by the sum of the four regression coefficients, and multiplied by 100. The weighted healthy lifestyle scores were further classified into four categories according to the distribution of the unweighted healthy lifestyle scores [19]. Age, sex, occupation, educational level, household income, smoking status, drinking status, and family disease history were assessed using a questionnaire.
Assessment of NAFLD and MAFLD
Hepatic ultrasonography was performed by sonographers with a TOSHIBA SSA-660A instrument (Toshiba, Tokyo, Japan; 2 to 5 MHz curved array probe). Inter-observer variations for fatty liver disease status (yes or no) were evaluated in a subsample of 200 participants from the TCLSIH study. The Kappa coefficient was 0.90, and the total agreement was 96.4%. Incident NAFLD was diagnosed based on the detection of brightness in the liver, a diffusely echogenic change in the liver parenchyma on abdominal ultrasonography, and with no heavy drinking (>210/140 g alcohol intake per week in men and women) and excluding specific diseases such as viral hepatitis and drug hepatitis that can lead to fatty liver disease, according to the revised 2018 NAFLD definition of Chinese [20]. MAFLD was diagnosed according to international expert consensus [2]. Participants were diagnosed with MAFLD based on detection of fatty liver disease on hepatic ultrasonography and having at least one of the three following conditions. First, overweight (BMI ≥23 kg/m2). Second, have type 2 diabetes mellitus (fasting blood glucose [FBG] ≥7.0 mmol/L, glycosylated hemoglobin [HbA1c] ≥6.5%, 2-hour postprandial blood glucose ≥11.1 mmol/L, a history of type 2 diabetes mellitus, or antidiabetic medication use [21]). Third, had at least two of the following seven conditions: (1) high waist circumference (≥90/80 cm in men and women), (2) high blood pressure (≥130/85 mm Hg or drug treatment), (3) high triglycerides (≥1.70 mmol/L or drug treatment), (4) low high density lipoprotein cholesterol (<1.0/1.3 mmol/L in men and women or drug treatment), (5) prediabetes (FBG 5.6 to 6.9 mmol/L, 2-hour postprandial blood glucose 7.8 to 11.0 mmol/L, or HbA1c 5.7% to 6.4%), (6) high high-sensitivity C-reactive protein (CRP) level (>2.0 mg/L), and (7) high insulin resistance (≥2.5). Insulin resistance was not included because the plasma insulin levels were not measured in our cohort.
Statistical analysis
Baseline characteristics were presented according to the incident MAFLD status. The prevalence of NAFLD/MAFLD was calculated using health screening data when they were recruited in the TCLSIH, while the incidence of NAFLD/MAFLD was calculated using health screening data of the last follow-up. Continuous and categorical variables are presented as means (95% confidence intervals [CIs]) and percentages, respectively. The hazard ratios (HRs) and 95% CIs for MAFLD regarding the healthy lifestyle categories were calculated using Cox proportional hazards regression models. The proportional hazards assumptions were tested using Schoenfeld tests and the P value was not significant in all models (all P values >0.25). The linear trend across healthy lifestyle score categories was explored using Cox proportional hazards regression by coding categories as a continuous variable. The crude model was applied to estimate the crude HR without any adjustment; model 1 was adjusted for baseline age, sex, and BMI; model 2 was additionally adjusted for educational level, employment status, household income, energy intake per day, and family history of diseases (CVD, hypertension, and diabetes) at baseline.
Subgroup analyses were performed according to baseline age (<40 or ≥40 years, the age of 40 is commonly considered as the demarcation between youth and middle age in China), sex (men or women), or BMI (<24 or ≥24 kg/m2, according to the overweight definition by the Working Group on Obesity in China [22]). The P for interaction was calculated by involving the multiplicative term of each subgroup factor and healthy lifestyle categories in the fully adjusted model. The associations between each healthy lifestyle factor and the risk of MAFLD were studied separately using the fully adjusted Cox proportional hazards regression model.
Several sensitivity analyses were performed. First, considering each participant could have distinct metabolic profiles, we added a model 3 with further adjustments for history of diabetes, hypertension, and dyslipidemia at baseline based on the adjusted model 2. Second, considering the different magnitudes of the associations between healthy lifestyle factors and the risk of MAFLD, we constructed a weighted healthy lifestyle score, and its association with incident MAFLD was explored. Third, in the subgroup analyses, as only 153 women had 0 or 1 healthy lifestyle factor, we merged the first and the second categories into one group (0 to 2 healthy lifestyle factors) and reperformed subgroup analyses according to sex. Fourth, considering our cohort’s lack of plasma insulin levels, a lower threshold of ≥1 metabolic condition instead of ≥2 metabolic conditions was used to define MAFLD. Fifth, considering that only one-third of the participants had CRP levels, we excluded CRP levels from the definition of MAFLD. Sixth, in the TCLSIH, 3,675 participants were randomly selected for genotyping (detailed information is presented in Supplementary Methods). In the cohort analyses of this study, a subsample of 2,467 participants with genotype information was included to study the associations of joint classifications of healthy lifestyle and genetic risk with incident MAFLD. Considering that a MAFLD-related genome-wide association study is lacking, we selected three NAFLD-associated single nucleotide polymorphisms (SNPs) with values of P<5×10⁻⁸ (rs2896019, rs1260326, and rs4808199) based on a previous study of Asian population [23].
The analyses in this study were conducted using Statistical Analysis System version 9.4 for Windows (SAS Institute Inc., Cary, NC, USA). All P values were two-tailed, and a P value <0.05 was considered as statistically significant.
RESULTS
Epidemiological features of MAFLD and NAFLD
A total of 37,422 participants were included in the prevalence rates estimation for MAFLD and NAFLD. As shown in Fig. 2, the prevalence of MAFLD, NAFLD, and their comorbidities were 30.38%, 28.09%, and 26.13%, respectively. The prevalence of MAFLD (43.17%) was higher than that the prevalence of NAFLD (38.76%) in men. However, the prevalence of MAFLD (14.87%) was similar to that of NAFLD (15.66%) in women. The demographic, behavioural, clinical, and laboratory characteristics according to MAFLD/NAFLD status of the participants in the cross-sectional analyses are presented in Supplementary Table 2. The incidence densities of MAFLD, NAFLD, and their comorbidities were 61.03, 55.49, and 51.64 per 1,000 person-years (PYs), respectively (Fig. 2). Consistent with the prevalence estimates, the incidence density of MAFLD (94.73 per 1,000 PYs) was higher than that of NAFLD (74.72 per 1,000 PYs) in men. However, the difference between the incidence densities of MAFLD (37.39 per 1,000 PYs) and NAFLD (40.22 per 1,000 PYs) in women was small.
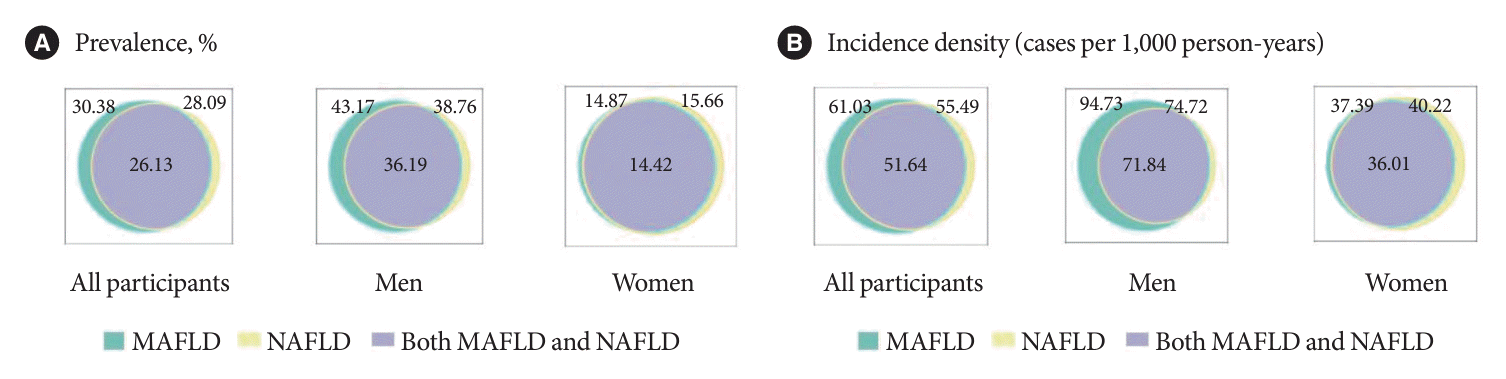
Fig. 2.
The prevalence and incidence densities of metabolic dysfunction-associated fatty liver disease (MAFLD) and non-alcoholic fatty liver disease (NAFLD). (A) Prevalence. (B) Incidence density. A total of 37,422 participants were included in the prevalence calculations of MAFLD and NAFLD. A total of 18,964, 19,511, and 20,046 participants were included in the incidence density calculations of MAFLD, NAFLD, and the comorbidity of both, respectively.
![]()
Baseline characteristics in the cohort analyses
A total of 18,964 participants were included in the cohort analyses for associations between healthy lifestyle factors and MAFLD risk. After 65,948 PYs of follow-up (range, 0.5 to 6.5 years; median, 3.0 years), a total of 4,025 participants developed MAFLD. The baseline characteristics according to the incident MAFLD status are presented in Table 1. Compared with participants without incident MAFLD, those with incident MAFLD were older, tended to be men, and were less educated, had higher BMI and lower household income, and were more likely to have a family history of CVD, hypertension, and diabetes.
Table 1.
Baseline characteristics of participants according to incident MAFLD (n=18,964)
| Characteristic | No incident MAFLD (n=14,939) | Incident MAFLD (n=4,025) | P valuea |
|---|---|---|---|
| Age, yr | 39.26 (39.08–39.44) | 42.60 (42.25–42.96) | <0.0001 |
| Male sex, % | 38.78 | 64.00 | <0.0001 |
| Body mass index (kg/m2) | 22.29 (22.25–22.33) | 25.14 (25.04–25.23) | <0.0001 |
| Waist circumference, cm | 76.44 (76.30–76.58) | 84.91 (84.63–85.19) | <0.0001 |
| Systolic pressure, mm Hg | 115.66 (115.43–115.89) | 123.28 (122.83–123.72) | <0.0001 |
| Diastolic pressure, mm Hg | 72.78 (72.61–72.94) | 77.97 (77.66–78.29) | <0.0001 |
| FPG, mmol/L | 4.94 (4.93–4.95) | 5.15 (5.13–5.17) | <0.0001 |
| HbA1c, % | 5.37 (5.36–5.38) | 5.50 (5.48–5.52) | <0.0001 |
| 2-hour post-load glucose, mmol/L | 5.77 (5.72–5.82) | 6.34 (6.26–6.43) | <0.0001 |
| Triglycerides, mmol/L | 1.04 (0.95–1.13) | 1.71 (1.54–1.88) | <0.0001 |
| HDL-cholesterol, mmol/L | 1.52 (1.51–1.53) | 1.30 (1.29–1.31) | <0.0001 |
| High-sensitivity C-reactive protein, mg/L | 0.99 (0.98–1.00) | 1.43 (1.41–1.45) | <0.0001 |
| Energy intake, kcal/day | 1,948.74 (1,930.11–1,967.56) | 1,961.55 (1,925.55–1,998.23) | 0.54 |
| Education (≥college graduate), % | 75.90 | 70.98 | <0.0001 |
| Household income (≥10,000 Yuan/mo), % | 39.08 | 36.85 | 0.01 |
| Employment status, % | |||
| Managers | 47.09 | 46.85 | 0.80 |
| Professionals | 15.72 | 16.42 | 0.29 |
| Other | 37.20 | 36.73 | 0.59 |
| Family diseases history, % | |||
| CVD | 29.33 | 35.36 | <0.0001 |
| Hypertension | 49.40 | 55.36 | <0.0001 |
| Diabetes | 23.53 | 29.11 | <0.0001 |
| Healthy lifestyle factors, % | |||
| No current smoking | 86.94 | 76.05 | <0.0001 |
| No heavy drinking | 91.28 | 85.09 | <0.0001 |
| Regular physical activity | 36.09 | 39.83 | <0.0001 |
| Healthy diet | 49.72 | 51.06 | 0.13 |
| No. of healthy lifestyle factors, % | |||
| 0 | 1.37 | 2.93 | <0.0001 |
| 1 | 6.09 | 10.56 | <0.0001 |
| 2 | 35.42 | 33.59 | 0.03 |
| 3 | 41.35 | 37.39 | <0.0001 |
| 4 | 15.76 | 15.53 | 0.72 |
| History of disease, % | |||
| Diabetes | 7.84 | 16.22 | <0.0001 |
| Hypertension | 11.37 | 25.85 | <0.0001 |
| Dyslipidemia | 30.12 | 50.09 | <0.0001 |
![]()
Associations between healthy lifestyle and the risk of MAFLD
The associations between adherence a healthy lifestyle and incident MAFLD are presented in Table 2. The incidence densities were 105.36, 58.85, 55.47, and 58.48 per 1,000 PYs for participants with 0–1, 2, 3, and 4 healthy lifestyle factors, respectively. As shown in Table 2, participants with more healthy lifestyle factors had a lower risk of MAFLD.
Table 2.
Associations between baseline healthy lifestyle and the risk of MAFLD (n=18,964)
| Variable |
No. of healthy lifestyle factors |
P for trenda | |||
|---|---|---|---|---|---|
| 0–1 | 2 | 3 | 4 | ||
| No. of participants | 1,658 | 6,644 | 7,683 | 2,979 | |
| No. of incident MAFLD | 543 | 1,352 | 1,505 | 625 | |
| Person-years | 5,154 | 22,975 | 27,131 | 10,688 | |
| Crude model | Reference | 0.56 (0.51–0.62) | 0.53 (0.48–0.59) | 0.56 (0.50–0.63) | <0.0001 |
| Adjusted model 1b | Reference | 0.90 (0.82–1.00) | 0.83 (0.75–0.92) | 0.81 (0.72–0.91) | <0.0001 |
| Adjusted model 2c | Reference | 0.91 (0.82–1.01) | 0.84 (0.75–0.93) | 0.81 (0.72–0.92) | <0.001 |
| Adjusted model 3d | Reference | 0.95 (0.86–1.05) | 0.89 (0.80–0.99) | 0.87 (0.77–0.98) | <0.01 |
Values are presented as hazard ratio (95% confidence interval).
MAFLD, metabolic dysfunction-associated fatty liver disease.
a P for trend was calculated using Cox proportional hazard models by coding groups as a continuous variable,
![]()
Subgroup analyses
Subgroup analyses found that the associations between healthy lifestyle and incident MAFLD were modified by baseline age (P for interaction=0.02), sex (P for interaction=0.03), and BMI (P for interaction=0.03) (Table 3). Participants with healthier lifestyle showed a lower risk of incident MAFLD in all subgroups except women. The favourable effects of healthy lifestyle on incident MAFLD were pronounced in participants aged younger than 40 years, men, and those with a BMI lower than 24. As shown in Fig. 3, most separated healthy lifestyle factors were negatively associated with the incidence of MAFLD, except that without heavy drinking demonstrated a marginal significance (HR, 0.95; 95% CI, 0.87 to 1.04). The associations between the separated healthy lifestyle factors and the incidence of MAFLD differed across the subgroups. For example, both regular physical activity and a healthy diet showed favourable effects on MAFLD in participants younger than 40 years. In contrast, without current smoking and heavy drinking demonstrated negative associations with incident MAFLD in those older than 40 years.
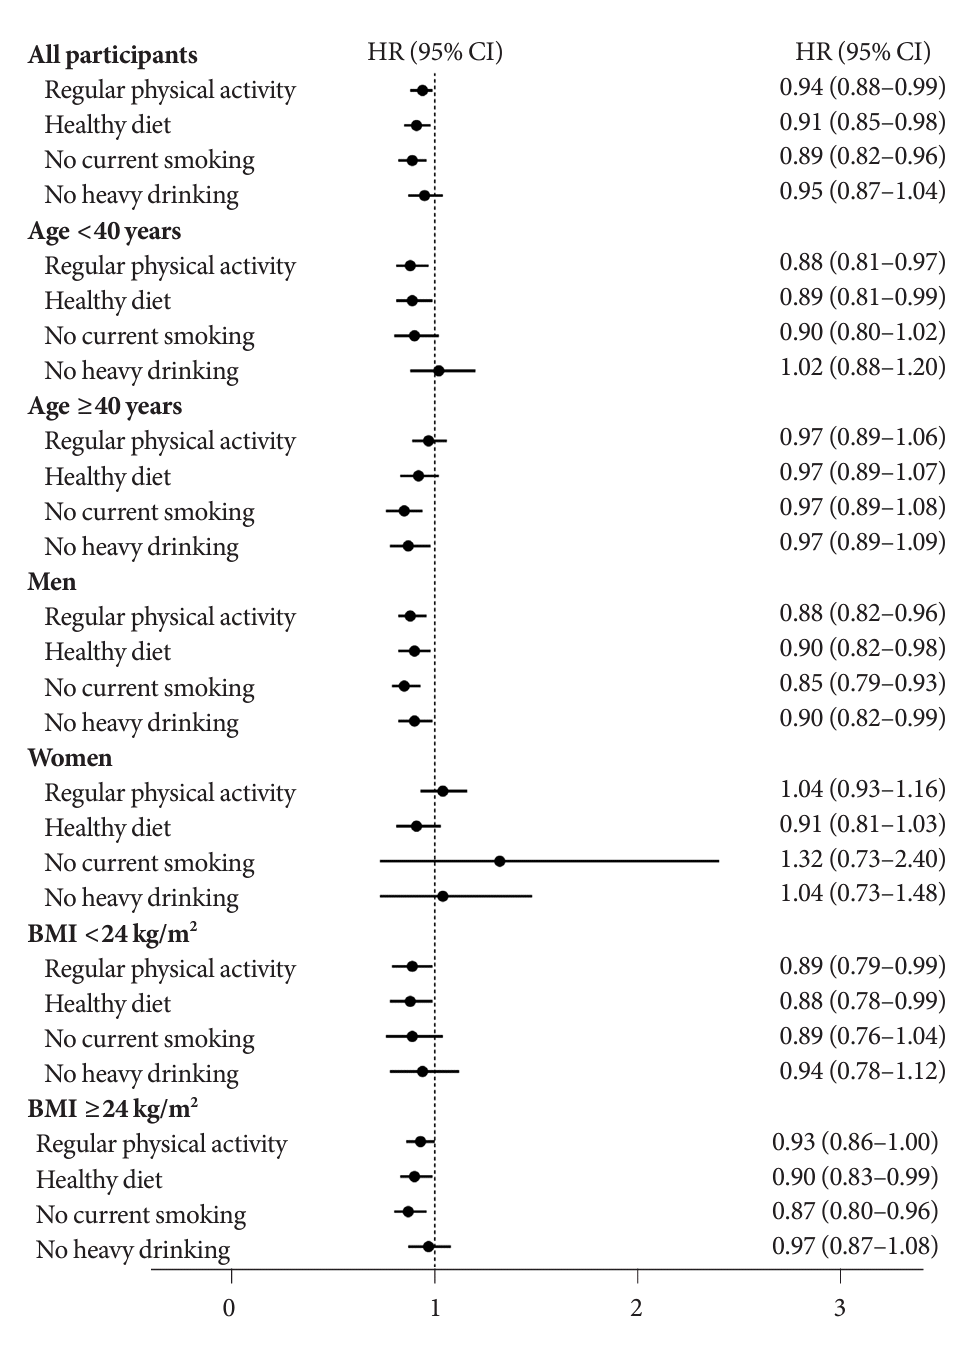
Fig. 3.
Associations between separated healthy lifestyle and the risk of metabolic dysfunction-associated fatty liver disease by age, sex, and body mass index (BMI) at baseline (n=18,964). Adjusted for age, sex, BMI, educational level, employment status, household income, energy intake per day, and family history of diseases (cardiovascular disease, hypertension, and diabetes) at baseline. HR, hazard ratio; CI, confidence interval.
![]()
Table 3.
Associations between baseline healthy lifestyle and the risk of MAFLD by age, sex, and BMI (n=18,964)
| Variable |
No. of healthy lifestyle factors |
P for trenda | P for interactionb | |||
|---|---|---|---|---|---|---|
| 0–1 | 2 | 3 | 4 | |||
| Age | 0.02 | |||||
| <40 years | ||||||
| No. of participants | 666 | 3,905 | 4,520 | 1,729 | ||
| No. of incident MAFLD | 205 | 647 | 744 | 302 | ||
| Person-years | 2,080 | 13,756 | 16,108 | 6,240 | ||
| Crude model | Reference | 0.48 (0.41–0.56) | 0.47 (0.40–0.55) | 0.49 (0.41–0.59) | <0.0001 | |
| Adjusted model 1c | Reference | 0.88 (0.75–1.03) | 0.81 (0.69–0.95) | 0.73 (0.61–0.88) | <0.001 | |
| Adjusted model 2d | Reference | 0.89 (0.76–1.05) | 0.84 (0.71–0.98) | 0.76 (0.63–0.91) | <0.01 | |
| Adjusted model 3e | Reference | 0.93 (0.79–1.09) | 0.90 (0.76–1.04) | 0.81 (0.67–0.97) | 0.02 | |
| ≥40 years | ||||||
| No. of participants | 992 | 2,739 | 3,163 | 1,250 | ||
| No. of incident MAFLD | 338 | 705 | 761 | 323 | ||
| Person-years | 3,075 | 9,219 | 11,023 | 4,448 | ||
| Crude model | Reference | 0.70 (0.62–0.80) | 0.64 (0.56–0.73) | 0.67 (0.58–0.79) | <0.0001 | |
| Adjusted model 1c | Reference | 0.89 (0.78–1.02) | 0.80 (0.70–0.92) | 0.83 (0.71–0.97) | <0.01 | |
| Adjusted model 2d | Reference | 0.89 (0.78–1.02) | 0.79 (0.69–0.91) | 0.81 (0.69–0.95) | <0.01 | |
| Adjusted model 3e | Reference | 0.93 (0.81–1.06) | 0.84 (0.73–0.96) | 0.85 (0.74–0.99) | 0.02 | |
| Sex | 0.03 | |||||
| Men | ||||||
| No. of participants | 1,505 | 2,539 | 2,934 | 1,392 | ||
| No. of incident MAFLD | 526 | 806 | 853 | 391 | ||
| Person-years | 4,650 | 8,192 | 9,564 | 4,787 | ||
| Crude model | Reference | 0.87 (0.78–0.97) | 0.79 (0.71–0.88) | 0.73 (0.64–0.83) | <0.0001 | |
| Adjusted model 1c | Reference | 0.90 (0.81–1.00) | 0.80 (0.72–0.90) | 0.74 (0.65–0.85) | <0.0001 | |
| Adjusted model 2d | Reference | 0.90 (0.80–1.00) | 0.80 (0.71–0.89) | 0.73 (0.64–0.83) | <0.0001 | |
| Adjusted model 3e | Reference | 0.93 (0.83–1.04) | 0.85 (0.76–0.95) | 0.78 (0.68–0.89) | <0.0001 | |
| Women | ||||||
| No. of participants | 153 | 4,105 | 4,749 | 1,587 | ||
| No. of incident MAFLD | 17 | 546 | 652 | 234 | ||
| Person-years | 504 | 14,783 | 17,567 | 5,901 | ||
| Crude model | Reference | 1.10 (0.68–1.78) | 1.11 (0.68–1.79) | 1.18 (0.72–1.94) | 0.80 | |
| Adjusted model 1c | Reference | 1.05 (0.65–1.69) | 0.96 (0.59–1.55) | 1.02 (0.63–1.67) | 0.51 | |
| Adjusted model 2d | Reference | 1.07 (0.66–1.93) | 0.99 (0.61–1.60) | 1.06 (0.65–1.75) | 0.75 | |
| Adjusted model 3e | Reference | 1.05 (0.64–1.70) | 0.97 (0.60–1.57) | 1.03 (0.63–1.68) | 0.61 | |
| BMI | 0.03 | |||||
| <24 kg/m2 | ||||||
| No. of participants | 811 | 4,378 | 4,991 | 1,862 | ||
| No. of incident MAFLD | 146 | 461 | 498 | 195 | ||
| Person-years | 2,780 | 16,269 | 18,690 | 7,176 | ||
| Crude model | Reference | 0.54 (0.45–0.65) | 0.50 (0.42–0.61) | 0.51 (0.41–0.64) | <0.0001 | |
| Adjusted model 1c | Reference | 0.86 (0.71–1.04) | 0.79 (0.65–0.96) | 0.71 (0.57–0.88) | <0.001 | |
| Adjusted model 2d | Reference | 0.86 (0.70–1.06) | 0.79 (0.65–0.97) | 0.71 (0.56–0.90) | <0.001 | |
| Adjusted model 3e | Reference | 0.92 (0.76–1.12) | 0.89 (0.73–1.08) | 0.80 (0.63–0.99) | 0.03 | |
| ≥24 kg/m2 | ||||||
| No. of participants | 847 | 2,266 | 2,692 | 1,117 | ||
| No. of incident MAFLD | 397 | 891 | 1,007 | 430 | ||
| Person-years | 2,374 | 6,706 | 8,441 | 3,512 | ||
| Crude model | Reference | 0.80 (0.71–0.90) | 0.72 (0.64–0.81) | 0.74 (0.65–0.85) | <0.0001 | |
| Adjusted model 1c | Reference | 0.92 (0.81–1.04) | 0.84 (0.75–0.95) | 0.82 (0.71–0.94) | <0.001 | |
| Adjusted model 2d | Reference | 0.91 (0.80–1.04) | 0.83 (0.73–0.94) | 0.81 (0.70–0.94) | <0.001 | |
| Adjusted model 3e | Reference | 0.94 (0.84–1.07) | 0.87 (0.77–0.98) | 0.84 (0.73–0.97) | <0.01 | |
Values are presented as hazard ratio (95% confidence interval).
MAFLD, metabolic dysfunction-associated fatty liver disease; BMI, body mass index.
a P for trend was calculated using Cox proportional hazard models by coding groups as a continuous variable,
b P for interaction was calculated by involving the multiplicative terms in the Cox proportional hazards model (model 2),
![]()
Sensitivity analyses
The following sensitivity analyses were performed. First, after further adjusted for diabetes, hypertension, and dyslipidemia at baseline, the results were consistent with the main results (Tables 2 and 3). Second, we constructed a weighted healthy lifestyle score instead of an unweighted score. The results had similar point estimates to the main analyses (Supplementary Table 3). Third, women with 0–1 or 2 healthy lifestyle factors were merged into one group, and little change was observed (Supplementary Table 4). In the fourth and fifth sensitivity analyses, we re-defined MAFLD using a lower threshold of ≥1 instead of ≥2 metabolic abnormalities (Supplementary Table 5) or excluded CRP level from the definition (Supplementary Table 6), respectively. All the results were consistent with the main analyses. Sixth, we first validated the associations between the three NAFLD-associated SNPs and the risk of MAFLD. The results suggested that only rs2896019 in patatin like phospholipase domain containing 3 (PNPLA3) was associated with the MAFLD risk (Supplementary Table 7). Therefore, we studied the associations of the joint classifications of healthy lifestyle and rs2896019 genotypes with the risk of MAFLD. Participants with more healthy lifestyle factors and lower genetic risk had a lower risk of MAFLD (P for trend=0.02) (Supplementary Table 8). However, there was no significant HR across the joint classifications, possibly because of the small sample size.
DISCUSSION
In this large population-based prospective cohort study, we found that the incidence density and prevalence of MAFLD were higher than those of NAFLD in men but similar in women. Furthermore, adherence to an overall healthy lifestyle was associated with a 19% decrease in the risk of MAFLD after adjustments. Baseline age, sex, and BMI showed modifying effects on this negative association. The favourable effects of an overall healthy lifestyle on MAFLD risk were more pronounced in men, younger participants, and those with a lower BMI.
Since the new definition of MAFLD was proposed in 2020 [2], a few studies have estimated the prevalence in different ethnic populations, including Americans, Koreans, Europeans, and Chinese [3-6]. Our study’s results are consistent with that of a previous large study of 152,139 Chinese adults, which reported that the prevalence of MAFLD, NAFLD, and their comorbidities were 31.50%, 27.30%, and 26.74%, respectively [6]. MAFLD has mostly been used as an exposure variable in previous studies, and the incidence density of MAFLD are still lacking. Furthermore, the incidence density of MAFLD compared with that of NAFLD remains unclear. In China mainland, two cohort studies estimated the incident rate of MAFLD [24,25]. However, the individual level follow-up time in these studies was unavailable, and the incidence density of MAFLD could not be calculated [24,25]. Another cohort study of 565 participants from Hong Kong found that the incidence density of MAFLD (fatty liver was defined by intrahepatic triglyceride content) was 2.8 per 100 PYs [26]. Considering the small sample size, the estimates could be biased. Our study extends previous findings by comprehensively calculating the incidence densities of MAFLD, NAFLD, and their comorbidities in a large cohort. Consistent with the prevalence estimates, the incidence density of MAFLD was higher than that of NAFLD, and this difference was remarkably pronounced in men. The underlying reason could be that metabolic abnormalities and heavy drinking are more prevalent in men than in women [4]. These results emphasise the urgent need for preventive strategies for MAFLD, particularly in men.
To our knowledge, no previous study has explored the associations between a combination of lifestyle factors and MAFLD risk. All previous studies have focused on the beneficial effects of healthy lifestyle factors on NAFLD [27-29]. For example, in a cross-sectional study of 2,981 adults, compared with individuals with 0 or 1 healthy lifestyle factor, those with 5 or 6 healthy lifestyle factors had a 65% decreased presence of NAFLD [27]. Another randomised controlled trial conducted on non-obese NAFLD patients demonstrated that dietary and exercise interventions achieved better remission of NAFLD than routine care [29]. Considering that compared with the former definition of NAFLD, MAFLD can better identify participants with significant fibrosis [30], capture metabolically complicated fatty liver, and is strongly associated with poor health outcomes, such as CVD [4] and mortality [3], exploring modifiable risk factors and establishing preventive strategies for MAFLD are necessary. This study extended the knowledge that adherence to an overall healthy lifestyle is associated with a lower risk of MAFLD. Interestingly, an overall healthy lifestyle was associated with similar relative risk reductions in MAFLD across all subgroups, except women. A possible reason could be that compared with men (18.0% had 0 or 1 healthy lifestyle factor), few women (1.4% had 0 or 1 healthy lifestyle factor) had unhealthy lifestyles. Specifically, compared to men, fewer women had habits of smoking and drinking, and were generally had higher levels of healthy diet consumption. Moreover, the prevalence of incidence of fatty liver disease was lower in women than in men. The analyses between components of healthy lifestyle and MAFLD confirmed this by finding that there was no significant association between single healthy lifestyle factor and the risk of MAFLD in women. The low incidence of MAFLD in women may limits the statistical power of the results. Further studies are warranted to explore sex differences in the associations between healthy lifestyle and the risk of MAFLD. Another notable result was that compared with participants with only NAFLD (9.5% had 0–1 healthy lifestyle factor), those with only MAFLD (51.1% had 0–1 healthy lifestyle factor) had much fewer healthy lifestyle factors (Supplementary Table 2), indicating the magnitude of the absence of health consciousness in MAFLD patients. The mechanisms underlying the beneficial effects of healthy lifestyle in MAFLD mainly include a series of metabolic alterations by exercise, vitamins and phytochemicals in healthier diets, and avoidance of smoking and drinking. These factors may inhibit MAFLD by reducing inflammation and oxidative stress [31-34]. Therefore, these results highlight the necessity of lifestyle modification for MAFLD prevention and treatment, particularly in men and those with only MAFLD. In addition, we found that the only MAFLD group have a poorer healthy lifestyle profile compared to the both MAFLD and NAFLD group. This may be due to the higher proportion of men in the only MAFLD group than in the comorbidities group. As we mentioned above, the number of health lifestyle factors in males are generally less than in females.
The strengths of this study including the prospective study design, large sample size, high-quality data, rich covariable adjustments, and multiple sensitivity analyses, which enabled us to obtain reliable and robust results. This study is also the first to estimate the incidence density of MAFLD and explore the beneficial effects of an overall healthy lifestyle on MAFLD risk in a large cohort, which provides new evidence regarding the epidemiological features and potential prevention strategies for MAFLD.
However, this study had several limitations. First, a causal association could not be inferred owing to the observational design. Second, as the healthy lifestyle factors were self–reported, recall bias and misclassifications would likely bias the results toward the null. Third, while we have adjusted for many covariates, unmeasured and residual confounding factors may have affected the observed associations. Fourth, hepatic ultrasonography was used to detect fatty liver in our cohort. Although hepatic ultrasonography is not the gold standard for diagnosing fatty liver, it is widely used in general population-based studies and has good sensitivity and specificity for detecting fatty liver disease [35]. Moreover, the reproducibility of liver sonography for the detection of fatty liver disease was not demonstrated in our study, potentially impacting the obtained results. Finally, the study sample was restricted to Chinese individuals, and further research is needed to test the generalizability of the results to more diverse populations.
In conclusion, the prevalence and incidence density of MAFLD were higher than those of NAFLD, particularly in men. Adherence to a healthy lifestyle was associated with a substantially reduced risk of MAFLD, and the effects were modified by baseline age, sex, and BMI. Therefore, health management for improving dietary intake, physical activity, and smoking and drinking habits, as well as public policies regarding smoking ban and alcohol restrictions, are critical to improving MAFLD.
 XML Download