Introduction
Materials and Methods
1. Patients
2. Microsatellite instability status
3. Single-cell RNA sequencing
4. Quality control, preprocessing of sequencing data, and unsupervised clustering
5. Spatial transcriptome
6. Trajectory analysis
7. Infer copy number variations analysis
8. Cell to cell interaction analysis
9. Defining CD8+ T cell existing spot in spatial transcriptome
10. Calculation of malignant-CD8+ T cell interaction score
11. Bulk sequencing data deconvolution
12. Survival analysis in public data
Results
1. Higher proportion of CD8+ T cell in MSI-H gastric cancer
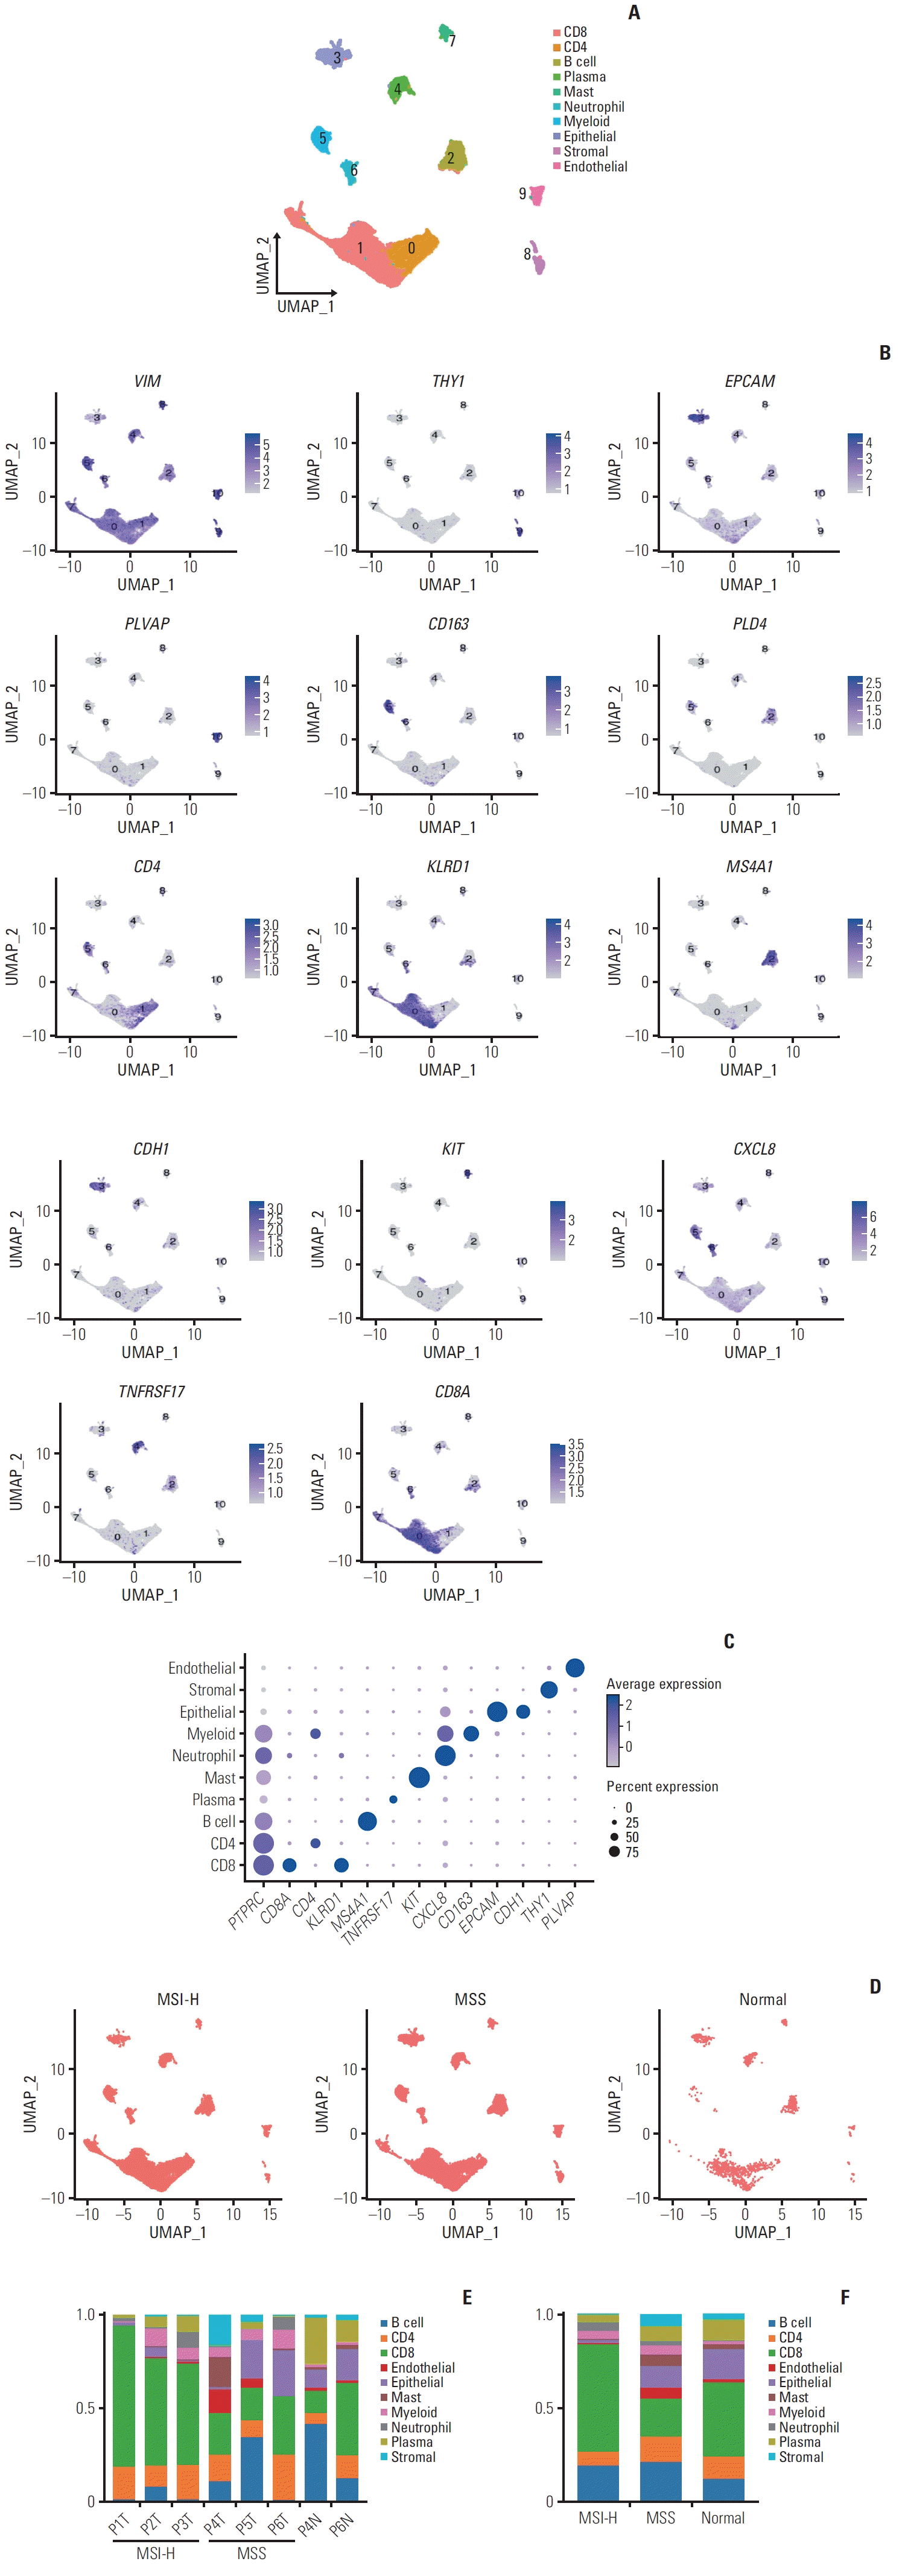 | Fig. 1.Single-cell atlas of microsatellite instability–high (MSI-H) and microsatellite stable (MSS) gastric cancer. (A) Uniform Manifold Approximation and Projection (UMAP) embeddings 45,087 cells. Clusters are highlighted in color. (B) The gene expression levels of known markers specific to each cell type are depicted on the UMAP plot. (C) Dot plot showing the proportions and average expression levels of marker genes for 10 cell types. (D) UMAP plot shows cells by MSI status. (E) Stacked bar plot shows the fraction of clusters by the samples. (F) Stacked bar plot shows the fraction of cells among MSI-H, MSS, and normal samples. |
Table 1.
EBV, Epstein-Barr virus; HER2, human epidermal growth factor receptor 2; L, lower third; LI, lymphatic invasion; M, middle third; MD, moderately differentiated; MSI, microsatellite instability; MSI-H, microsatellite instability–high; MSS, microsatellite stable; PD, poorly differentiated; PI, perineural invasion; VI, vascular invasion.
2. Effector function characteristics of exhausted T cell in MSI-H gastric cancer
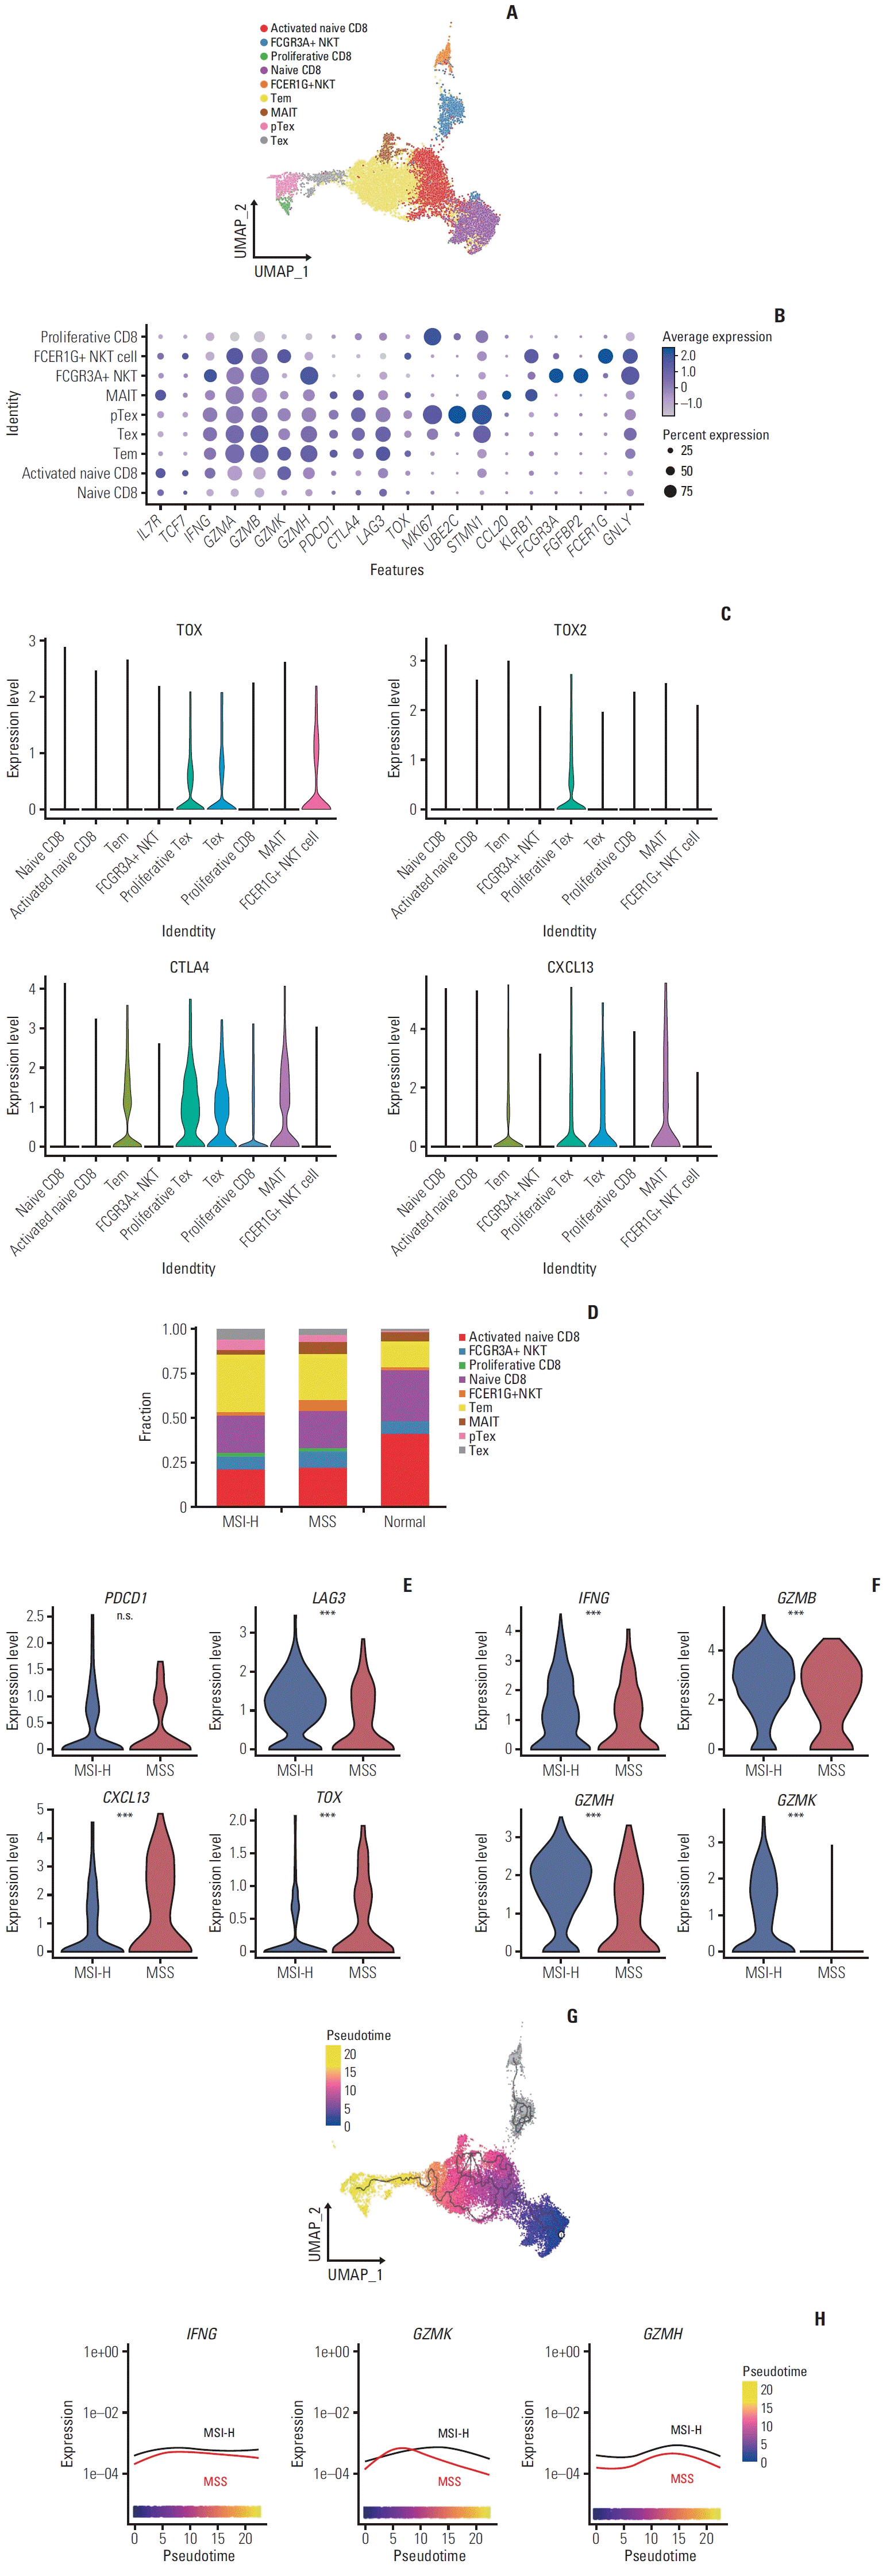 | Fig. 2.Sub-cellular analysis of CD8+ T cell. (A) Uniform Manifold Approximation and Projection (UMAP) plot embeddings 18,150 cells of CD8+ T cell. Clusters are highlighted in color. (B) Dot plot shows the proportions and average expression levels of marker genes for CD8+ T cell subtypes. MAIT, mucosal-associated invariant T; NKT, natural killer T; pTex, proliferative exhausted CD8+ T cell; Tem, effector memory CD8+ T cell; Tex, exhausted CD8+ T cell. (C) Violin plot shows the expression of exhaustion markers in T cell subtypes. (D) Stacked bar plot shows the fraction of CD8+ T cell subtypes between microsatellite instability–high (MSI-H), microsatellite stable (MSS) and normal samples. The color scale is the same as in A. (E) Violin plots compared marker genes of exhaustion in exhausted CD8+ T cell and proliferative exhausted CD8+ T cell between MSI-H and MSS samples (Wilcoxon rank sum test; ***p < 0.001). (F) Violin plots compared marker genes of effector function in exhausted CD8+ T cell and proliferative exhausted CD8+ T cell between MSI-H and MSS samples (Wilcoxon rank sum test; ***p < 0.001). (G) UMAP plot demonstrates trajectory analysis, with colored by inferred pseudotime. The trajectory of the NKT cells is represented in grey color, which means the independent trajectory. (H) Line plot illustrating the gene expression of IFNG, GZMK, and GZMH over the inferred pseudotime trajectory in CD8+ T cell. |
3. Sub-cellular analysis of epithelial cell
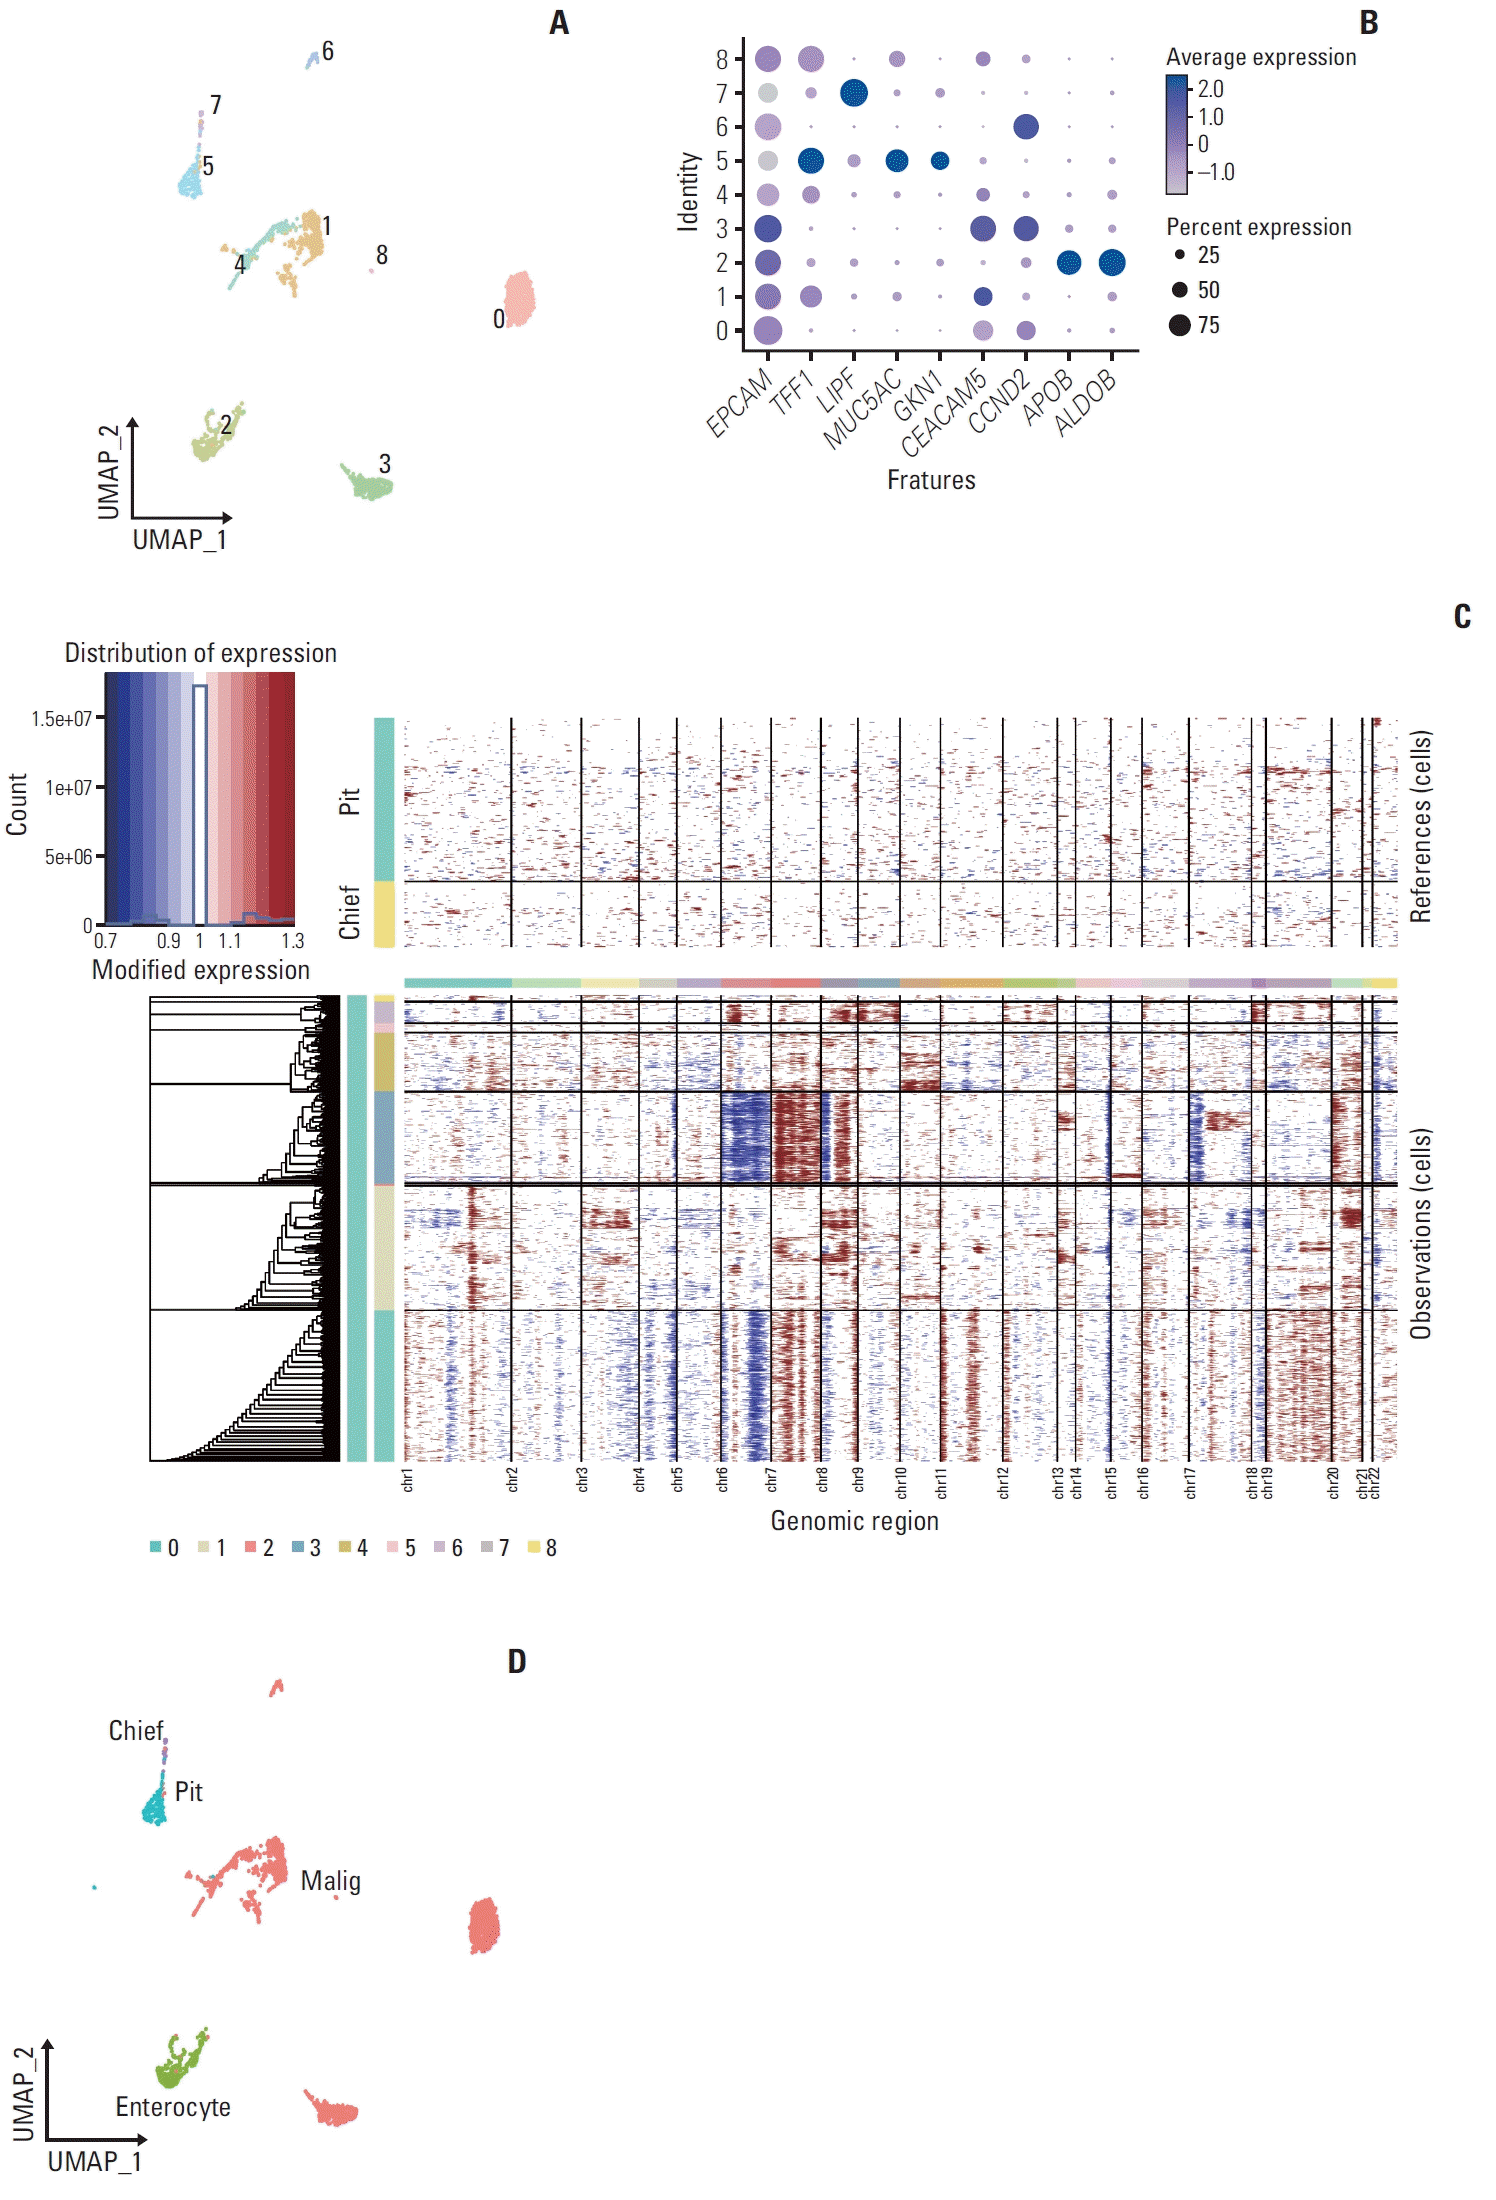 | Fig. 3.Sub-cellular analysis of epithelial cell. (A) Uniform Manifold Approximation and Projection (UMAP) plot embeddings 3,066 cells of epithelial cell. Clusters are highlighted in color. (B) Dot plot illustrates the proportions and average expression levels of epithelial marker genes such as TFF1 and MUC5AC for pit cell; LIPF for chief cell; APOB and ALDOB for enterocyte; CEACAM5 and CCND2 for malignant cell across the clusters. (C) A chromosomal landscape shows the inferred large-scale copy number variations within the epithelial sub-clusters, with annotation tracks on the left correlating to the respective clusters and chromosome numbers indicated at the bottom. (D) UMAP plot of 3,066 epithelial cells are marked for sub-cellular analysis, with cells color-coded by type: pit cell, chief cell, enterocyte, and malignant cell. |
4. Retained interferon-γ signaling pathway of exhausted T cell in MSI-H gastric cancer
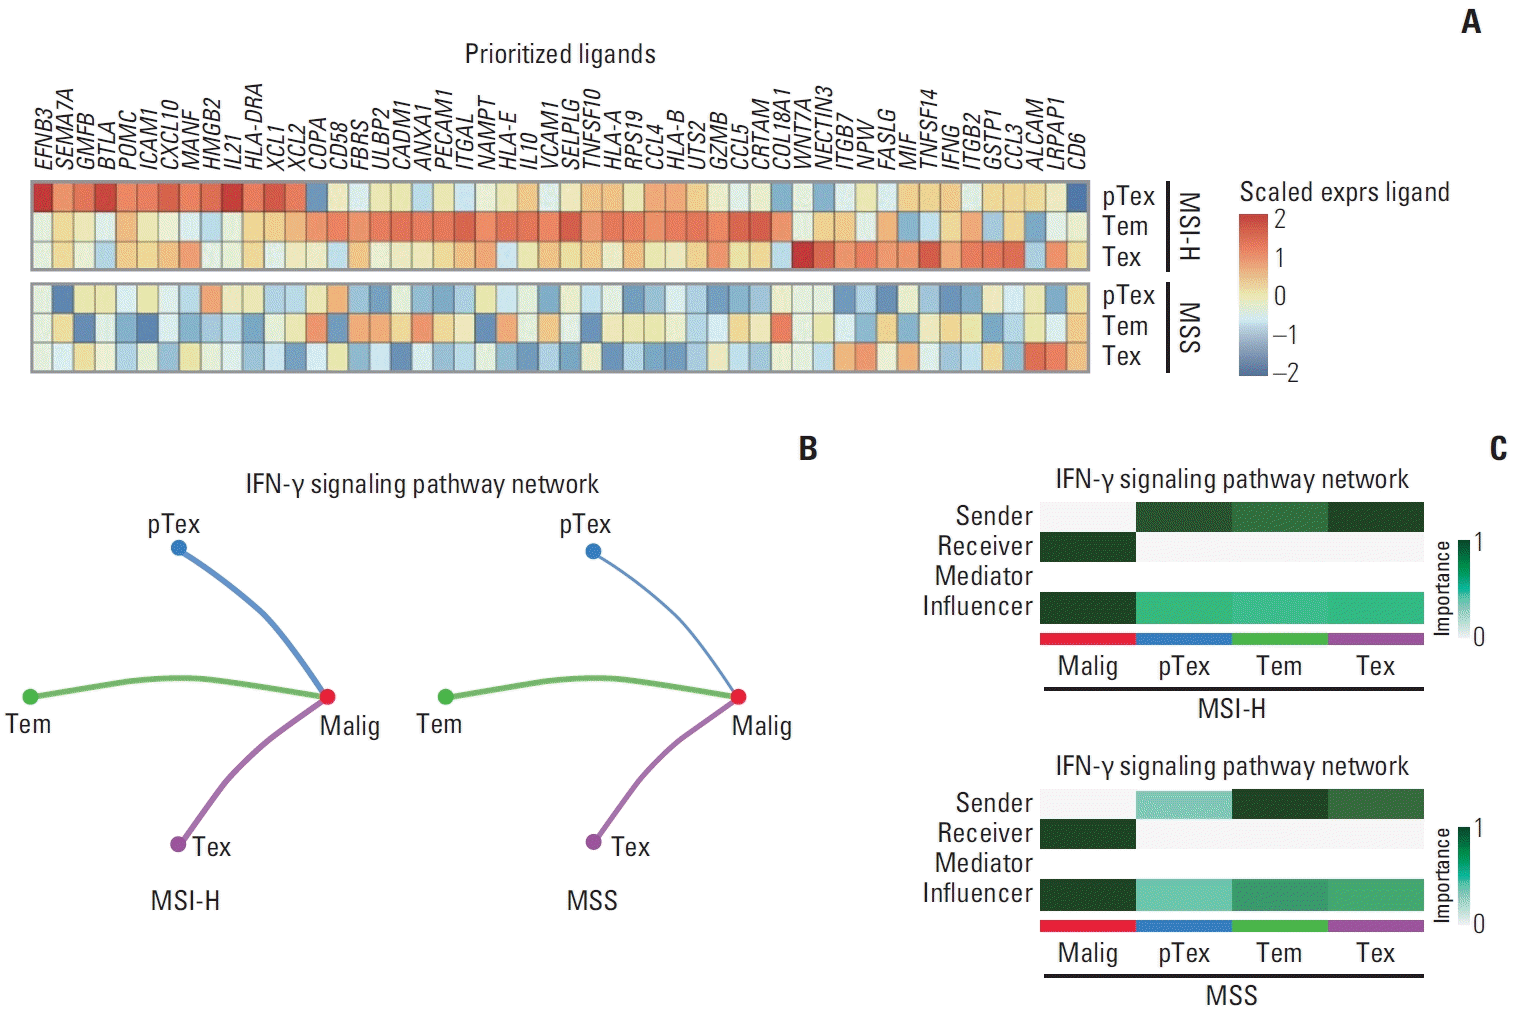 | Fig. 4.Cell-to-cell interaction analysis. (A) Heatmap of expression of prioritized ligands from NicheNet between microsatellite instability–high (MSI-H) and microsatellite stable (MSS) gastric cancer. Heatmap is colored by scaled expression of the ligands (top). (B) The inferred interferon γ (IFN-γ) signaling networks calculated by CellChat in MSI-H (left) and MSS samples (right). Edge width represents the communication probability. (C) The heatmap displays the relative importance of each cell group within the IFN-γ signaling network for MSI-H and MSS gastric cancer, based on four computed network centrality measures. pTex, proliferative exhausted CD8+ T cell; Tem, effector memory CD8+ T cell; Tex, exhausted CD8+ T cell. |
5. Higher IFN-γ response between adjacent exhausted T cell and malignant cell in MSI-H gastric cancer
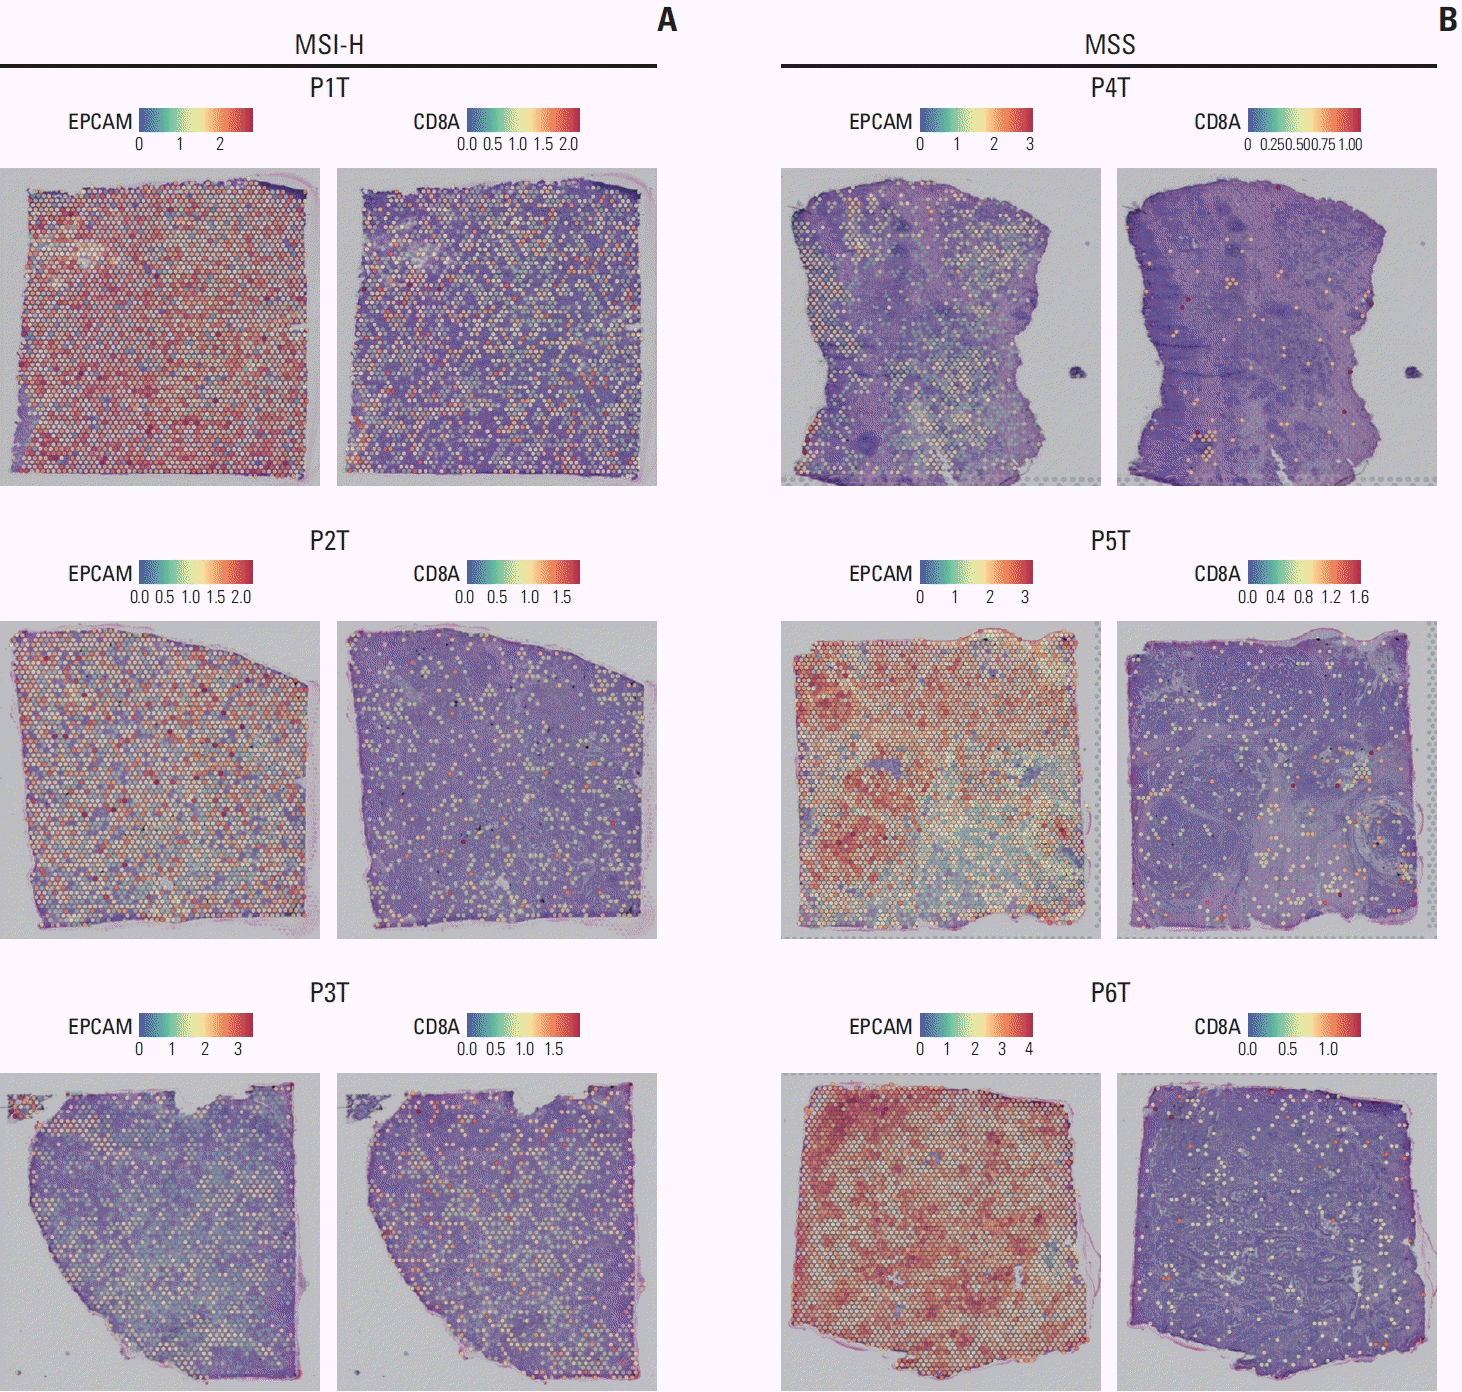 | Fig. 5.Epithelial cell and CD8+ T cell in spatial transcriptomic data. (A) Spatial transcriptomic data visualized with color coding based on the gene expression including EPCAM (left) and CD8A (right) in microsatellite instability–high (MSI-H) gastric cancer. (B) Spatial transcriptomic data visualized with color coding based on the gene expression including EPCAM (left) and CD8A (right) in microsatellite stable (MSS) gastric cancer. |
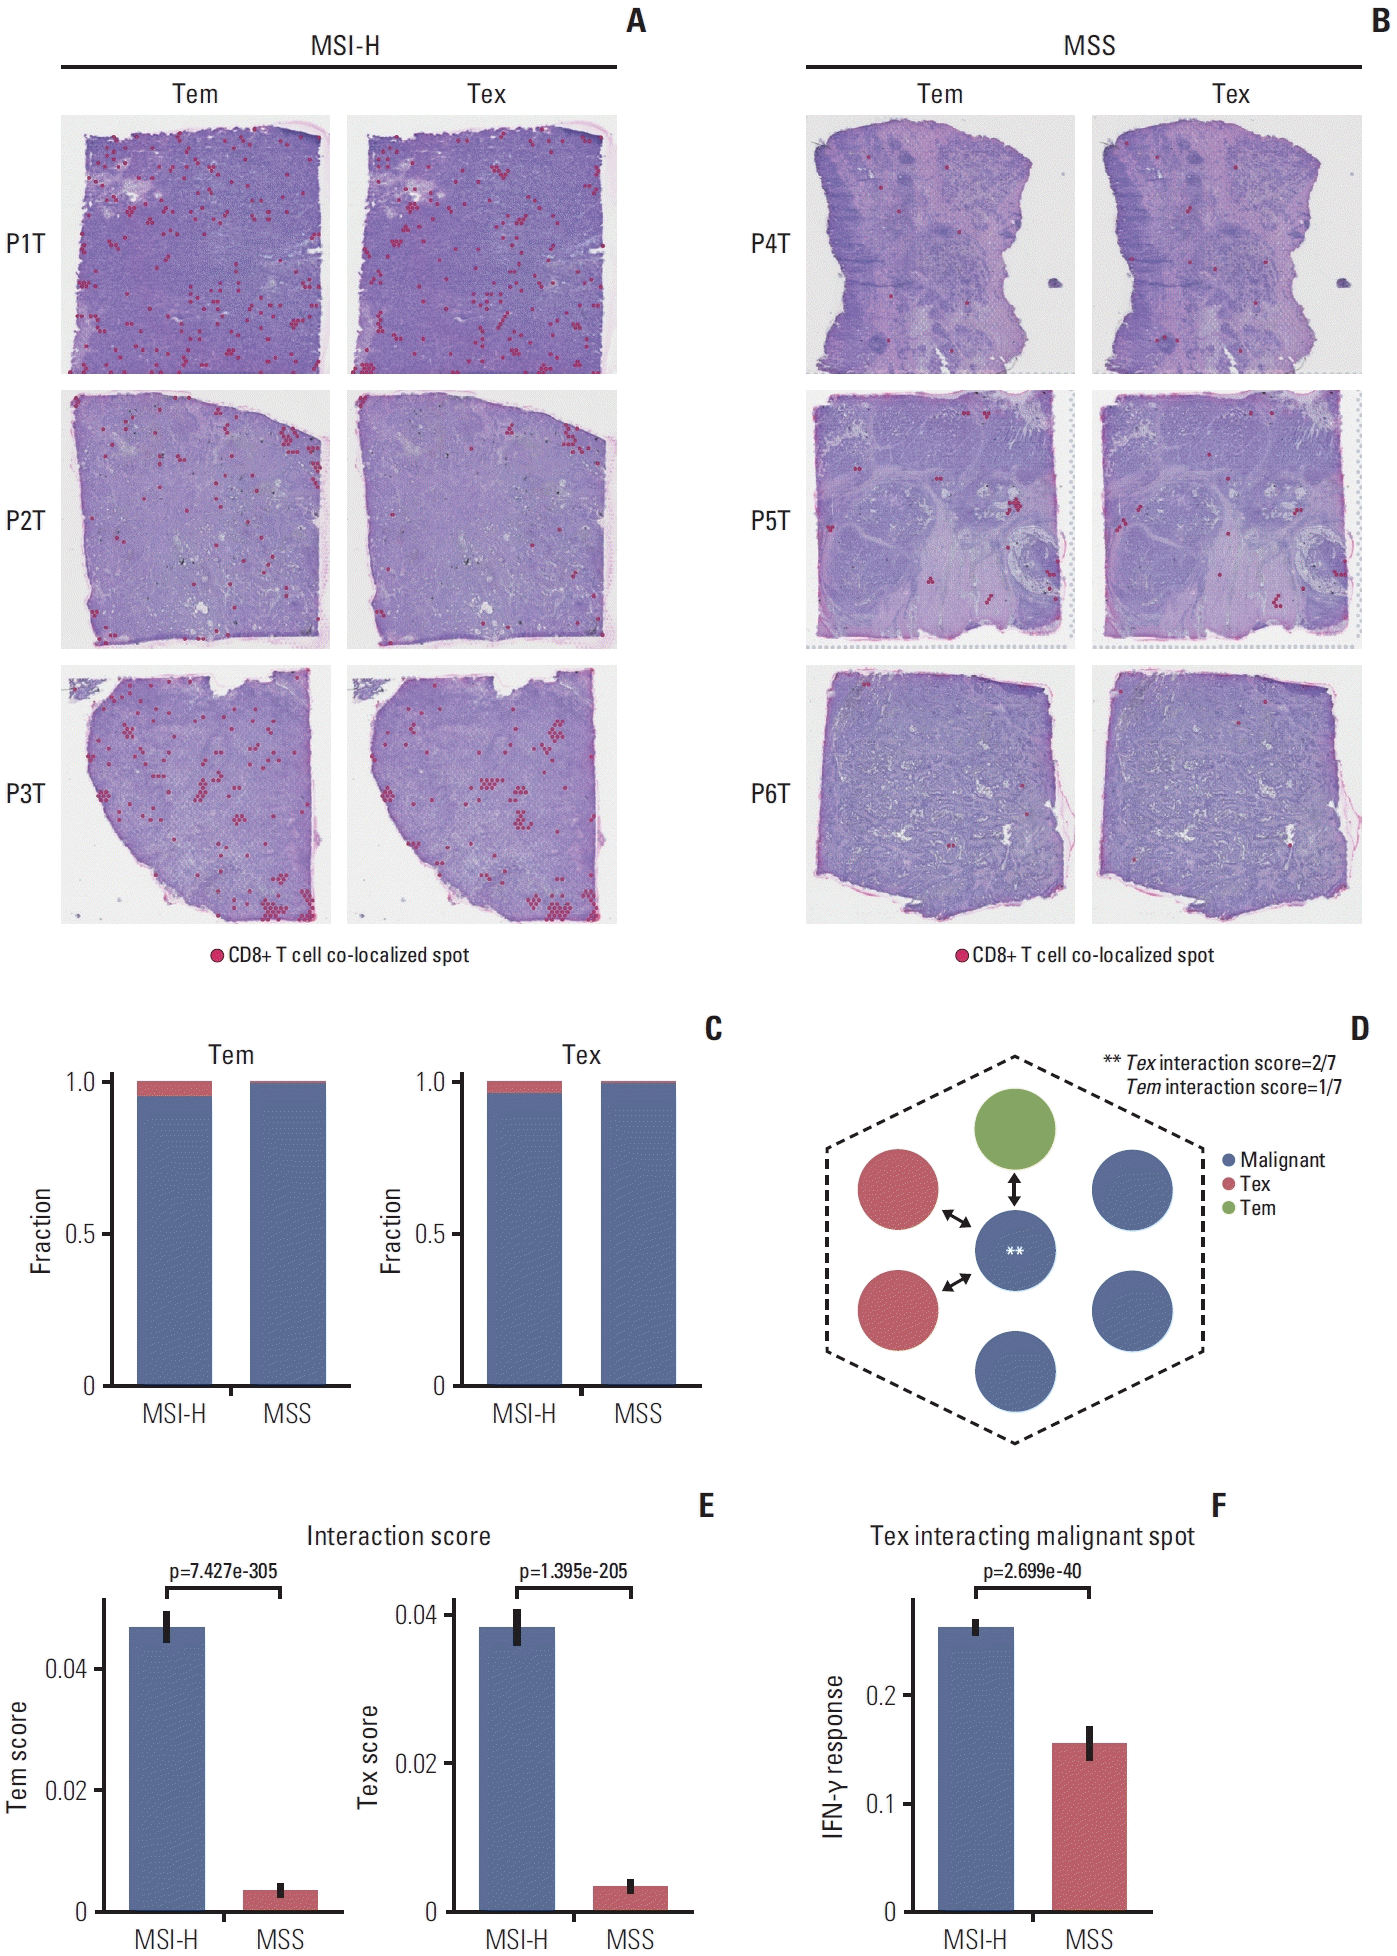 | Fig. 6.Spatial architecture of CD8+ T cell. (A) Effector memory CD8+ T cell (Tem) and exhausted CD8+ T cell (Tex) co-localized spots were marked on the spatial images in microsatellite instability–high (MSI-H) gastric cancer. (B) Tem and Tex co-localized spots were marked on the spatial images in microsatellite stable (MSS) gastric cancer. (C) Bar plot shows the fraction of Tem co-localized spot (left) and Tex co-localized spot (right) in integrated 3 MSI-H and 3 MSS spatial transcriptome samples. (D) Schematic representation of malignant cell - CD8+ T cell interaction score (i.e., malignant cell - Tex interaction score is 2/7 and malignant cell - Tem interaction score is 1/7). (E) Box plot shows malignant cell - Tem interaction scores (left) and malignant cell - Tex (right) in integrated three MSI-H and three MSS spatial transcriptome samples. (F) Box plot shows Hallmark IFN-γ response score from MSigDB in the exhausted CD8+ T cell interacting malignant spots in integrated three MSI-H and three MSS spatial transcriptome samples. |
6. Validation using bulk level transcriptome data
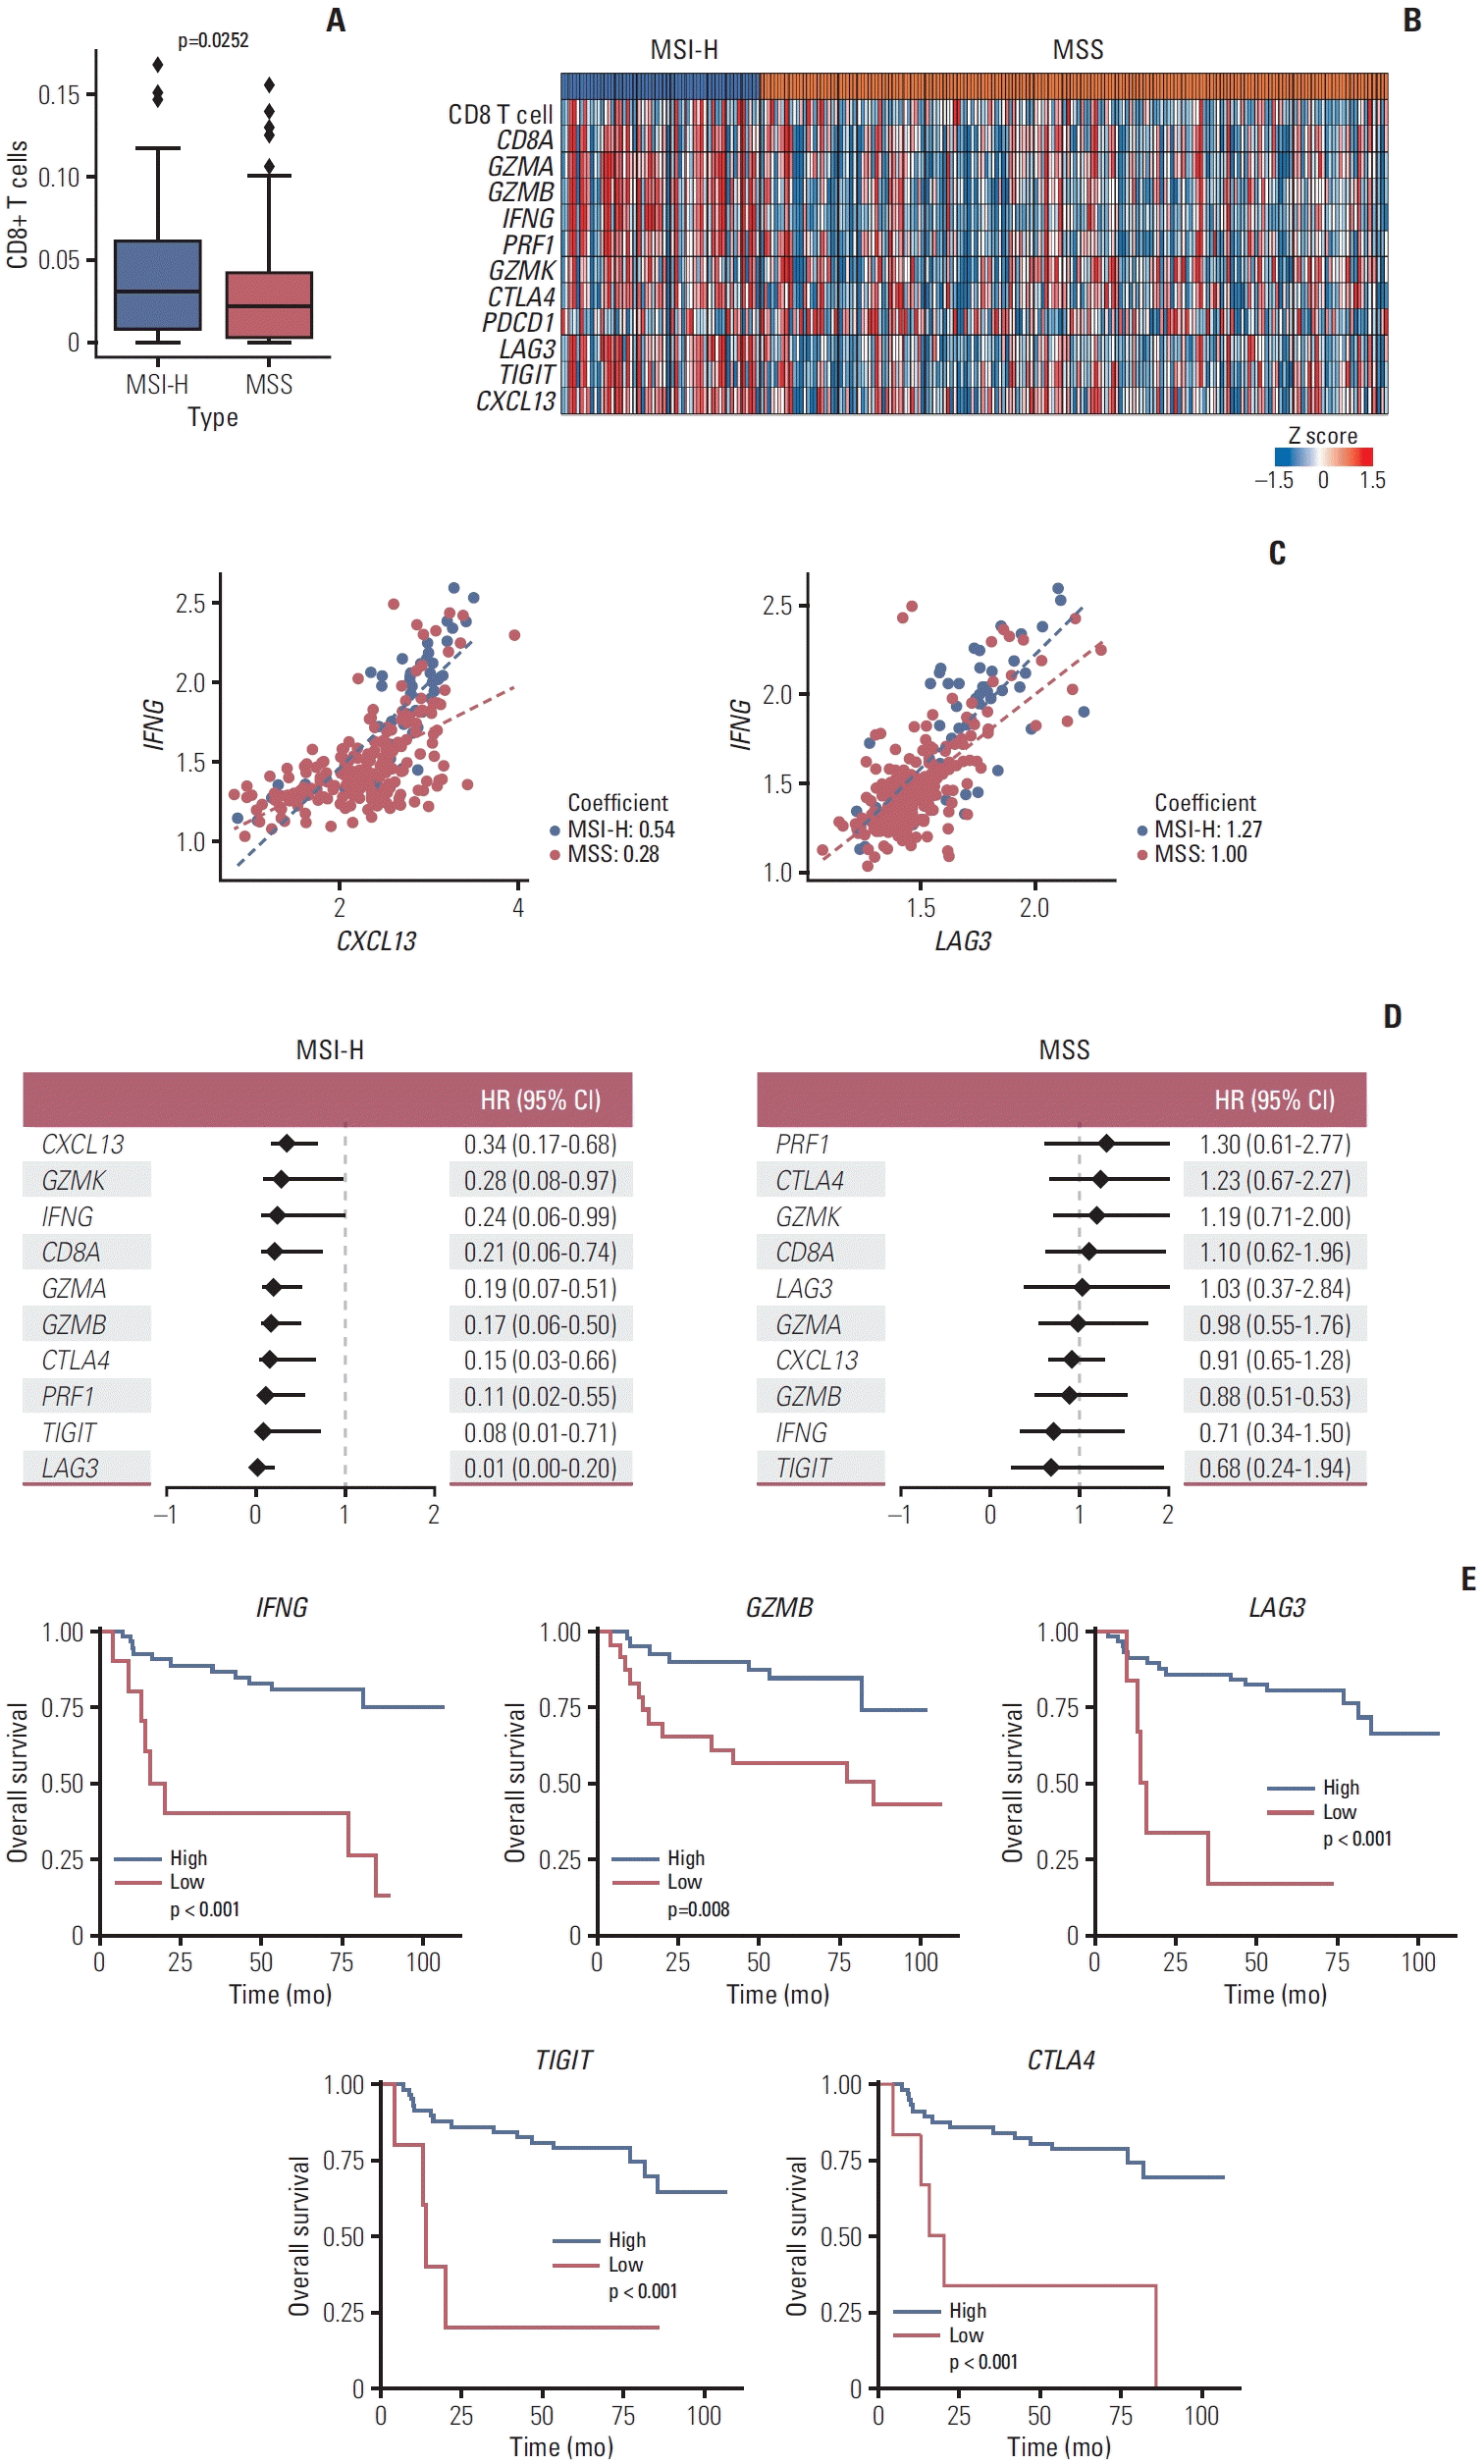 | Fig. 7.Validation using bulk level transcriptome data. (A) Box plot shows fraction of CD8+ T cells calculated by CIBERSORTx between microsatellite instability–high (MSI-H) and microsatellite stable (MSS) samples in ACRG cohort (GSE66229). (B) Heatmap of normalized gene expression including cytotoxic CD8+ T cell marker genes and exhausted CD8+ T cell marker genes in ACRG cohort. The heatmap is colored by z score across by the samples. (C) Scatter plot between IFNG and exhausted CD8+ T cell marker including CXCL13 (left) and LAG3 (right). The scatterplot is colored by MSI status and dash lines in each plot represents linear regression line. Coefficient value of linear regressions is marked on the plot. (D) Univariate Cox proportional hazard analysis of effector memory CD8+ T cell marker genes and exhausted CD8+ T cell marker genes in MSI-H patients (left) and MSS patients (right). CI, confidence interval; HR, hazard ratio. (E) Kaplan-Meier curves showing significant difference between gene expression high group and low group which is calculated by MaxStat R package in MSI-H patients. The plot is colored by the gene expression groups. |


 PDF
PDF Citation
 Print
Print


 XML Download