Introduction
Materials and Methods
1. Study design and participants
2. Study variables and data collection
3. Statistical analysis
Results
1. Patient characteristics between delirium and non-delirium groups
Table 1.
| Characteristic | Total (n=2,152) | Delirium group (n=127) | Non-delirium group (n=2,025) | p-value |
|---|---|---|---|---|
| Sociodemographic characteristic | ||||
| Age (yr), median (range) | 64 (18-97) | 69 (27-88) | 63 (18-97) | < 0.001 |
| Sex | ||||
| Male | 1,257 (58.4) | 89 (70.1) | 1,168 (57.7) | 0.007 |
| Female | 895 (41.6) | 38 (29.9) | 857 (42.3) | |
| Marital status | ||||
| Married | 1,776 (82.5) | 107 (84.3) | 1,669 (82.4) | 0.532 |
| Not married | 368 (17.1) | 19 (15.0) | 349 (17.2) | |
| Unknown | 8 (0.4) | 1 (0.8) | 7 (0.3) | |
| Education (n=1,513) | ||||
| High school or less | 984 (65.0) | 51 (66.2) | 933 (65.0) | |
| College/Graduate school | 529 (35.0) | 26 (33.8) | 503 (35.0) | |
| Smoking status | ||||
| Non-smoker | 1,475 (68.5) | 74 (58.3) | 1,401 (69.2) | |
| Ex-smoker | 626 (29.1) | 45 (35.4) | 581 (28.7) | |
| Current smoker | 51 (2.4) | 8 (6.3) | 43 (2.1) | |
| Alcohol consumption (n=2,151) | ||||
| Non-drinker | 1,772 (82.4) | 98 (77.2) | 1,674 (82.7) | 0.036 |
| 1-3 times a week | 265 (12.3) | 16 (12.6) | 249 (12.3) | |
| ≥ 4 times a week | 114 (5.3) | 13 (10.2) | 101 (5.0) | |
| BMI (n=2,144) | ||||
| Obese | 355 (16.6) | 21 (16.5) | 334 (16.6) | 0.563 |
| Overweight | 343 (16.0) | 24 (18.9) | 319 (15.8) | |
| Normal weight | 980 (45.7) | 51 (40.2) | 929 (46.1) | |
| Underweight | 466 (21.7) | 31 (24.4) | 435 (21.6) | |
| Living with family | 1,430 (66.4) | 82 (64.6) | 1,348 (66.6) | 0.698 |
| National health insurance | 2,054 (95.4) | 118 (92.9) | 1,936 (95.6) | 0.182 |
| Visual impairment (wearing glasses) | 108 (5.0) | 5 (3.9) | 103 (5.1) | 0.679 |
| Hearing impairment (using hearing aids) | 22 (1.0) | 4 (3.1) | 18 (0.9) | 0.037a) |
| Clinical characteristic | ||||
| Primary cancer | ||||
| Lung | 442 (20.5) | 49 (38.6) | 393 (19.4) | < 0.001 |
| Gastroesophageal and colorectal | 610 (28.3) | 31 (24.4) | 579 (28.6) | |
| Hepatopancreatobiliary | 391 (18.2) | 21 (16.5) | 370 (18.3) | |
| Genitourinary | 148 (6.9) | 7 (5.5) | 141 (7.0) | |
| Hematology | 91 (4.2) | 3 (2.4) | 88 (4.3) | |
| Breast | 122 (5.7) | 1 (0.8) | 121 (6.0) | |
| Head and neck | 139 (6.5) | 3 (2.4) | 136 (6.7) | |
| Others | 209 (9.7) | 12 (9.4) | 197 (9.7) | |
| Past medical history | ||||
| History of delirium | 56 (2.6) | 24 (18.9) | 32 (1.6) | < 0.001a) |
| History of cardiovascular disease | 833 (38.7) | 62 (48.8) | 771 (38.1) | 0.019 |
| History of diabetes mellitus | 476 (22.1) | 39 (30.7) | 437 (21.6) | 0.020 |
| History of respiratory disease | 189 (8.8) | 15 (11.8) | 174 (8.6) | 0.255 |
| History of liver disease | 144 (6.7) | 11 (8.7) | 133 (6.6) | 0.358 |
| History of psychiatric disease | 132 (6.1) | 17 (13.4) | 115 (5.7) | < 0.001 |
| History of CVA/head trauma | 175 (8.1) | 16 (12.6) | 159 (7.9) | 0.065 |
| Past history of admission | 2,016 (93.7) | 117 (92.1) | 1,899 (93.8) | 0.573 |
| Vital sign at admission | ||||
| Blood pressure | ||||
| SBP < 140 mmHg and DBP < 90 mmHg | 1,624 (75.5) | 89 (70.1) | 1,535 (75.8) | 0.166 |
| SBP ≥ 140 mmHg or DBP ≥ 90 mmHg | 528 (24.5) | 38 (29.9) | 490 (24.2) | |
| Body temperature | ||||
| Normal temperature (< 38℃) | 2,060 (95.7) | 121 (95.3) | 1,939 (95.8) | 0.819 |
| Hyperthermia (≥ 38℃) | 92 (4.3) | 6 (4.7) | 86 (4.2) | |
| Heart rate | ||||
| Normal rate (HR < 120/min) | 2,024 (94.1) | 114 (89.8) | 1,910 (94.3) | 0.050 |
| Tachycardia (HR ≥ 120/min) | 128 (5.9) | 13 (10.2) | 115 (5.7) | |
| Respiratory rate | ||||
| Normal respiratory rate (RR < 20/min) | 1,057 (49.1) | 61 (48.0) | 996 (49.2) | 0.855 |
| Tachypnea (RR ≥ 20/min) | 1,095 (40.9) | 66 (52.0) | 1,029 (50.8) | |
| Chemotherapy during hospitalization | 604 (28.1) | 20 (15.7) | 584 (28.8) | 0.001 |
| Duration of hospital admission (day), median (range) | 8 (1-117) | 13 (2-71) | 8 (1-117) | < 0.001 |
| Laboratory finding | ||||
| Complete blood test | ||||
| Hb < 8 g/dL | 183 (8.5) | 16 (12.6) | 167 (8.7) | 0.099 |
| WBC > 9.8×10³/μL | 708 (32.9) | 48 (37.8) | 660 (32.6) | 0.243 |
| PLT < 150×103/μL | 559 (26.0) | 41 (32.3) | 518 (25.6) | 0.096 |
| Liver function | ||||
| ALP > 129 IU/L | 986 (45.8) | 55 (43.3) | 914 (45.1) | 0.013 |
| AST > 40 IU/L | 712 (33.1) | 41 (32.3) | 671 (33.1) | 0.847 |
| ALT > 40 IU/L | 466 (21.7) | 20 (15.7) | 446 (22.0) | 0.097 |
| Total bilirubin > 1.2 mg/dL | 488 (22.7) | 27 (21.3) | 461 (22.8) | 0.744 |
| Albumin < 3.5 g/dL | 1,240 (57.6) | 81 (6.8) | 1,159 (57.2) | 0.165 |
| Total Protein < 6.5 g/dL | 1,303 (60.5) | 80 (63.0) | 1,223 (60.4) | 0.576 |
| Prothrombin time-INR > 1.2 (n=1,851) | 559 (30.2) | 48 (41.4) | 511 (29.5) | 0.009 |
| Renal function | ||||
| BUN > 20 mg/dL | 802 (37.3) | 72 (56.7) | 730 (36.0) | < 0.001 |
| Creatinine > 1.2 mg/dL | 321 (14.9) | 27 (21.3) | 294 (14.5) | 0.041 |
| eGFR < 60 mL/min/1.732 m2 | 362 (16.8) | 28 (22.0) | 334 (16.5) | 0.112 |
| Uric acid > 8.6 mg/dL | 135 (6.3) | 6 (4.7) | 129 (6.4) | 0.573 |
| Na < 135 mEq/L | 748 (34.8) | 55 (43.3) | 693 (34.2) | 0.043 |
| K > 5.1 mEq/L | 168 (7.8) | 17 (13.4) | 151 (7.5) | 0.019 |
| Ca > 10.2 mg/dL | 81 (3.8) | 11 (8.7) | 70 (3.5) | 0.007a) |
| P > 4.5 mg/dL | 162 (7.5) | 8 (6.3) | 154 (7.6) | 0.614 |
| Glucose < 74 mg/dL | 54 (2.5) | 4 (3.1) | 50 (2.5) | 0.557a) |
| CRP > 0.3 mg/dL (n=1,928) | 1,702 (88.3) | 94 (81.0) | 1,612 (88.9) | 0.114 |
| Medication | ||||
| Concomitant drugs | ||||
| Opioid | 1,358 (63.1) | 97 (76.4) | 1,261 (62.3) | 0.002 |
| Sedative | 362 (16.8) | 47 (37.0) | 315 (15.6) | < 0.001 |
| Antidepressant | 249 (11.6) | 22 (17.3) | 227 (11.2) | 0.044 |
| AED | 271 (12.6) | 19 (15.0) | 252 (12.4) | 0.408 |
| Cholinergic | 172 (8.0) | 8 (6.3) | 164 (8.1) | 0.508 |
| Anti-cholinergic | 159 (7.4) | 6 (4.7) | 153 (7.6) | 0.295 |
| Antibiotics use during hospital admission | 1,295 (60.2) | 98 (77.2) | 1,197 (59.1) | < 0.001 |
Values are presented as number (%) unless otherwise indicated. AED, antiepileptic drug; ALP, alkaline phosphatase; ALT, alanine aminotransferase; AST, aspartate aminotransferase; BMI, body mass index; BUN, blood urea nitrogen; CRP, C-reactive protein; CVA, cerebrovascular accident; DBP, diastolic blood pressure; eGFR, estimated glomerular filtration rate; Hb, hemoglobin; HR, heart rate; INR, international normalized ratio; PLT, platelet; RR, respiratory rate; SBP, systolic blood pressure; WBC, white blood cell.
2. Factors associated with the occurrence of delirium
Table 2.
AED, antiepileptic drug; ALP, alkaline phosphatase; ALT, alanine aminotransferase; AST, aspartate aminotransferase; BMI, body mass index; BUN, blood urea nitrogen; CI, confidence interval; CVA, cerebrovascular accident; DBP, diastolic blood pressure; eGFR, estimated glomerular filtration rate; Hb, hemoglobin; HR, heart rate; OR, odds ratio; PLT, platelet; RR, respiratory rate; SBP, systolic blood pressure; WBC, white blood cell.
3. Development of the prediction model for delirium and prediction ability
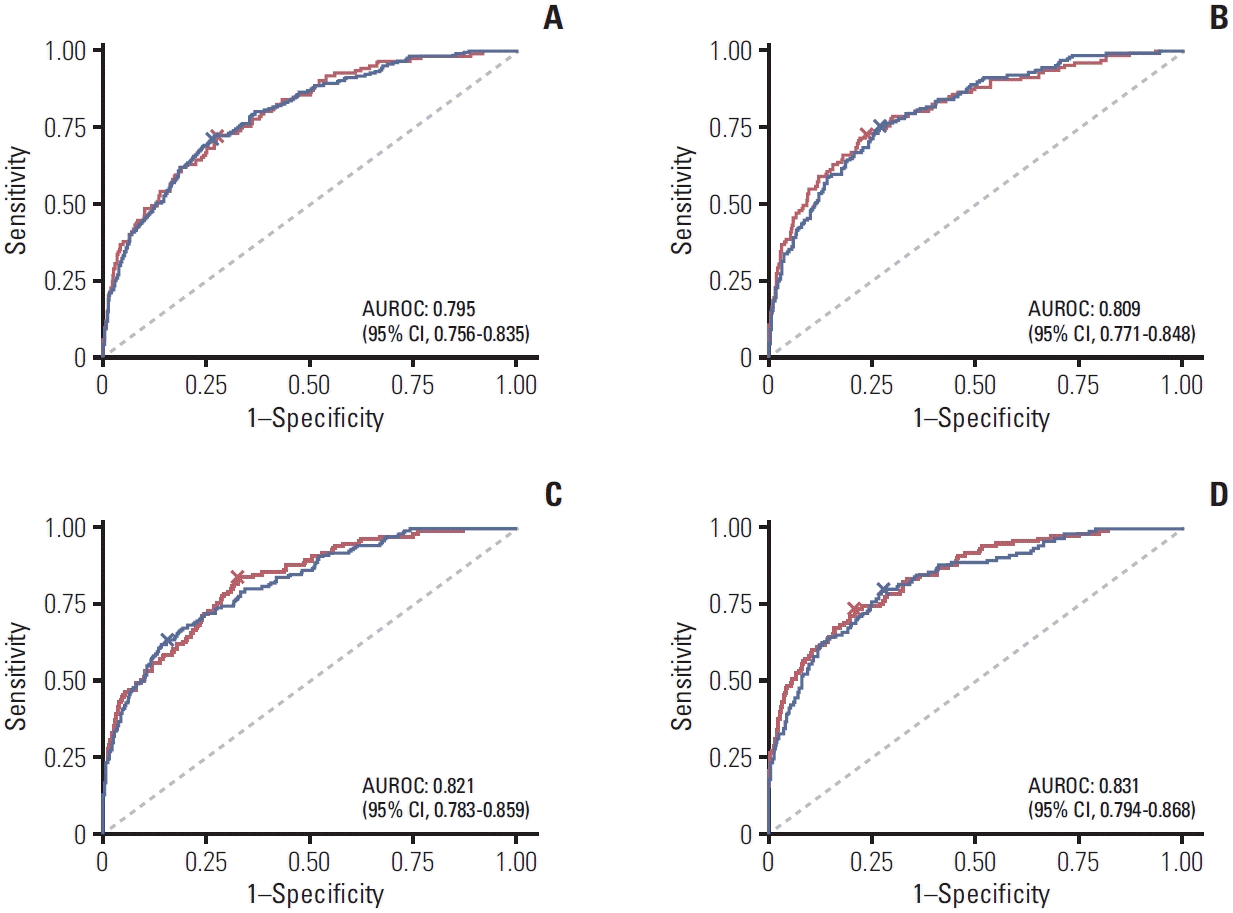
Fig. 1.


 PDF
PDF Citation
 Print
Print


 XML Download