Journal List > J Liver Cancer > v.24(2) > 1516088657

Bae, Lee, Hur, Yoo, and Park: Re-assessing the diagnostic value of the enhancing capsule in hepatocellular carcinoma imaging

Abstract

Backgrounds/Aims

The enhancing capsule (EC) in hepatocellular carcinoma (HCC) diagnosis has received varying degrees of recognition across major guidelines. This study aimed to assess the diagnostic utility of EC in HCC detection.

Methods

We retrospectively analyzed patients who underwent pre-surgical computed tomography (CT) and hepatobiliary agent-enhanced magnetic resonance imaging (HBA-MRI) between January 2016 and December 2019. A single hepatic tumor was confirmed based on the pathology of each patient. Three radiologists independently reviewed the images according to the Liver Imaging Reporting and Data System (LI-RADS) v2018 criteria and reached a consensus. Interobserver agreement for EC before reaching a consensus was quantified using Fleiss κ statistics. The impact of EC on the LI-RADS classification was assessed by comparing the positive predictive values for HCC detection in the presence and absence of EC.

Results

In total, 237 patients (median age, 60 years; 184 men) with 237 observations were included. The interobserver agreement for EC detection was notably low for CT (κ=0.169) and HBA-MRI (κ=0.138). The presence of EC did not significantly alter the positive predictive value for HCC detection in LI-RADS category 5 observations on CT (94.1% [80/85] vs. 94.6% [88/93], P=0.886) or HBAMRI (95.7% [88/92] vs. 90.6% [77/85], P=0.178).

Conclusions

The diagnostic value of EC in HCC diagnosis remains questionable, given its poor interobserver agreement and negligible impact on positive predictive values for HCC detection. This study challenges the emphasis on EC in certain diagnostic guidelines and suggests the need to re-evaluate its role in HCC imaging.

GRAPHICAL ABSTRACT

INTRODUCTION

Hepatocellular carcinoma (HCC) is the most common form of primary liver cancer with substantial morbidity and mortality rates worldwide.1 An accurate and early diagnosis is crucial for appropriate treatment planning and improved patient outcomes.2,3 HCC can be diagnosed using imaging modalities, including multiphasic computed tomography (CT) and magnetic resonance imaging (MRI) with extracellular contrast agents, hepatobiliary agents, or contrast-enhanced ultrasonography, without pathologic confirmation in high-risk patients.4,5 According to the Liver Imaging Reporting and Data System (LI-RADS) version 2018, nonrim arterial phase hyperenhancement (APHE), nonperipheral washout, threshold growth, and enhancing capsule (EC) on contrast-enhanced CT or MRI are major imaging features for HCC diagnosis.6
EC findings may be associated with a fibrous capsule (FC) on pathology, which is HCC-specific and rarely observed in other tumors.7 Contrast-enhanced MRI has a high specificity (90%) for HCC diagnosis.8 However, a recent meta-analysis of individual patient data highlighted a weak association between EC and HCC (odds ratio, 2.4). Conversely, other primary LI-RADS features, including nonrim APHE and nonperipheral washout, exhibited significantly higher odds ratios of 13.2 and 10.3, respectively.9 EC demonstrates a lower interobserver agreement (κ-values, 0.64-0.85) than nonrim APHE (κ-values, 0.72-0.99) and nonperipheral washout (κ-values, 0.69-0.95).10-13 Furthermore, there are divergent guidelines for EC recognition in HCC imaging. Contrary to LI-RADS, which regards EC as a major feature, the European Association for the Study of the Liver (EASL) does not recognize EC as a primary feature for HCC diagnosis.14 Additionally, the Korean Liver Cancer Association-National Cancer Center (KLCA-NCC) classifies EC as an ancillary imaging feature.15,16 This inconsistency among major guidelines underscores the ambiguity surrounding the diagnostic significance of EC for HCC.17
Considering the varied opinions and the lack of comprehensive exploration of the role of ECs in non-invasive HCC diagnosis, this study critically evaluated the diagnostic utility of EC in HCC when using contrast-enhanced CT and hepatobiliary agent-enhanced MRI (HBA-MRI). Furthermore, the interobserver agreement for EC and its impact on LI-RADS categorization were assessed by using pathology as the reference standard.

METHODS

This retrospective study was approved by the Institutional Review Board (IRB) of the Seoul National University Hospital (IRB No. H-2203-168-1310), and the requirement for informed consent was waived.

Patients

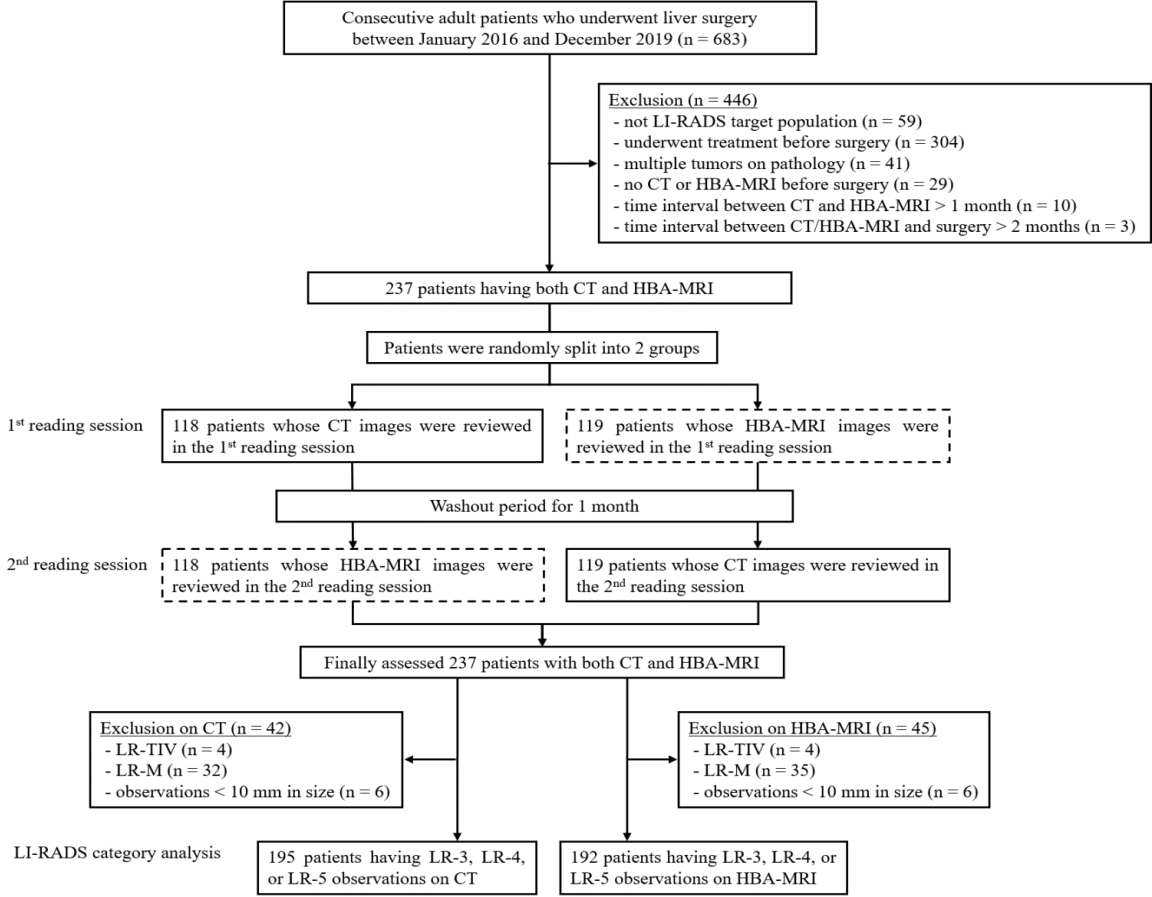
Using the Seoul National University Hospital database, a tertiary referral center, we identified adult patients who underwent hepatic resection or transplantation between January 2016 and December 2019. The study coordinator (JSB, a board-certified radiologist with 11 years of experience in abdominal imaging) reviewed the medical records to identify eligible patients. The following patients were included: those who were in the target population of the LI-RADS (i.e., any cause of cirrhosis or chronic hepatitis B),6 who had a single hepatic tumor on pathology, and who had undergone both liver CT and HBA-MRI before surgery. To determine whether a patient was eligible for the LI-RADS target population, the presence of cirrhosis in the formal radiologic report and/or pathologic examination as well as a history of chronic hepatitis B virus infection in medical records were used. We specifically included patients with singular tumors to facilitate statistical analysis. The following patients were excluded: those who underwent treatment for HCC before surgery, who did not undergo CT or HBA-MRI before surgery, with a >1-month time interval between CT and HBA-MRI, with a >2-month time interval between CT/HBA-MRI and surgery, and with sub-optimal image quality on CT or HBA-MRI.

CT and HBA-MRI protocols

All CT and HBA-MRI examinations met the technical acquisition standards of the 2018 LI-RADS. Dual portal venous phases were obtained 53 and 73 seconds after contrast medium injection using HBA-MRI.18 The imaging protocols and scan parameters are described in Supplementary Material 1 and Supplementary Table 1.

Image analysis

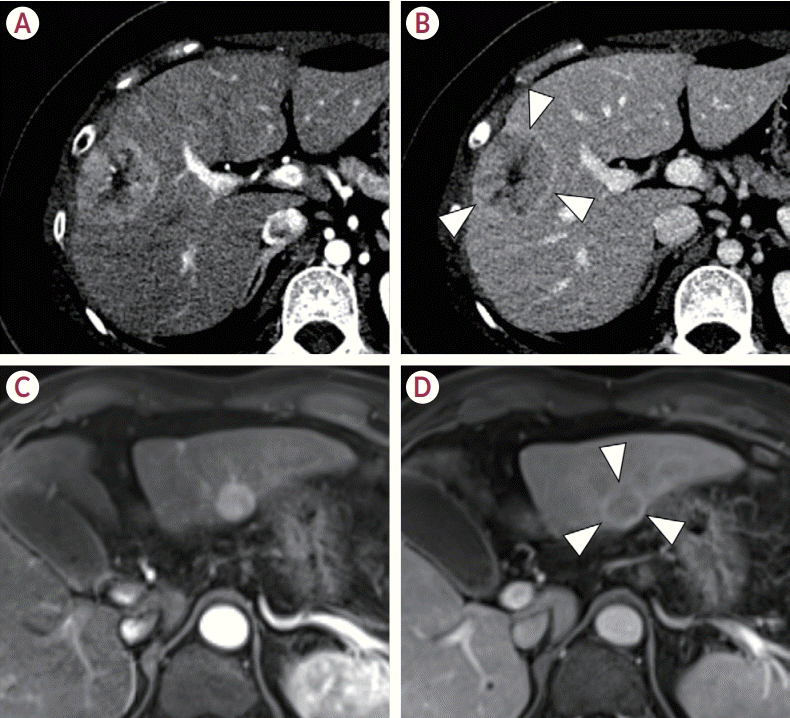
Three board-certified radiologists (BYH, JY, and SJP, with 15, 10, and 9 years of experience in abdominal imaging, respectively) independently assessed the CT and HBA-MRI scans by using a crossover design (Fig. 1). They were aware that the patients had undergone liver resection or transplantation, but were blinded to their pathological information. Before the review, they received the full version of the LI-RADS manual, which contained representative examples of imaging features, and were instructed to evaluate the CT and HBA-MR images based on LI-RADS version 2018.6,19 According to the LI-RADS manual, EC is defined as a subtype which features a capsule-like appearance that is visible as an enhancing rim in the portal venous, delayed, or transitional phase (Fig. 2).19 On HBA-MRI, the presence of nonperipheral washout on at least one of the dual portal venous phase images was considered positive. Other major and ancillary imaging features of the LI-RADS, besides threshold and subthreshold growth, were also assessed. Subsequently, the LI-RADS categorization was performed using the LI-RADS CT/MRI diagnostic algorithm. If a contiguous parenchymal mass was present on LI-RADS tumor in vein (LR-TIV) observation, the LI-RADS category of the parenchymal mass was used. A consensus was reached through independent image reviews; unresolved discrepancies were resolved through discussions with another senior radiologist (JML, with 32 years of experience in abdominal imaging).

Pathological assessment

We reviewed the pathological reports on surgical specimens written by pathologists specializing in liver pathology. For lesions noted on gross examination, a microscopic assessment was performed using hematoxylin and eosin-stained slides. For a pathologically diagnosed tumor, the presence and completeness (i.e., complete or partial) of the FC were described.

Statistical analysis

Continuous variables are presented as mean standard deviation or median (range) and were compared using the independent t-test or Mann-Whitney U test. Categorical variables are presented as number (percentage) and were compared using the chi-squared test. Interobserver agreements for LI-RADS major features, including EC, were assessed using Fleiss κ statistics. The following convention was used to interpret κ-values: poor, <0.20; fair, 0.21-0.40; moderate, 0.41-0.60; substantial, 0.61-0.80; nearly perfect, 0.81-1.00.20 The sensitivity, specificity, accuracy, positive predictive value (PPV), and negative predictive value (NPV) of EC for detecting FC in pathology were calculated. The chi-square test was used to assess the correlation between EC and FC. We also calculated and compared the sensitivities and specificities of LI-RADS category 5 (LR-5) before and after inclusion of EC for diagnosing HCC using the McNemar test. Furthermore, we excluded observations with LR-TIV without a parenchymal mass, LI-RADS M (LR-M) without nonrim APHE, or <10 mm in size, and analyzed the LI-RADS categorization of the remaining observations to assess the diagnostic value of EC in HCC when using CT or HBA-MRI (Fig. 1). We excluded observations without nonrim APHE and those <10 mm in size; they could not be categorized as LR-5. The PPV of EC for diagnosing HCC was calculated and compared in the presence and absence of EC. We emphasized observations exhibiting nonrim APHE and nonperipheral washout; these features are widely acknowledged as radiologic hallmarks of HCC in the prevailing guidelines and are more strongly associated with HCC than with EC.6,9,14,15 We also conducted subgroup analyses based on tumor size (10-19 vs. 20-29 vs. ≥30 mm).
We assessed the diagnostic performance of the recent KLCA-NCC guidelines (version 2022), which regarded EC as an ancillary feature in its diagnostic algorithm for HCC, and compared it with the LI-RADS value. Statistical analyses were performed using MedCalc v19.0.7 (MedCalc Software, Ostend, Belgium), and IBM SPSS v27.0 (IBM, Armonk, NY, USA). Statistical significance was set at P-values of <0.05.

RESULTS

Patient characteristics

Among the 683 adult patients who underwent hepatic resection or transplantation, 237 (median age, 60 years [interquartile range, 53-65]; 184 men) were included (Fig. 1). Details regarding the patient characteristics are presented in Table 1. Most patients underwent resection (94.9% [225/237]). HCC accounted for the majority (88.2% [209/237]) of the pathological diagnoses, followed by combined HCC-cholangiocarcinoma (cHCC-CCA) (7.2% [17/237]), intrahepatic cholangiocarcinoma (3.4% [8/237]), eosinophilic abscesses (2/237 [0.8%]), and colon cancer metastasis (0.4% [1/237]). FC was observed in 147 tumors, including 144 HCCs (98.0%) and three cHCC-CCAs (2.0%). FC was complete in 39 tumors and incomplete in 108 tumors.

Detection of the FC

Interobserver agreement for EC was poor among the three reviewers for both CT (κ, 0.169; 95% confidence interval [CI], 0.095-0.243) and HBA-MRI (κ, 0.138; 95% CI, 0.065-0.212), moderate for nonrim APHE (κ, 0.535 and 0.503 with CT and HBA-MRI, respectively), and fair for nonperipheral washout (κ, 0.307 and 0.374 with CT and HBA-MRI, respectively). The diagnostic performances of EC for FC are shown in Table 2. The sensitivity and specificity of EC were 46.9% (69/147; 95% CI, 38.7-55.3) and 71.1% (64/90; 95% CI, 60.6-80.2) with CT, and 55.1% (81/147; 95% CI, 46.7-63.3) and 73.3% (66/90; 95% CI, 63.0-82.1) with HBA-MRI, respectively. The latter was more sensitive than the former in detecting EC (difference, 8.2%; 95% CI, 1.5-14.8; P=0.029). The accuracy of EC for FC was 56.1% (137/237; 95% CI, 49.5-62.5) and 62.0% (147/237; 95% CI, 55.5-68.2) with CT and HBA-MRI, respectively. EC also demonstrated a positive correlation with the degree of FC on pathology (i.e., complete/partial/absent) on CT or HBA-MRI (P=0.018 and P<0.001, respectively) (Supplementary Table 2).

Value of EC for HCC diagnosis

With CT, the sensitivity and specificity of the LR-5 category before including EC for diagnosing HCC were 79.9% (167/209; 95% CI, 73.8-85.1) and 64.3% (18/28; 95% CI, 44.1-81.4), respectively (Table 3). After including EC, the sensitivity and specificity of the LR-5 category for diagnosing HCC were 80.4% (168/209; 95% CI, 74.3-85.5) and 64.3% (18/28; 95% CI, 44.1-81.4), respectively. With EC, the PPV, NPV, and accuracy were 94.4% (168/178; 95% CI, 91.1-96.5), 30.5% (18/59; 95% CI, 22.9-39.3), and 78.5% (186/237; 95% CI, 72.7-83.5), respectively. The PPVs for the LR-4 and LR-3 categories were 85.7% (12/14; 95% CI, 44.3-100.0) and 66.7% (6/9; 95% CI, 24.5- 100.0), respectively. There was no significant difference in sensitivity or specificity before and after including EC.
With HBA-MRI, the sensitivity and specificity of the LR-5 category before including EC for diagnosing HCC were 78.9% (165/209; 95% CI, 72.8-84.3) and 57.1% (16/28; 95% CI, 37.2-75.5), respectively (Table 3). After including EC, the sensitivity and specificity of the LR-5 category for diagnosing HCC were the same, 78.9% (165/209; 95% CI, 72.8-84.3) and 57.1% (16/28; 95% CI, 37.2-75.5), respectively. With EC, the PPV, NPV, and accuracy were 93.3% (166/178; 95% CI, 89.9-95.5), 26.7% (16/60; 95% CI, 19.4-35.5), and 76.4% (181/237; 95% CI, 70.4-81.6), respectively. Similarly, the PPV for the LR-4 category was 100.0% (21/21; 95% CI, 61.9-100.0). There was no significant difference in sensitivity or specificity before and after including EC.
After excluding observations of LR-TIV without a parenchymal mass, LR-M without nonrim APHE, or observations <10 mm in diameter, the distribution of observations according to the major imaging features on CT and HBA-MRI is presented in Tables 4 and 5, respectively. Among the 177 observations with nonrim APHE and nonperipheral washout on CT, the PPVs of the LR-5 category for HCC detection with and without EC were 94.1% (80/85; 95% CI, 74.6-100.0) and 94.6% (87/92; 95% CI, 75.7-100.0), respectively (difference, -0.5%; P=0.886) (Table 4). In the subgroup of eight observations without nonperipheral washout on CT, only one patient displayed EC and was pathologically confirmed to have HCC. Conversely, of the remaining seven cases without EC, five were pathologically confirmed as HCCs. When EC were present, the PPV for HCC detection in LR-5 and LR-4 was 100.0% (1/1; 95% CI, 2.5-100.0). Conversely, for observations without EC classified as LR-4 or LR-3, the PPV was 71.4% (5/7; 95% CI, 23.2-100.0). The difference in PPV between observations with and without EC was not statistically significant (difference, 28.6%; P=0.563) (Table 4). Furthermore, the subgroup analyses (Supplementary Table 3) indicated that the PPV of the LR-5 category for HCC detection did not vary significantly with tumor size.
Among the 175 observations with nonperipheral washout on HBA-MRI, the PPVs of the LR-5 category for HCC detection were 95.6% (87/91; 95% CI, 76.6-100.0) for observations with EC and 90.5% (76/84; 95% CI, 71.3-100.0) for observations without EC (difference, 5.1%; P=0.183) (Table 5). Among the 11 observations without nonperipheral washout on HBA-MRI, only one showed EC, which was confirmed as HCC. The other 10 observations lacked EC, but were confirmed as HCCs. Among these observations, the PPVs of LR-5 or LR-4 with EC and LR-4 or LR-3 without EC for the detection of HCC were 100.0% (1/1; 95% CI, 2.5-100.0) and 100.0% (10/10; 95% CI, 48.0-100.0), respectively (difference, 0%; P-value not obtainable) (Table 5). Subgroup analyses revealed that among observations sized 10-19 mm, the PPV of the LR-5 category for HCC detection was higher when EC was present, rather than when absent (100% [18/18] vs. 76.2% [16/21]; difference, 23.8%; P=0.029) (Supplementary Table 4). Among the five non-HCCs without EC, three were cHCC-CCAs with high hepatocellular differentiation (70-95%). The distribution of these observations, according to the presence or absence of nonperipheral washout and EC, demonstrated that the number of observations showing EC, but not nonperipheral washout, was only one for both CT and HBA-MRI (0.5% [1/185] and 0.5% [1/186]), respectively (Supplementary Table 5).

Diagnostic performance of 2022 KLCA-NCC guidelines for HCC diagnosis

The sensitivity, specificity, PPV, NPV, and accuracy of HCC diagnosis, according to the KLCA-NCC guidelines on CT, were 80.4% (168/209; 95% CI, 68.7-93.5), 64.3% (18/28; 95% CI, 38.1-100.0), 94.4% (168/178; 95% CI, 80.7-100.0), 30.5% (18/59; 95% CI, 18.1-48.2), and 78.5% (186/237; 95% CI, 67.6-90.6), respectively. There was no significant difference in sensitivity (difference, -0.5%; 95% CI, -1.4 to 0.5; P>0.999) or specificity (difference, 0.0%; 95% CI and P-value not calculated for both) as compared with LI-RADS. Further details are provided in the Supplementary Material 1 (Supplementary Table 6).
The sensitivity, specificity, PPV, NPV, and accuracy of definite HCC on HBA-MRI, according to the KLCA-NCC guidelines, were 78.9% (165/209; 95% CI, 67.4-92.0), 57.1% (16/28; 95% CI, 32.7-92.8), 93.2% (165/177; 95% CI, 79.5-100.0), 26.7% (16/60; 95% CI, 15.2-43.3), and 76.4% (181/237; 95% CI, 65.7-88.3), respectively. There was no difference in sensitivity or specificity as compared to the LI-RADS (difference, 0.0%; 95% CI and P-value were not calculated for both). Further details are provided in the Supplementary Material 1 (Supplementary Table 6).
Furthermore, we assessed the diagnostic performance of the KLCA-NCC guidelines and LI-RADS for detecting HCC, particularly when cHCC-CCAs had a high degree of differentiation (>50%). The sensitivity and specificity of the 12 cHCC-CCAs, when considered HCCs, were 79.2% (175/221; 95% CI, 73.2-84.3) and 81.3% (13/16; 95% CI, 54.4-96.0), respectively for both KLCA-NCC guidelines and LI-RADS with CT. On HBA-MRI, sensitivity and specificity were 78.3% (173/221; 95% CI, 72.3-83.5) and 75.0% (12/16; 95% CI, 47.6-92.7), respectively, for both KLCA-NCC guidelines and LI-RADS. Further details are provided in the Supplementary Material 1 (Supplementary Table 7).

DISCUSSION

This study assessed the diagnostic value of EC for HCC by using the LI-RADS v2018 in a cohort of 237 patients with hepatic tumors. Our findings highlight a significant challenge, that is, a notably poor interobserver agreement for EC across CT and HBA-MRI (κ-values, 0.169 and 0.138, respectively). This poor agreement raises serious concerns regarding the reliability of EC as a diagnostic marker for HCC imaging. This finding aligns with the more conservative stances of the EASL and KLCA-NCC guidelines, which do not recognize EC or relegate them to ancillary roles.
Our findings attempted to assess the role of EC in HCC diagnosis accuracy. The presence or absence of EC did not significantly influence the PPV for HCC detection among the LR-5 observations with nonperipheral washout on CT (94.1% vs. 94.6%, P=0.886) or HBA-MRI (95.7% vs. 90.6%, P=0.178). Additionally, the interobserver agreement for EC detection was notably lower (κ=0.169 and 0.138, respectively) than the agreement rates reported in prior studies (κ range, 0.64-0.85).10-13 Consistent with previous findings, EC demonstrated poorer interobserver agreement than other LI-RADS major features, including nonrim APHE (κ=0.535 and 0.503 with CT and HBA-MRI, respectively) or nonperipheral washout (κ=0.307 and 0.374 with CT and HBA-MRI, respectively).10-13 The reason for the lower interobserver agreement for EC than the previously documented range of 0.64-0.85 remains speculative,10-13 however, the relatively inhomogeneous level of expertise among the readers in our study may have contributed to this outcome.
Hence, our results align with but also diverge from those of previous reports and clinical guidelines. Our findings suggest that the ambiguous role of EC supports the positions of the KLCA-NCC and EASL guidelines that de-emphasize and entirely omit EC from their criteria, respectively. However, this is inconsistent with a recent study that reported an increase in LI-RADS sensitivity for HCC with the inclusion of EC, especially in smaller lesions (≤3.0 cm).20 Such discrepancies might be attributable to variations in the distribution of EC and nonperipheral washout across different studies, or differences in imaging analysis methodologies.21 Nonetheless, the relative significance of EC seems potentially limited, especially considering its reduced sensitivity for HCC diagnosis (48-52%) as compared with nonrim APHE (85-91%) or nonperipheral washout(77-79%).8,22 This was further complicated in the subgroup analyses, where most non-HCC lesions, including those sized 10-19 mm which compromised the PPV of HCC without EC, were cHCC-CCAs with high hepatocellular differentiation. This factor affects their differentiation from HCCs on imaging.
Our data indicated that the sensitivity and specificity of ECs for detecting FC were modest. Notably, HBA-MRI demonstrated a marginally better performance than CT in detecting EC. This finding remains intriguing, considering that CT was expected to detect FC more effectively than HBA-MRI. This observation may be based on the behavior of fibrotic tissue, which typically exhibits progressive enhancement owing to the accumulation of extracellular CT contrast agents in the interstitial spaces. Conversely, the progressive enhancement of the hepatic parenchyma by the uptake of hepatobiliary agents on HBA-MRI can reduce the capsule-to-liver signal ratio, potentially impeding the detection of FC.23,24 However, there are conflicting reports on the comparative diagnostic performances of CT and HBA-MRI for FC detection.25-28 Thus, further studies are required to compare the diagnostic efficacies of CT and HBA-MRI in detecting FC.
Our results showed no significant differences in sensitivity, specificity, PPV, NPV, or accuracy when comparing the diagnostic performances of the LI-RADS and KLCA-NCC guidelines in HCC detection. This suggests that the LI-RADS and KLCA-NCC guidelines are comparable in their ability to detect HCC, regardless of the varying roles of EC. Notably, our findings revealed a lower specificity for HCC detection when using both guidelines as compared to previous studies: 64.3% and 57.1% with CT and HBA-MRI, respectively, in contrast to the previously reported 91.0-95.4% and 86.2-94.7% for LI-RADS and KLCA-NCC, respectively.29-32 This reduced specificity in our study primarily resulted from the misclassification of cHCC-CCA as HCC when using both CT and HBA-MRI. The proportion of cHCC-CCAs in our study (7.2%) was consistent with that in previous studies (5.4-7.7%), thereby suggesting that the cHCC-CCA cases in our cohort may have exhibited imaging characteristics more closely resembling HCC than those in a previous report.33 Most cHCC-CCA cases were misclassified as definitive HCC according to the LI-RADS and KLCA-NCC guidelines, thereby demonstrating high hepatocellular differentiation (60-95%). Re-classification of cHCC-CCAs with predominant hepatocellular differentiation (>50%) as HCCs increased the specificity of both the KLCA-NCC guidelines and LI-RADS to 81.3% and 75.0% on CT and HBA-MRI, respectively. It is also pertinent to note that cHCC-CCAs mimicking HCC on imaging have a prognosis similar to HCC.34 However, the limitations of comparing the pathological compositions of cHCC-CCAs in previous studies have precluded definitive conclusions.29-32
This study had some limitations. First, the retrospective inclusion of patients who underwent liver resection or transplantation may have introduced selection bias, potentially affecting the generalizability of our findings. Second, the sample size was small, particularly for non-HCC patients, which might have limited the statistical power of the analyses. Third, the use of a consensus reading for the results of the three radiologists with low interobserver agreement may have undermined the confidence of the results. Finally, we did not evaluate other ancillary features that may affect the categorization of the LI-RADS or the diagnostic performance of HCC detection.
In conclusion, our study demonstrated poor interobserver agreement for EC assessment using CT and HBA-MRI. Furthermore, the presence or absence of EC did not significantly affect the PPV for detecting HCC in the LR-5 observations with nonrim APHE and nonperipheral washout. Future studies should investigate the role of other ancillary features in the diagnosis of HCC and evaluate the performance of various imaging-based guidelines for HCC detection.

ACKNOWLEDGMENTS

This study was supported by the National Research Foundation of Korea (NRF) grant by the Korean government (Ministry of Science and ICT) (No. 2022R1C1C1009243). However, the data were completely under the control of the authors.

Notes

Conflicts of Interest

The authors declare that they have no potential conflicts of interest to disclose.

Ethics Statement

This retrospective study was approved by the Institutional Review Board of the Seoul National University Hospital (IRB No. H-2203-168-1310), and the requirement for informed consent was waived.

Funding Statement

This study was financially supported by the Korean Liver Cancer Association Research Award (2023). However, the data were completely under the control of the authors.

Data Availability

The data presented in this study are available upon reasonable request from the corresponding author.

Author Contributions

Conceptualization: JSB, JML

Data curation: JSB

Formal analysis: JSB

Funding acquisition: JSB

Investigation: BYH, JY, SJP

Methodology: JSB, JML

Project administration: JSB, JML

Resources: JSB, JML

Software: JSB

Supervision: JML

Validation: JSB, JML

Visualization: JSB, JML

Writing - original draft: JSB, JML

Writing - review & editing: all authors

Approval of final manuscript: all authors

References

1. Llovet JM, Kelley RK, Villanueva A, Singal AG, Pikarsky E, Roayaie S, et al. Hepatocellular carcinoma. Nat Rev Dis Primers. 2021; 7:6.
crossref
2. Lee MW, Lee JM, Koh YH, Chung JW. 2022 Korean Liver Cancer Association-National Cancer Center Korea practice guidelines for local ablation therapy of hepatocellular carcinoma: what’s new? Korean J Radiol. 2023; 24:10–14.
crossref
3. Melendez-Torres J, Singal AG. Early detection of hepatocellular carcinoma: roadmap for improvement. Expert Rev Anticancer Ther. 2022; 22:621–632.
crossref
4. Kim JH, Joo I, Lee JM. Atypical appearance of hepatocellular carcinoma and its mimickers: how to solve challenging cases using gadoxetic acid-enhanced liver magnetic resonance imaging. Korean J Radiol. 2019; 20:1019–1041.
5. Park J, Lee JM, Kim TH, Yoon JH. Imaging diagnosis of hepatocellular carcinoma: future directions with special emphasis on hepatobiliary magnetic resonance imaging and contrast-enhanced ultrasound. Clin Mol Hepatol. 2022; 28:362–379.
crossref
6. Chernyak V, Fowler KJ, Kamaya A, Kielar AZ, Elsayes KM, Bashir MR, et al. Liver Imaging Reporting and Data System (LI-RADS) version 2018: imaging of hepatocellular carcinoma in at-risk patients. Radiology. 2018; 289:816–830.
crossref
7. Consul N, Sirlin CB, Chernyak V, Fetzer DT, Masch WR, Arora SS, et al. Imaging features at the periphery: hemodynamics, pathophysiology, and effect on LI-RADS categorization. Radiographics. 2021; 41:1657–1675.
crossref
8. Shin J, Lee S, Yoon JK, Chung YE, Choi JY, Park MS. LI-RADS major features on MRI for diagnosing hepatocellular carcinoma: a systematic review and meta-analysis. J Magn Reson Imaging. 2021; 54:518–525.
crossref
9. van der Pol CB, McInnes MDF, Salameh JP, Levis B, Chernyak V, Sirlin CB, et al. CT/MRI and CEUS LI-RADS major features association with hepatocellular carcinoma: individual patient data meta-analysis. Radiology. 2022; 302:326–335.
10. Razek AAKA, El-Serougy LG, Saleh GA, El-Wahab RA, Shabana W. Interobserver agreement of magnetic resonance imaging of Liver Imaging Reporting and Data System version 2018. J Comput Assist Tomogr. 2020; 44:118–123.
crossref
11. Kang JH, Choi SH, Lee JS, Kim KW, Kim SY, Lee SS, et al. Inter-reader reliability of CT Liver Imaging Reporting and Data System according to imaging analysis methodology: a systematic review and meta-analysis. Eur Radiol. 2021; 31:6856–6867.
crossref
12. Kang JH, Choi SH, Lee JS, Park SH, Kim KW, Kim SY, et al. Interreader agreement of Liver Imaging Reporting and Data System on MRI: a systematic review and meta-analysis. J Magn Reson Imaging. 2020; 52:795–804.
crossref
13. Rimola J, Sapena V, Brancatelli G, Darnell A, Forzenigo L, MähringerKunz A, et al. Reliability of extracellular contrast versus gadoxetic acid in assessing small liver lesions using Liver Imaging Reporting and Data System v.2018 and European Association for the Study of the Liver criteria. Hepatology. 2022; 76:1318–1328.
crossref
14. European Association for the Study of the Liver. EASL clinical practice guidelines: management of hepatocellular carcinoma. J Hepatol. 2018; 69:182–236.
15. Korean Liver Cancer Association (KLCA); National Cancer Center (NCC) Korea. 2022 KLCA-NCC Korea practice guidelines for the management of hepatocellular carcinoma. Clin Mol Hepatol. 2022; 28:583–705.
16. Korean Liver Cancer Association (KLCA); National Cancer Center (NCC) Korea. 2022 KLCA-NCC Korea practice guidelines for the management of hepatocellular carcinoma. J Liver Cancer. 2023; 23:1–120.
17. Joo I, Lee JM, Koh YH, Choi SH, Lee S, Chung JW. 2022 Korean Liver Cancer Association-National Cancer Center Korea practice guidelines for imaging diagnosis of hepatocellular carcinoma: what’s new? Korean J Radiol. 2023; 24:1–5.
18. Kang HJ, Lee JM, Jeon SK, Jang S, Park S, Joo I, et al. Intra-individual comparison of dual portal venous phases for non-invasive diagnosis of hepatocellular carcinoma at gadoxetic acid-enhanced liver MRI. Eur Radiol. 2021; 31:824–833.
crossref
19. American College of Radiology. Liver Imaging Reporting & Data System (LI-RADS®) [Internet]. Reston, VA (US): American College of Radiology;[cited 2024 Mar 8]. Available from: https://www.acr.org/ClinicalResources/Reporting-and-Data-Systems/LI-RADS.
20. Pan J, Song M, Yang L, Zhao Y, Zhu Y, Wang M, et al. The role of enhancing capsule and modified capsule appearances in LI-RADS for diagnosing HCC ≤ 3.0 cm on gadoxetate disodium-enhanced MRI. Eur Radiol. 2023; 33:5801–5811.
crossref
21. Sofue K, Sirlin CB, Allen BC, Nelson RC, Berg CL, Bashir MR. How reader perception of capsule affects interpretation of washout in hypervascular liver nodules in patients at risk for hepatocellular carcinoma. J Magn Reson Imaging. 2016; 43:1337–1345.
crossref
22. Lee S, Kim SS, Roh YH, Choi JY, Park MS, Kim MJ. Diagnostic performance of CT/MRI Liver Imaging Reporting and Data System v2017 for hepatocellular carcinoma: a systematic review and meta-analysis. Liver Int. 2020; 40:1488–1497.
crossref
23. Burgio MD, Picone D, Cabibbo G, Midiri M, Lagalla R, Brancatelli G. MRimaging features of hepatocellular carcinoma capsule appearance in cirrhotic liver: comparison of gadoxetic acid and gadobenate dimeglumine. Abdom Radiol (NY). 2016; 41:1546–1554.
24. Grazioli L, Olivetti L, Fugazzola C, Benetti A, Stanga C, Dettori E, et al. The pseudocapsule in hepatocellular carcinoma: correlation between dynamic MR imaging and pathology. Eur Radiol. 1999; 9:62–67.
crossref
25. Hope TA, Aslam R, Weinstein S, Yeh BM, Corvera CU, Monto A, et al. Change in Liver Imaging Reporting and Data System characterization of focal liver lesions using gadoxetate disodium magnetic resonance imaging compared with contrast-enhanced computed tomography. J Comput Assist Tomogr. 2017; 41:376–381.
crossref
26. Joo I, Lee JM, Lee DH, Ahn SJ, Lee ES, Han JK. Liver Imaging Reporting and Data System v2014 categorization of hepatocellular carcinoma on gadoxetic acid-enhanced MRI: comparison with multiphasic multidetector computed tomography. J Magn Reson Imaging. 2017; 45:731–740.
crossref
27. Kim B, Lee JH, Kim JK, Kim HJ, Kim YB, Lee D. The capsule appearance of hepatocellular carcinoma in gadoxetic acid-enhanced MR imaging: correlation with pathology and dynamic CT. Medicine (Baltimore). 2018; 97:e11142.
28. Kim YN, Song JS, Moon WS, Hwang HP, Kim YK. Intra-individual comparison of hepatocellular carcinoma imaging features on contrast-enhanced computed tomography, gadopentetate dimeglumine-enhanced MRI, and gadoxetic acid-enhanced MRI. Acta Radiol. 2018; 59:639–648.
29. Kim JH, Lee JY, Yu SJ, Lee DH, Joo I, Yoon JH, et al. Fusion imaging-guided radiofrequency ablation with artificial ascites or pleural effusion in patients with hepatocellular carcinomas: the feasibility rate and midterm outcome. Int J Hyperthermia. 2023; 40:2213424.
crossref
30. Lee S, Kim SS, Chang DR, Kim H, Kim MJ. Comparison of LI-RADS 2018 and KLCA-NCC 2018 for noninvasive diagnosis of hepatocellular carcinoma using magnetic resonance imaging. Clin Mol Hepatol. 2020; 26:340–351.
crossref
31. Lee SM, Lee JM, Ahn SJ, Kang HJ, Yang HK, Yoon JH. Diagnostic performance of 2018 KLCA-NCC practice guideline for hepatocellular carcinoma on gadoxetic acid-enhanced MRI in patients with chronic hepatitis B or cirrhosis: comparison with LI-RADS version 2018. Korean J Radiol. 2021; 22:1066–1076.
crossref
32. Park SH, Shim YS, Kim B, Kim SY, Kim YS, Huh J, et al. Retrospective analysis of current guidelines for hepatocellular carcinoma diagnosis on gadoxetic acid-enhanced MRI in at-risk patients. Eur Radiol. 2021; 31:4751–4763.
crossref
33. Choi SH, Jeon SK, Lee SS, Lee JM, Hur BY, Kang HJ, et al. Radiopathologic correlation of biphenotypic primary liver cancer (combined hepatocellular cholangiocarcinoma): changes in the 2019 WHO classification and impact on LI-RADS classification at liver MRI. Eur Radiol. 2021; 31:9479–9488.
34. Choi SH, Lee SS, Park SH, Kim KM, Yu E, Park Y, et al. LI-RADS classification and prognosis of primary liver cancers at gadoxetic acid-enhanced MRI. Radiology. 2019; 290:388–397.
crossref

Figure 1.
Study flow diagram. LI-RADS, Liver Imaging Reporting and Data System; CT, computed tomography; HBA-MRI, hepatobiliary agent-enhanced magnetic resonance imaging; LR-TIV, LI-RADS tumor in vein; LR-M, LI-RADS M.
jlc-2024-05-01f1.tif
Figure 2.
Representative examples of enhancing capsule. In a 54-year-old woman, compared to the arterial phase image (A), an enhancing capsule (arrowheads) is noted on the portal venous phase CT axial image (B). In a 79-year-old man, compared to the arterial phase image (C), an enhancing capsule (arrowheads) is noted on the portal venous phase MRI axial image (D). CT, computed tomography; MRI, magnetic resonance imaging.
jlc-2024-05-01f2.tif
jlc-2024-05-01f3.tif
Table 1.
Patient and lesion characteristics
Characteristic Value (n=237)
Age (years) 60 (53-65)
Sex
 Male 184
 Female 53
Serum AFP (ng/mL) 8.8 (3.1-62.0)
Child-Pugh class
 A 222 (93.7)
 B 9 (3.8)
 C 6 (2.5)
Cause of underlying liver disease
 Hepatitis B virus 218 (92.0)
 Hepatitis C virus 8 (3.4)
 Alcohol 7 (3.0)
 Others 4 (1.7)
Type of surgery
 Resection 225 (94.9)
 Transplantation 12 (5.1)
Time interval (days)
 CT and HBA-MRI 8 (1-15)
 CT and surgery 8 (2-17)
 HBA-MRI and surgery 9 (3-18)
Maximal tumor diameter on pathology (cm) 2.7 (2.0-4.5)
Fibrous capsule on pathology
 Complete/partial/absent 39 (16.5)
 Partial 108 (45.6)
 Absent 90 (38.0)
Pathologic diagnosis
 HCC 209 (88.2)
 cHCC-CCA 17 (7.2)
 Intrahepatic cholangiocarcinoma 8 (3.4)
 Others 3 (1.3)

Values are presented as median (interquartile range) or number (%).

AFP, alpha-fetoprotein; CT, computed tomography; HBA-MRI, hepatobiliary contrast agent-enhanced magnetic resonance imaging; HCC, hepatocellular carcinoma; cHCC-CCA, combined hepatocellular carcinoma and cholangiocarcinoma.

Table 2.
Diagnostic performances of enhancing capsule for fibrous capsule on pathology
Variable CT
HBA-MRI
P-value*
Value 95% CI Value 95% CI
Sensitivity 46.9% (69/147) 38.7-55.3 55.1% (81/147) 46.7-63.3 0.029
Specificity 71.1% (64/90) 60.6-80.2 73.3% (66/90) 63.0-82.1 0.815
Accuracy 56.1% (133/237) 49.5-62.5 62.0% (147/237) 55.5-68.2
Positive predictive value 72.6% (69/95) 64.8-79.3 77.1% (81/105) 69.9-83.0
Negative predictive value 45.1% (64/142) 40.2-50.1 50.0% (66/132) 44.6-55.4

CT, computed tomography; HBA-MRI, hepatobiliary contrast agent-enhanced magnetic resonance imaging; CI, confidence interval.

* Refers to the comparison between CT and HBA-MRI;

P<0.05.

Table 3.
Diagnostic performances of LI-RADS category 5 (LR-5) before and after inclusion of EC for diagnosing HCC
Diagnostic performance LR-5 before inclusion of EC
LR-5 after inclusion of EC
Difference (95% CI) P-value*
Value 95% CI Value 95% CI
CT
 Sensitivity 79.9% (167/209) 73.8-85.1 80.4% (168/209) 74.3-85.5 0.5 (-0.46 to 1.41) >0.999
 Specificity 64.3% (18/28) 44.1-81.4 64.3% (18/28) 44.1-81.4 0 Not calculated
HBA-MRI
 Sensitivity 78.9% (165/209) 72.8-84.3 78.9% (165/209) 72.8-84.3 0 Not calculated
 Specificity 57.1% (16/28) 37.2-75.5 57.1% (16/28) 37.2-75.5 0 Not calculated

LI-RADS, Liver Imaging Reporting and Data System; EC, enhancing capsule; HCC, hepatocellular carcinoma; CI, confidence interval; CT, computed tomography; HBA-MRI, hepatobiliary contrast agent-enhanced magnetic resonance imaging.

* Refers to the comparison between LR-5 before and after inclusion of EC.

Table 4.
Distribution of observations with nonrim APHE and ≥10 mm according to the major imaging features on CT (not LR-TIV, not LR-M)
Characteristic CT
Positive predictive value (%)
10-19 mm
≥20 mm
Value 95% CI Difference 95% CI P-value*
HCC Non-HCC HCC Non-HCC
Nonperipheral washout (+) (n=177) -0.5 -8.3 to 6.9 0.886
 Enhancing capsule (+) (n=85) 12 0 68 5 80 (94.1) 74.6-100.0
 Enhancing capsule (-) (n=92) 27 2 60 3 87 (94.6) 75.7-100.0
Nonperipheral washout (-) (n=8) 28.6 -53.3 to 64.1 0.563
 Enhancing capsule (+) (n=1) 0 0 1 0 1 (100.0) 2.5-100.0
 Enhancing capsule (-) (n=7) 3 2 2 0 5 (71.4) 23.2-100.0

Values are presented as number or number (%).

APHE, arterial phase hyperenhancement; CT, computed tomography; LR-TIV, LI-RADS tumor in vein; LI-RADS, Liver Imaging Reporting and Data System; LR-M, LI-RADS M; HCC, hepatocellular carcinoma; CI, confidence interval.

* Refers to the comparison between the observations with enhancing capsule and those without enhancing capsule;

Indicate the observations with LR-5 category.

Table 5.
Distribution of observations with nonrim APHE and ≥10 mm according to the major imaging features on HBA-MRI (not LR-TIV, not LR-M)
Characteristic HBA-MRI
Positive predictive value (%)
10-19 mm
≥20 mm
Value 95% CI Difference 95% CI P-value*
HCC Non-HCC HCC Non-HCC
Nonperipheral washout (+) (n=175) 5.1 -2.7 to 13.7 0.183
 Enhancing capsule (+) (n=91) 18 0 69 4 87 (95.6) 76.6-100.0
 Enhancing capsule (-) (n=84) 16 5 60 3 76 (90.5) 71.3-100.0
Nonperipheral washout (-) (n=11) 0.0 -27.8 to 79.3 Not calculated
 Enhancing capsule (+) (n=1) 1 0 0 0 1 (100.0) 2.5-100.0
 Enhancing capsule (-) (n=10) 4 0 6 0 10 (100.0) 48.0-100.0

Values are presented as number or number (%).

APHE, arterial phase hyperenhancement; HBA-MRI, hepatobiliary agent-enhanced magnetic resonance imaging; LR-TIV, LI-RADS tumor in vein; LI-RADS, Liver Imaging Reporting and Data System; LR-M, LIRADS M; HCC, hepatocellular carcinoma; CI, confidence interval.

* Refers to the comparison between the observations with enhancing capsule and those without enhancing capsule;

Indicate the observations with LR-5 category.

TOOLS
Similar articles