INTRODUCTION
METHODS
Chemicals
Animals
Experimental design
Preparation of tissue homogenate
Assessment of incidence of tumor
Histopathological analysis of the liver
Assay of cancer markers
Immunohistochemical analysis
Determination of cytokines in serum
Western blot analysis
Statistical analysis
RESULTS
Body weight and liver weight
Gross appearance and occurrence of tumors
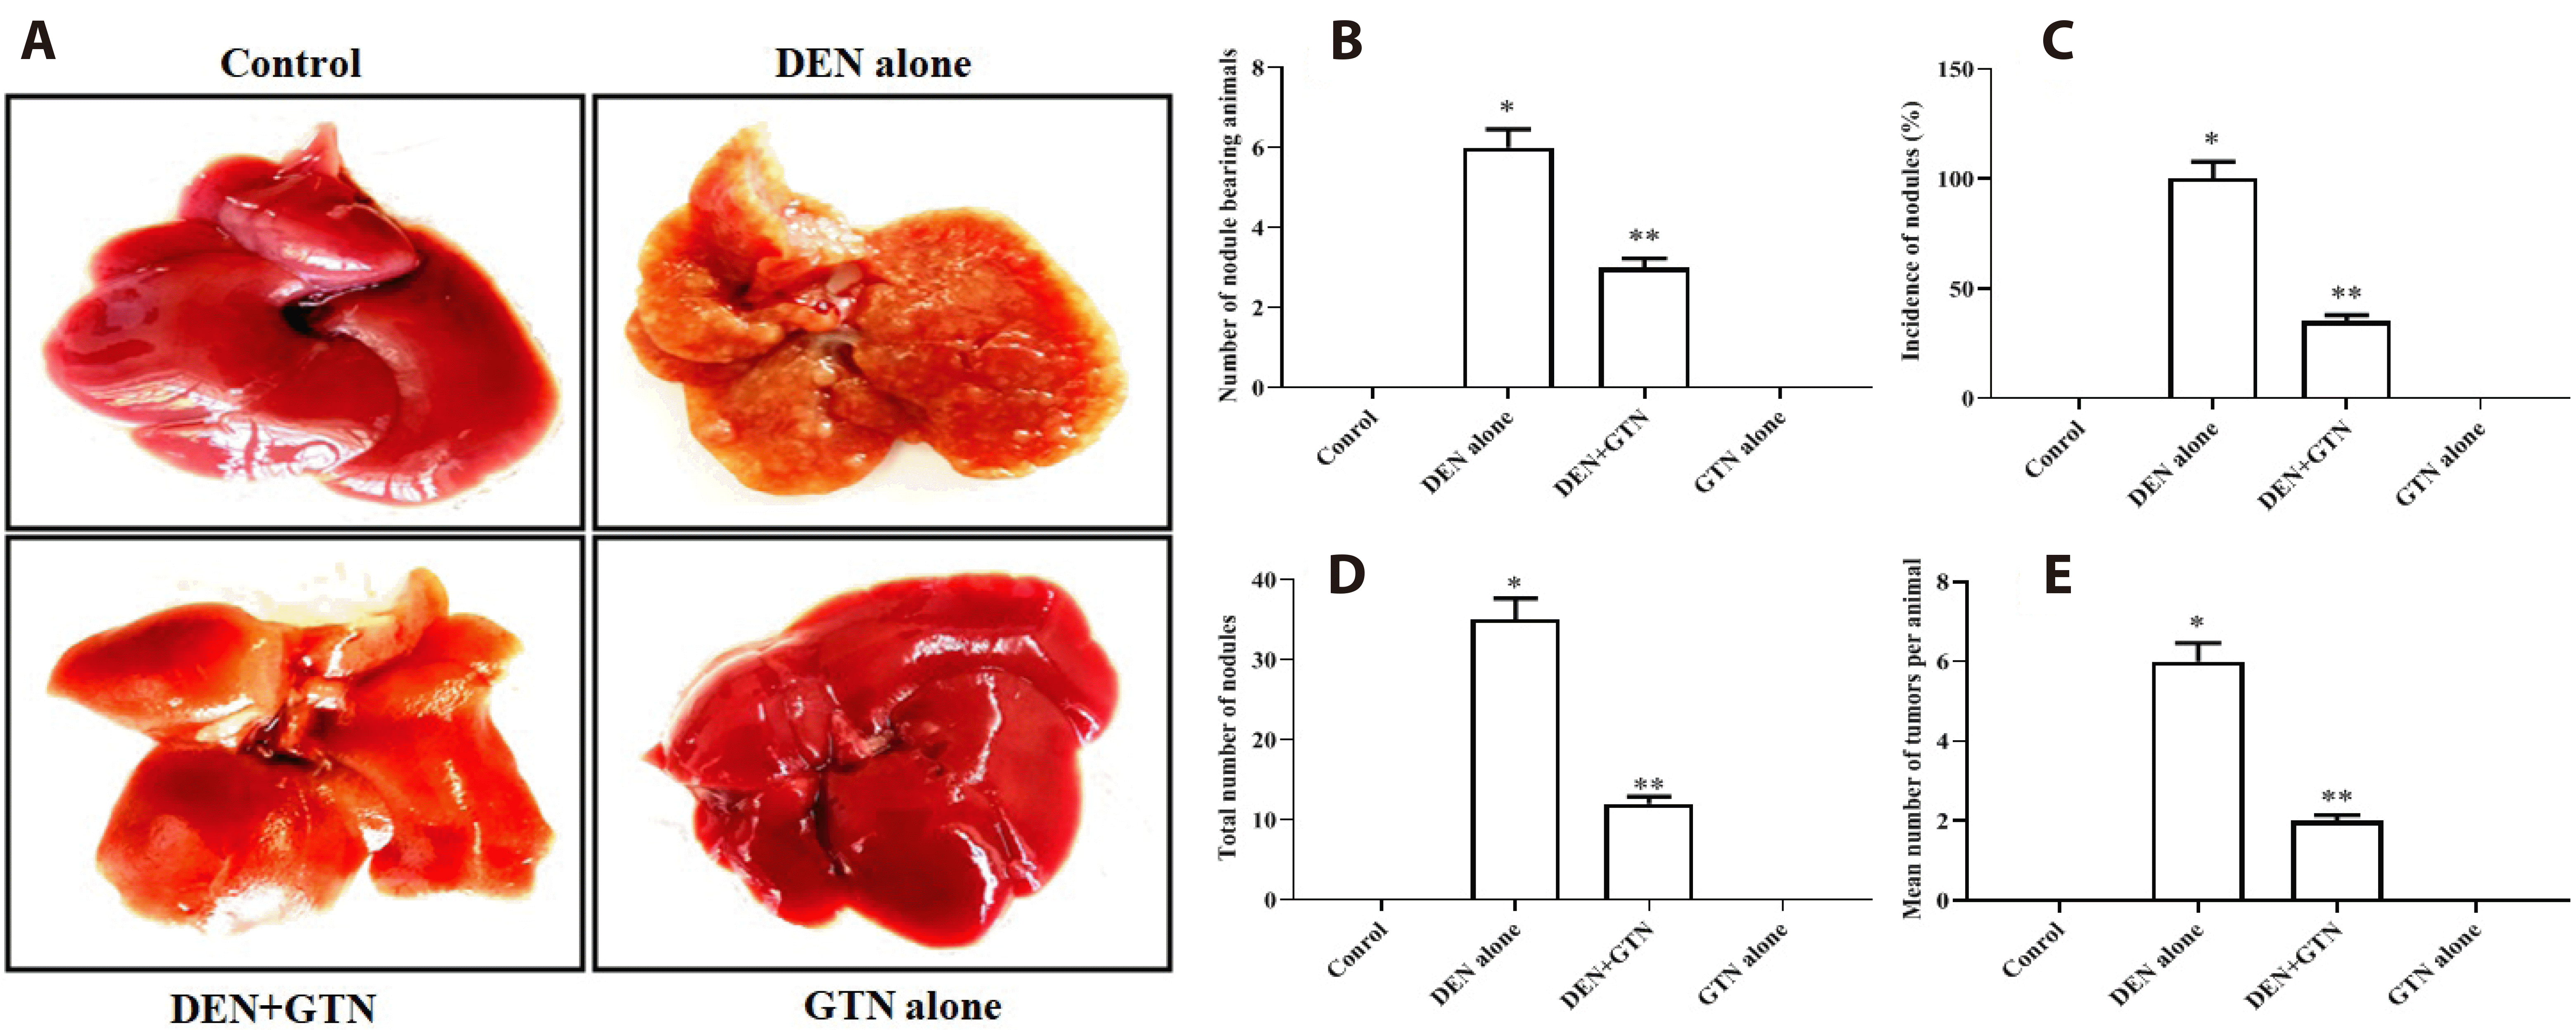 | Fig. 2Gross appearnae and tumour incidence of hepatic cancer in experiemental model.(A) Photomicrograph showing the gross appearance of liver tumor tissue at the 16th week of DEN-induced rats (n = 6). (B) Effect of GTN on the incidence of cancer nodules, number of nodule bearing animals/total number of animals. (C) Incidence of nodules (%) (incidence of nodules and number of nodules bearing rats/total number of rats in each group) × 100. (D) Total number of nodules. (E) Mean number of tumors per animal (total number of tumor/number of tumor bearing rats in each group). Data is represented as mean ± SD. At *,**p < 0.05, values that do not share a common superscript letter symbol differ statistically significant. GTN, goniothalamin; DEN, diethylnitrosamine.
|
Table 1
| Groups | No. of nodule bearing animals/total no. of animals |
Incidence of nodules (%)a |
Total number of nodules |
Mean no. of tumors per animalb |
|---|---|---|---|---|
| Group I | 0/6 | - | Nil | 0 |
| Group II | 6/6 | 100 | 35 | 6 |
| Group III | 3/6 | 35.11 | 12 | 2 |
| Group IV | 0/6 | - | Nil | 0 |
Histopathological analysis of liver
 | Fig. 3Histopathological modifications in the hepatic tissue of the control and trial rats.Control group showing normal liver histology. DEN-induced liver tissue showing nodules, vascular channels, and fat deposits. DEN + GTN treated rat liver tissue showing mild alterations. GTN treated rat showing normal histology of hepatic tissue. GTN, goniothalamin; DEN, diethylnitrosamine.
|
Liver marker enzymes in serum
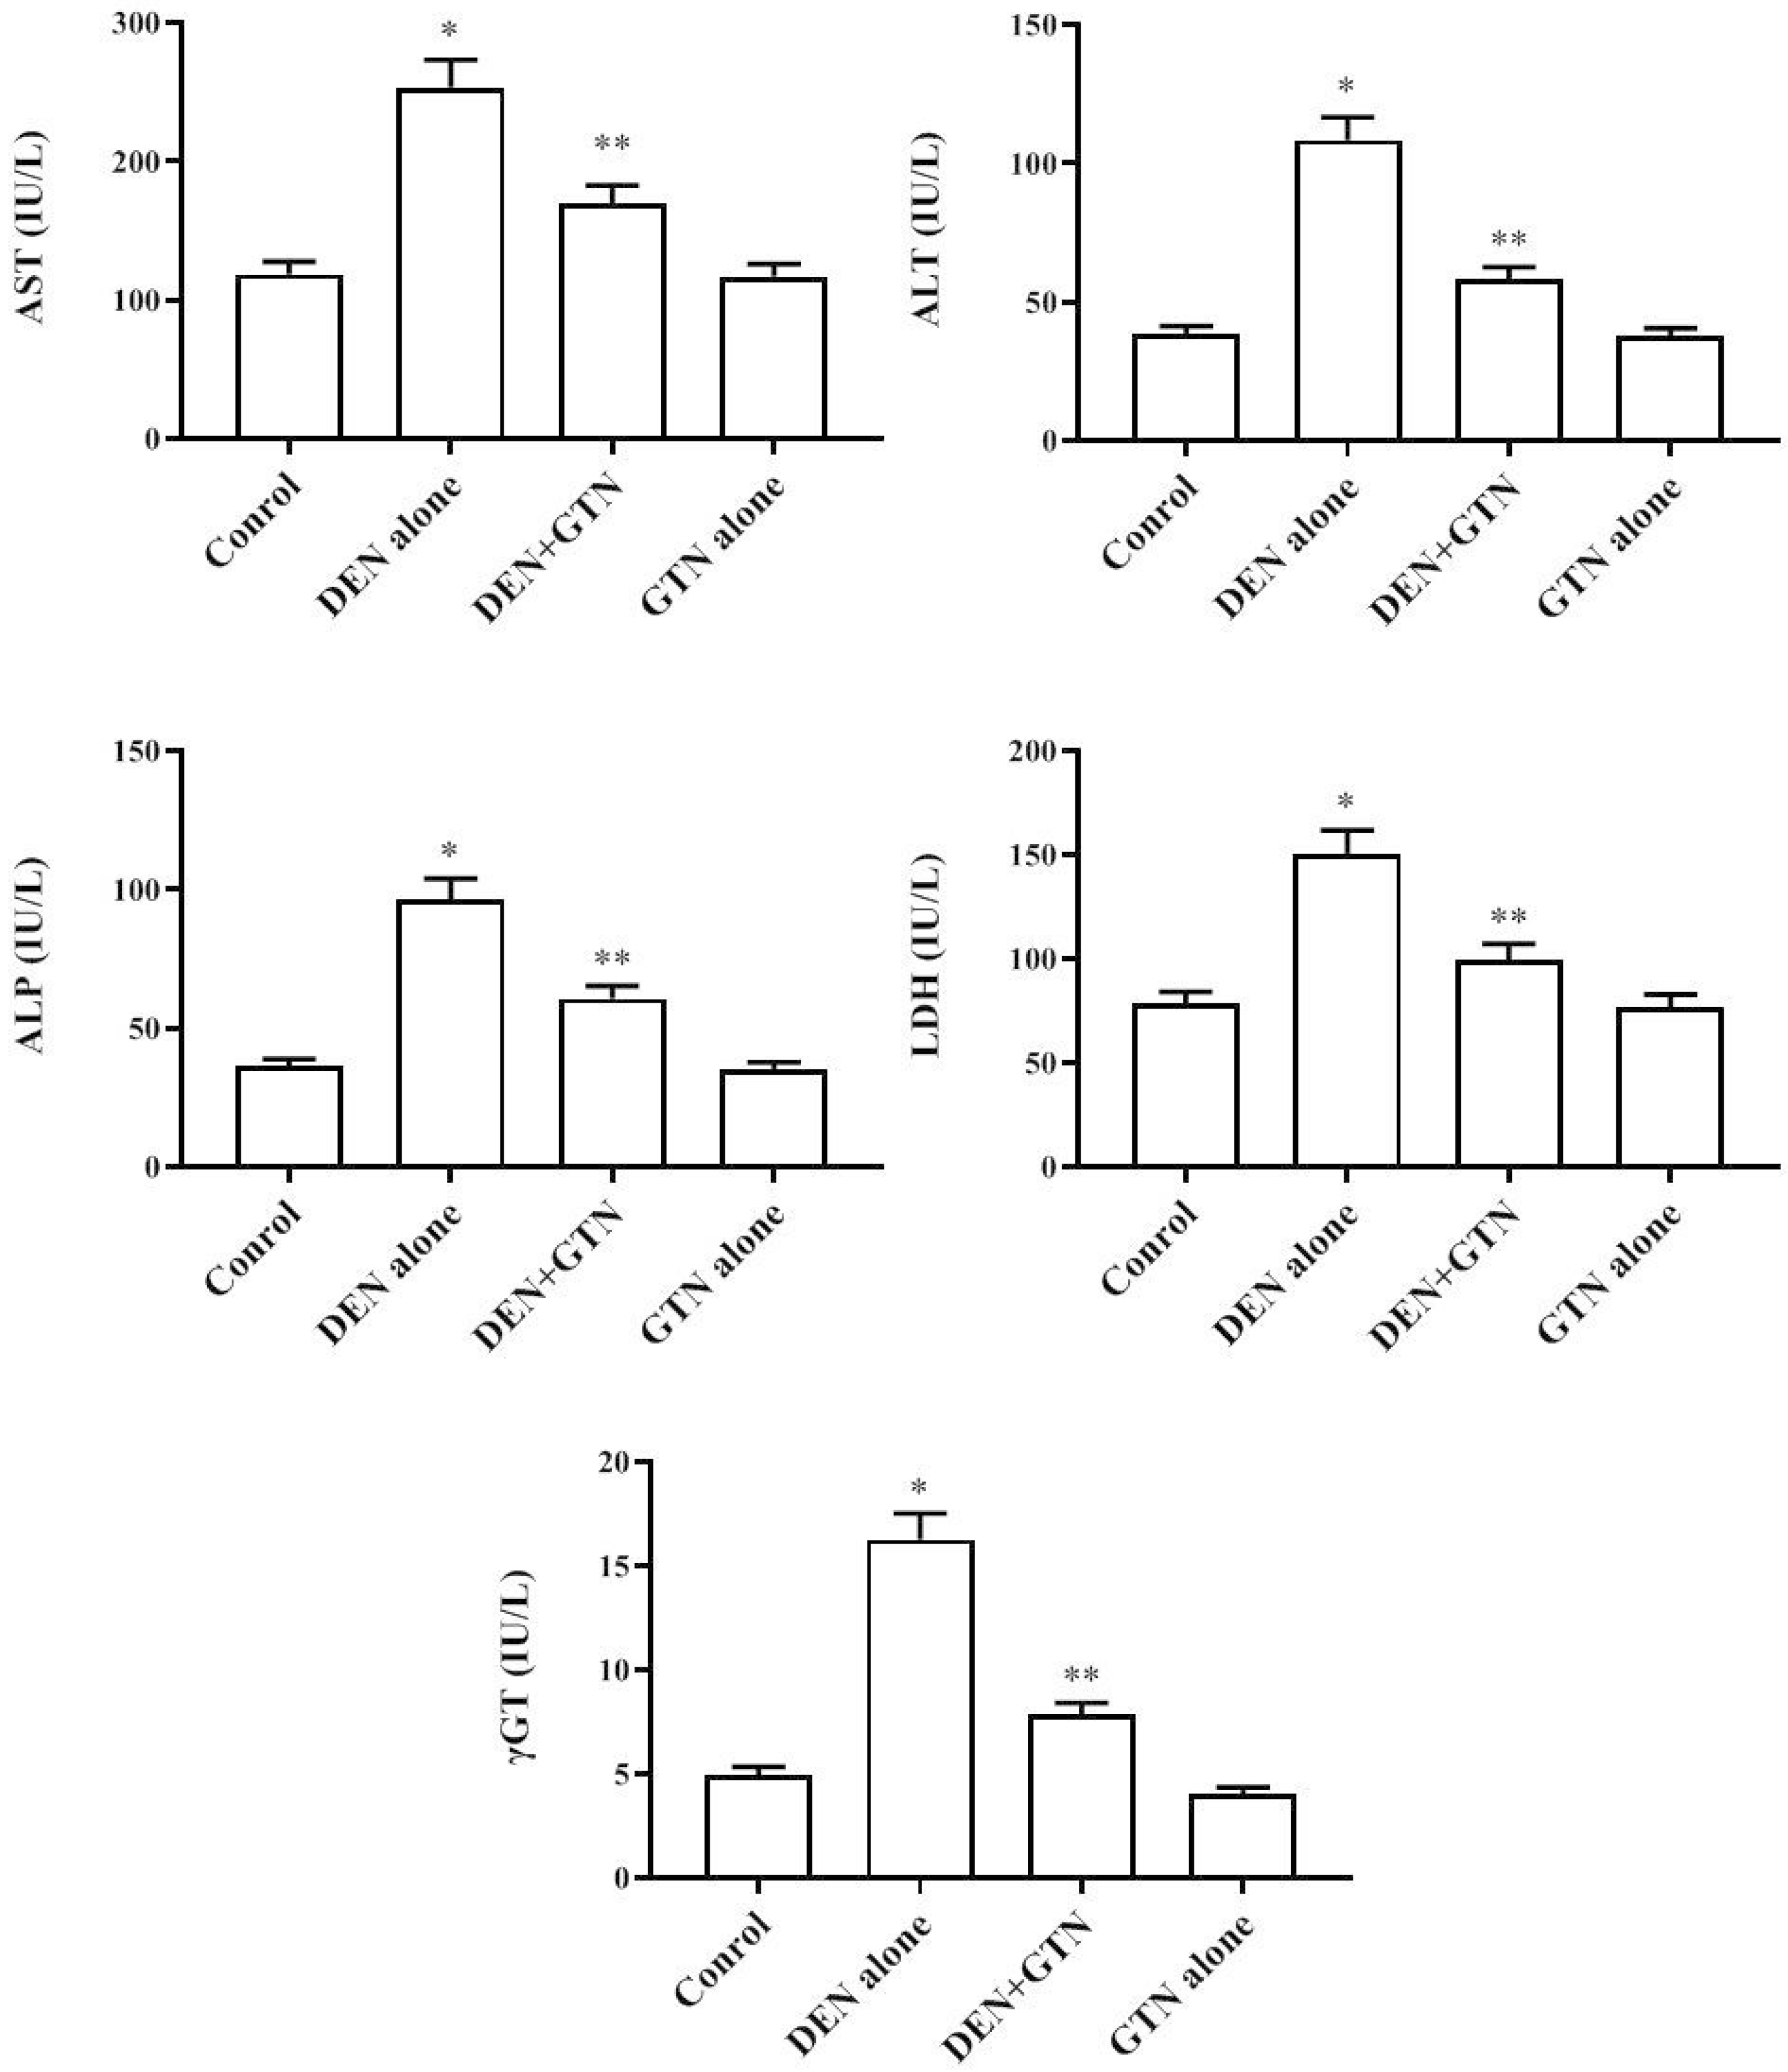 | Fig. 4Influence of GTN on liver cancer enzyme markers in serum on DEN-induced rats (n = 6).Data is represented as mean ± SD. Values not sharing common superscript letter differ significantly at *,**p < 0.05. GTN, goniothalamin; DEN, diethylnitrosamine; AST, aspartate aminotransferase; ALT, alanine aminotransferase; ALP, alkaline phosphatase; LDH, lactate dehydrogenase; γGT, gamma glutamyltranspeptidase.
|
Antioxidant enzyme activity of liver tissues
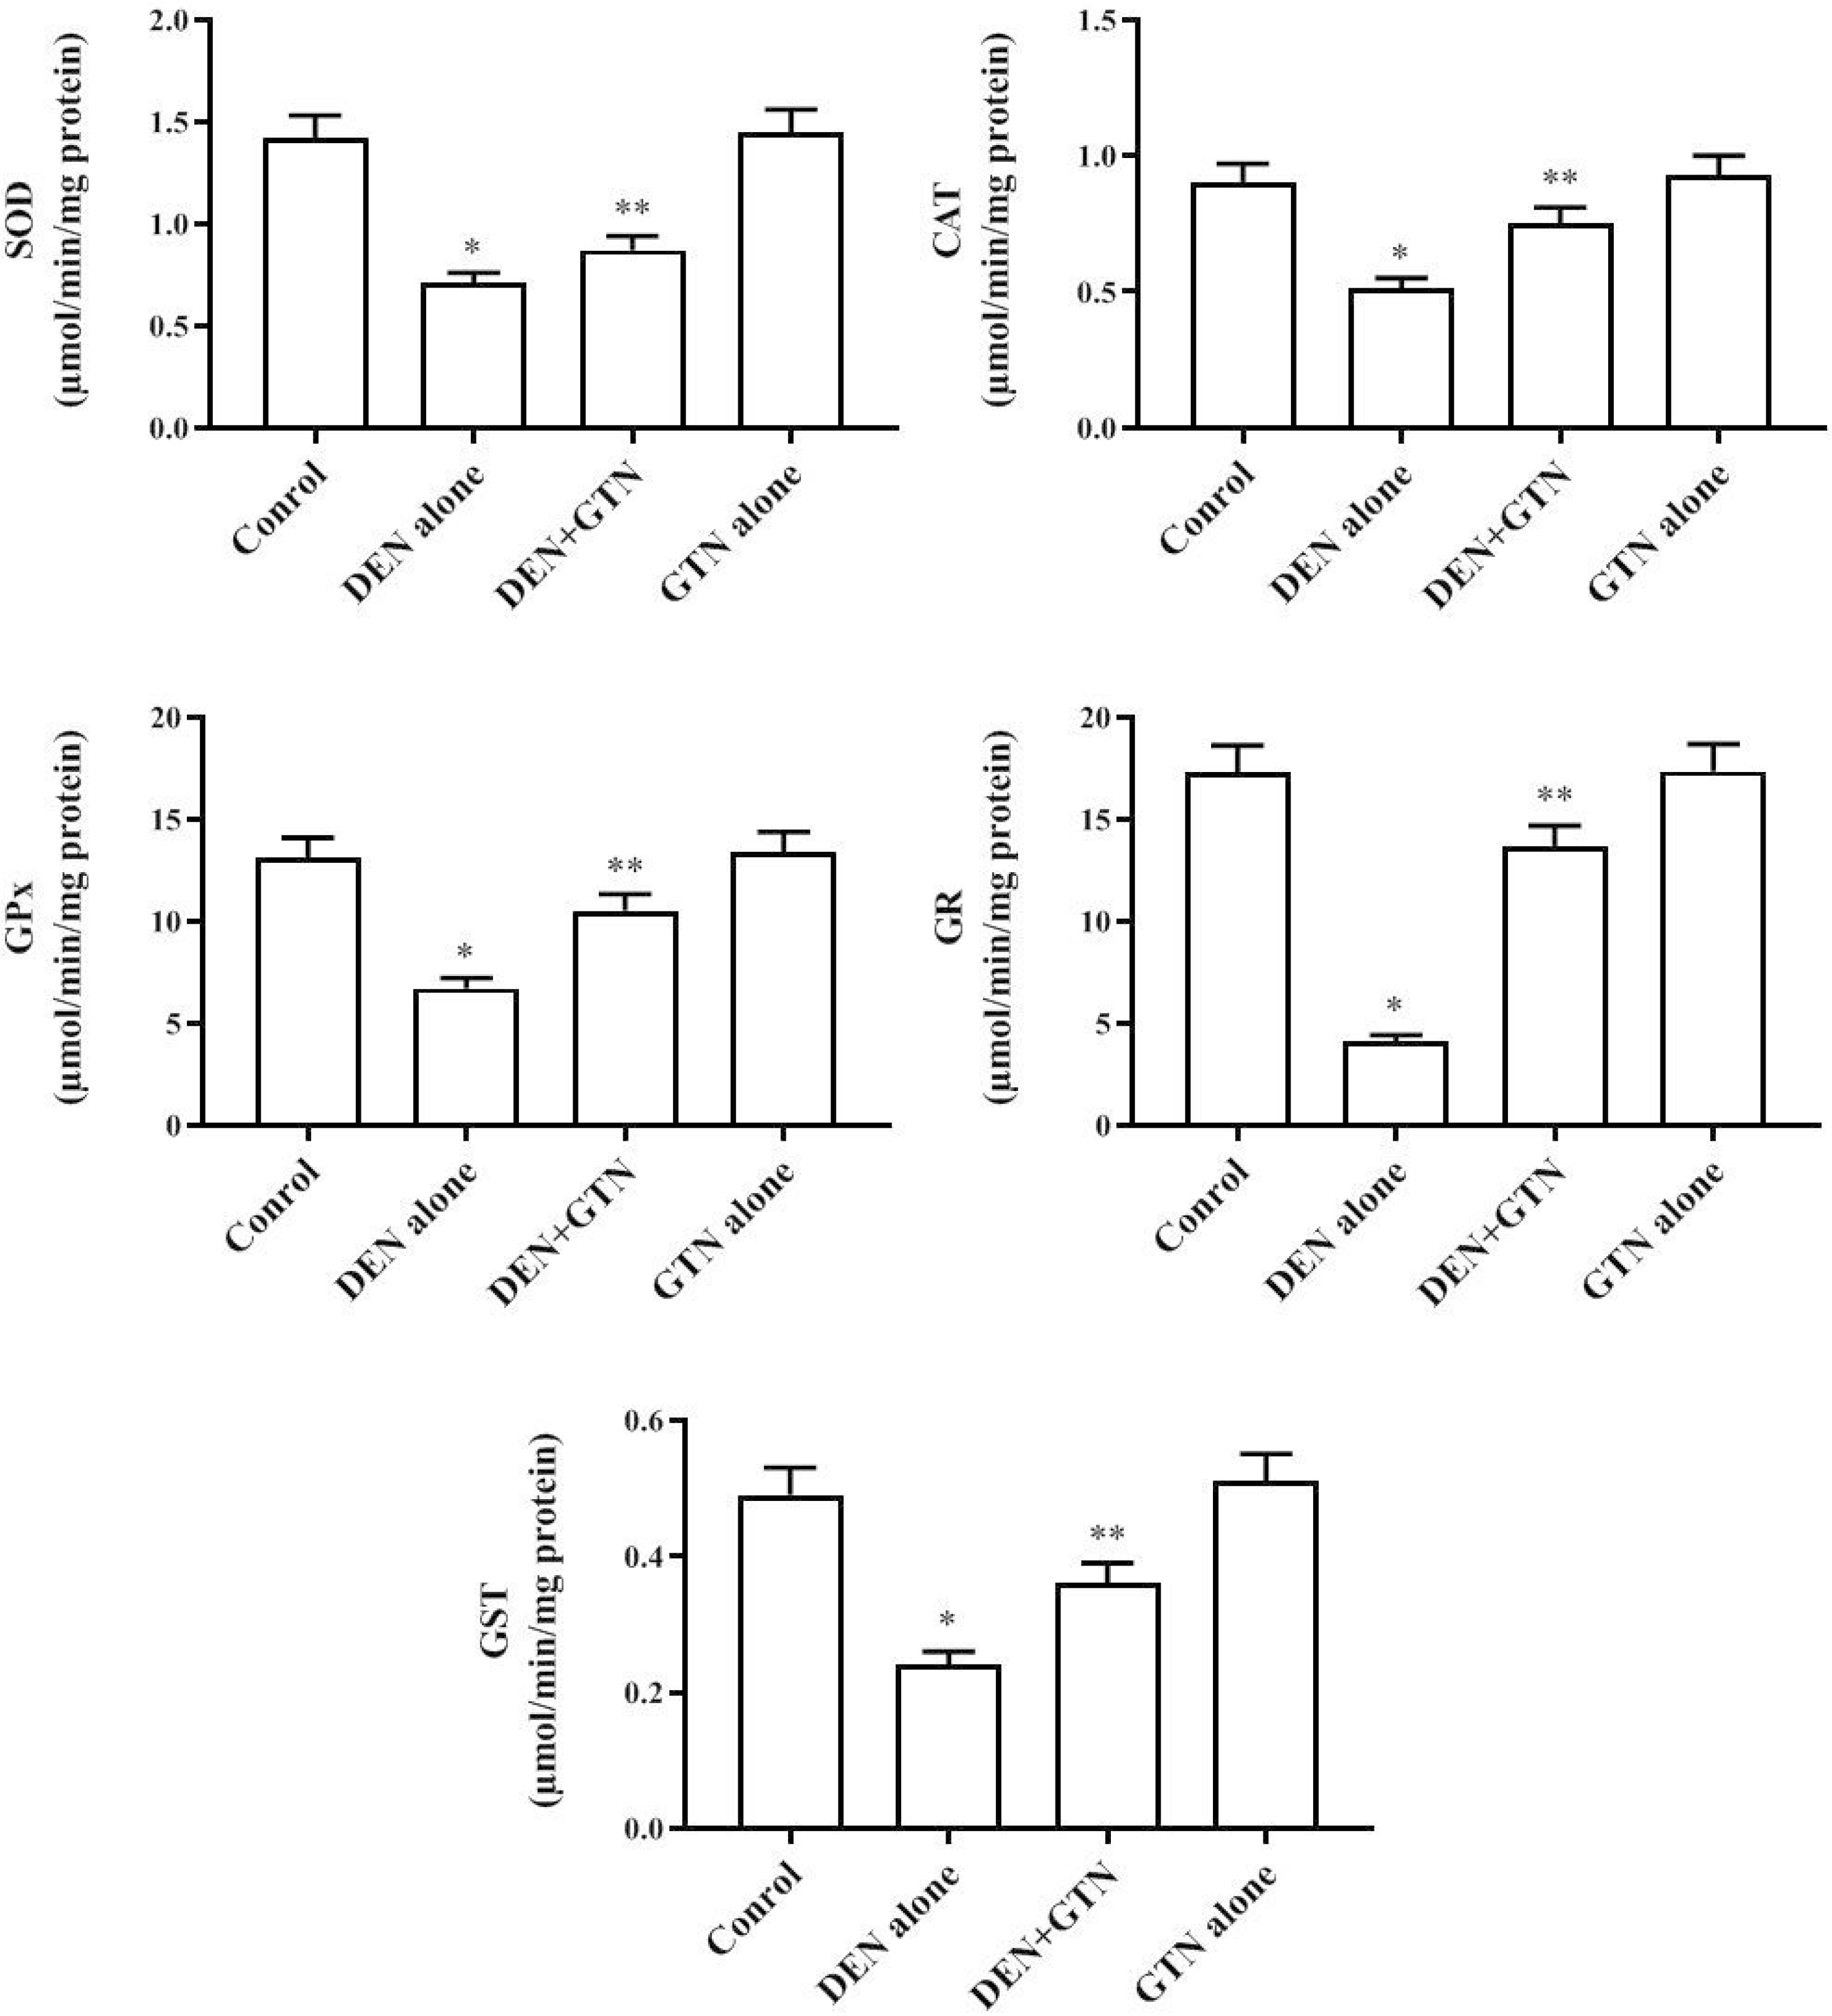 | Fig. 5Influence of GTN on anti-oxidant enzymes in liver tissues on DEN-prompted rats (n = 6).Results were depicted as mean ± SD. At *,**p < 0.05, values that do not share a common superscript letter symbol differ statistically significant. GTN, goniothalamin; DEN, diethylnitrosamine; SOD, superoxide dismutase; CAT, catalase; GPx, glutathione peroxidase; GR, glutathione reductase; GST, glutathione-S-transferase.
|
Influence of GTN on PCNA, Bcl-2 & caspase-3 expression
 | Fig. 6Immunohistochemistry (IHC) staining patterns of cell proliferation.(A) PCNA and apoptosis (B) Bcl-2, and (C) caspase-3 protein expression in the control and experimental rats (n = 6). Scale bar = 50 μm. Arrow indigates the over expression of expression markers. GTN, goniothalamin; DEN, diethylnitrosamine.
|
Measurement of pro-inflammatory cytokines
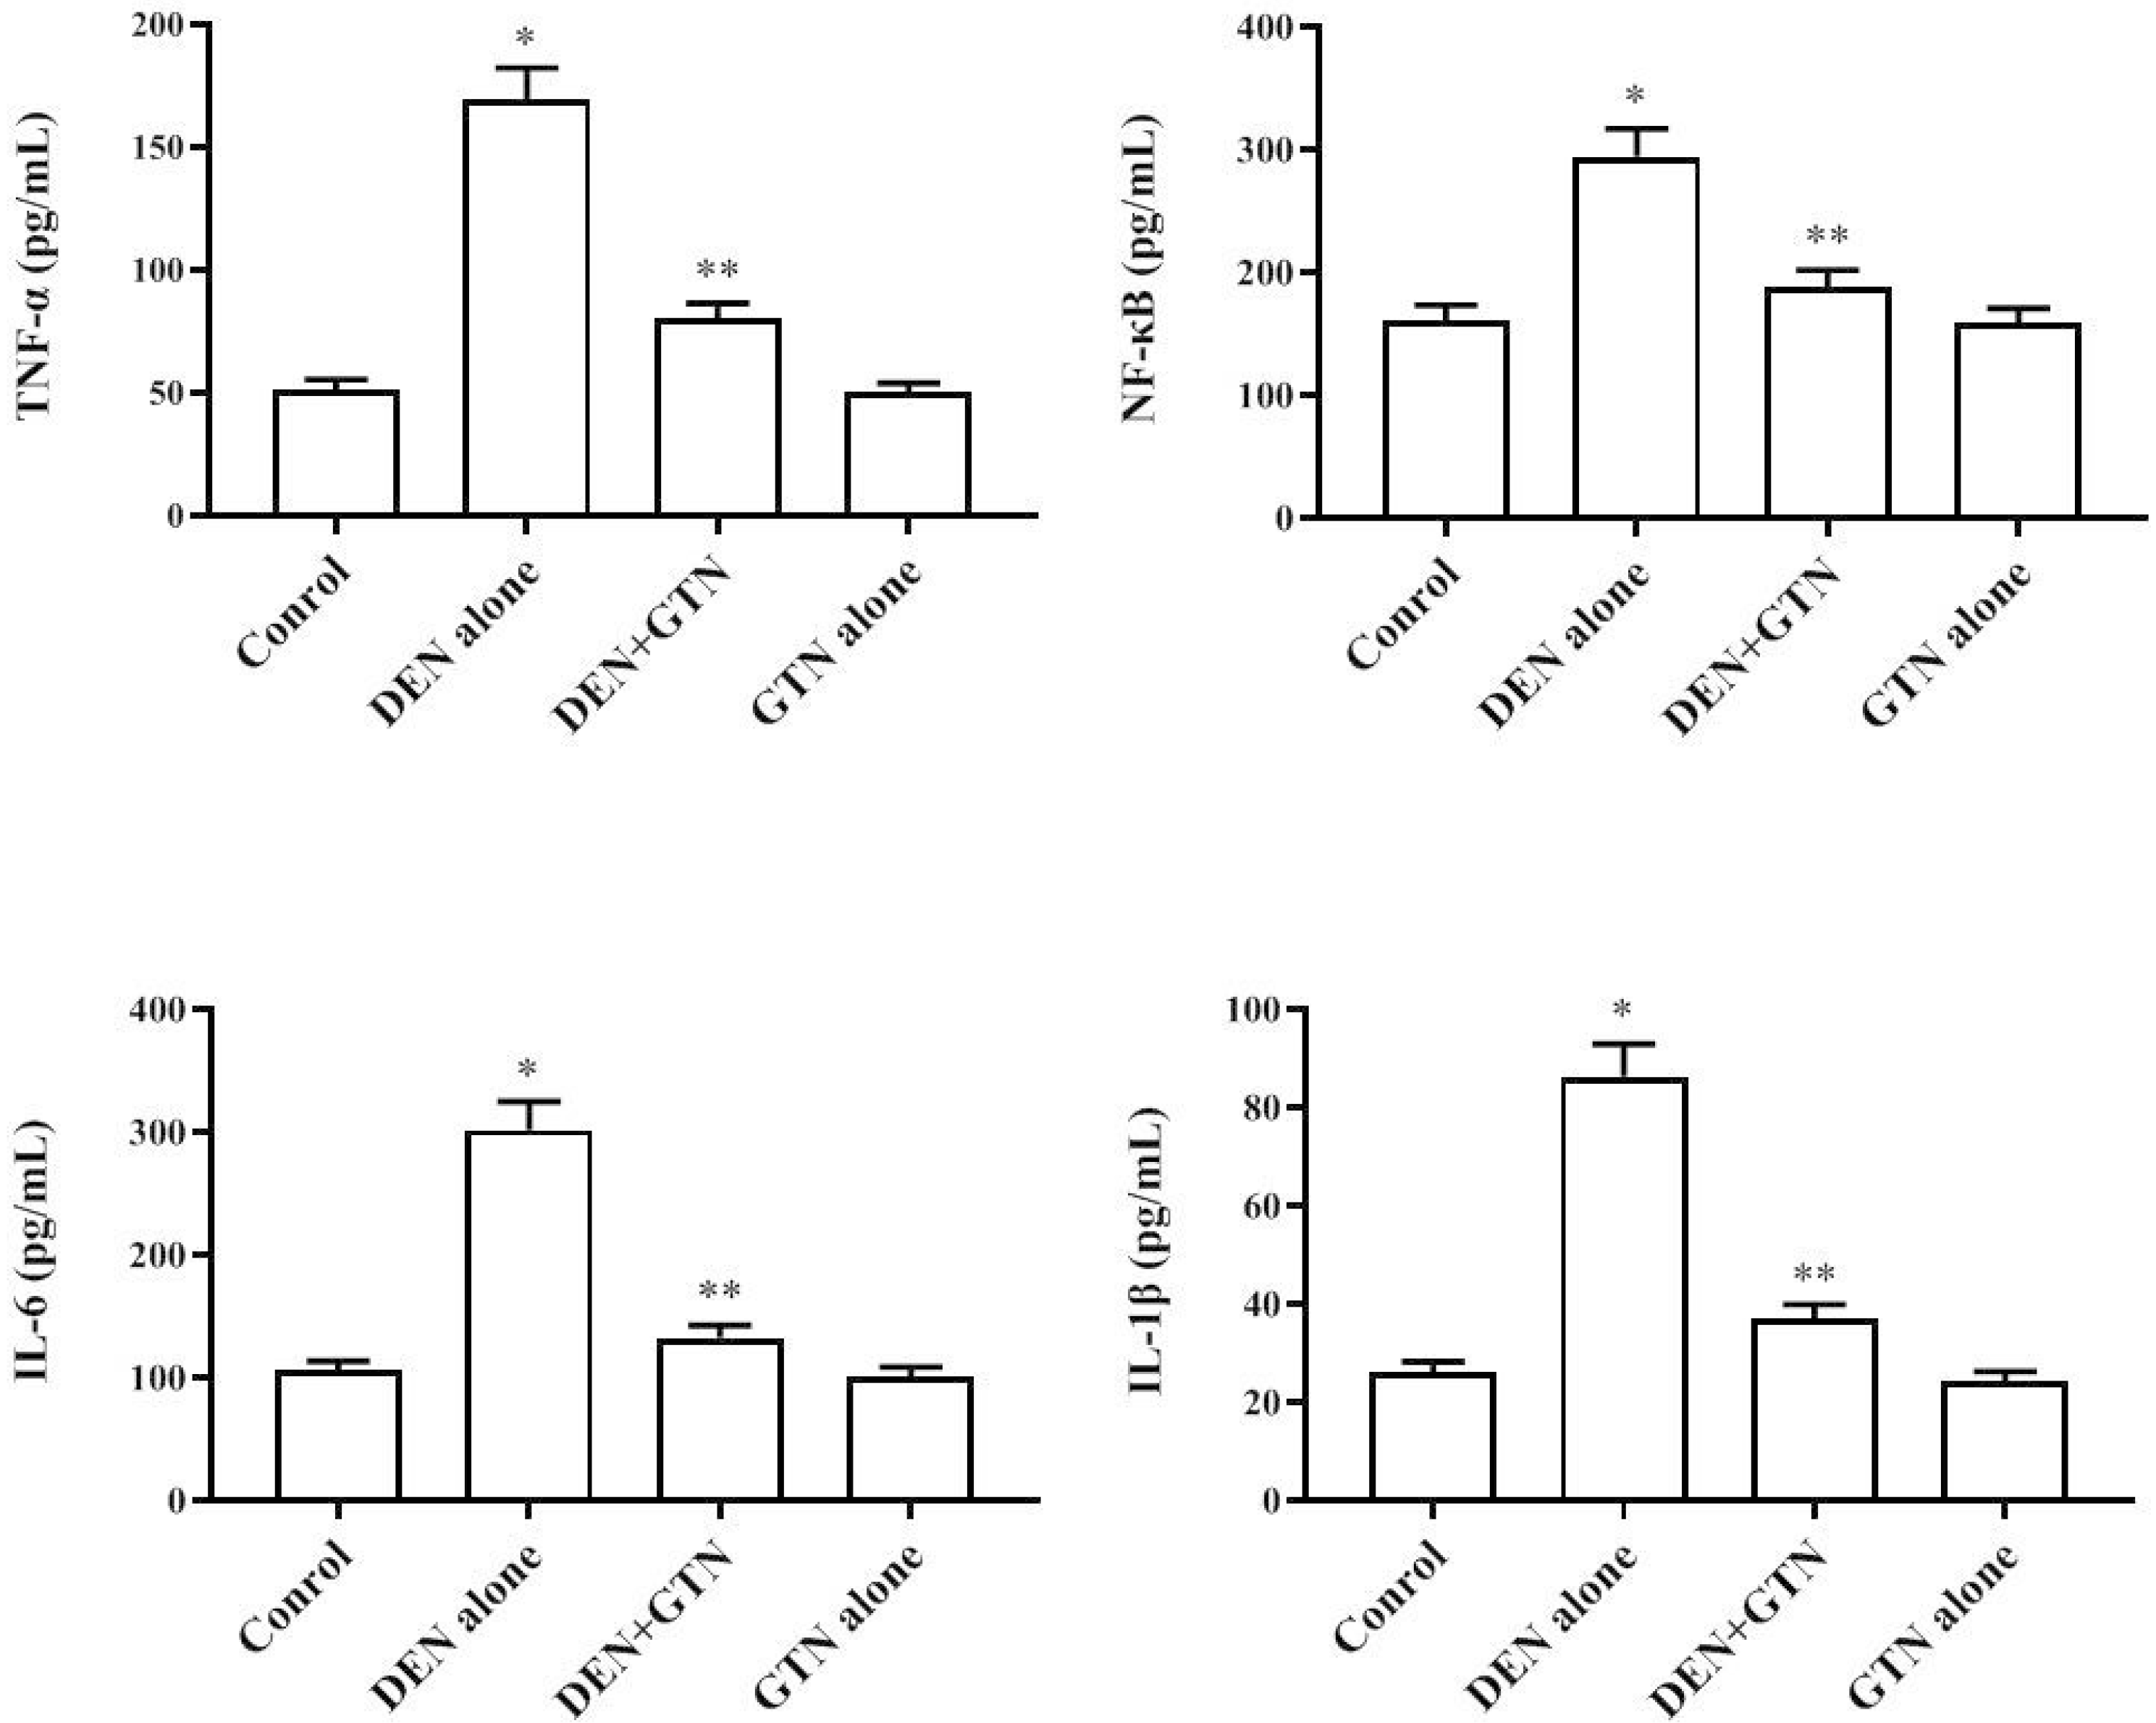 | Fig. 7Levels of cytokines in the serum control and experimental rats (n = 6).Results are displayed as mean ± SD. At *,**p < 0.05, values that do not share a common superscript letter symbol differ statistically significant. GTN, goniothalamin; DEN, diethylnitrosamine; IL, interleukin; TNF-α, tumor necrosis factor-α; NF-κB, nuclear factor-κB.
|
Effect of GTN on P13K/Akt pathway
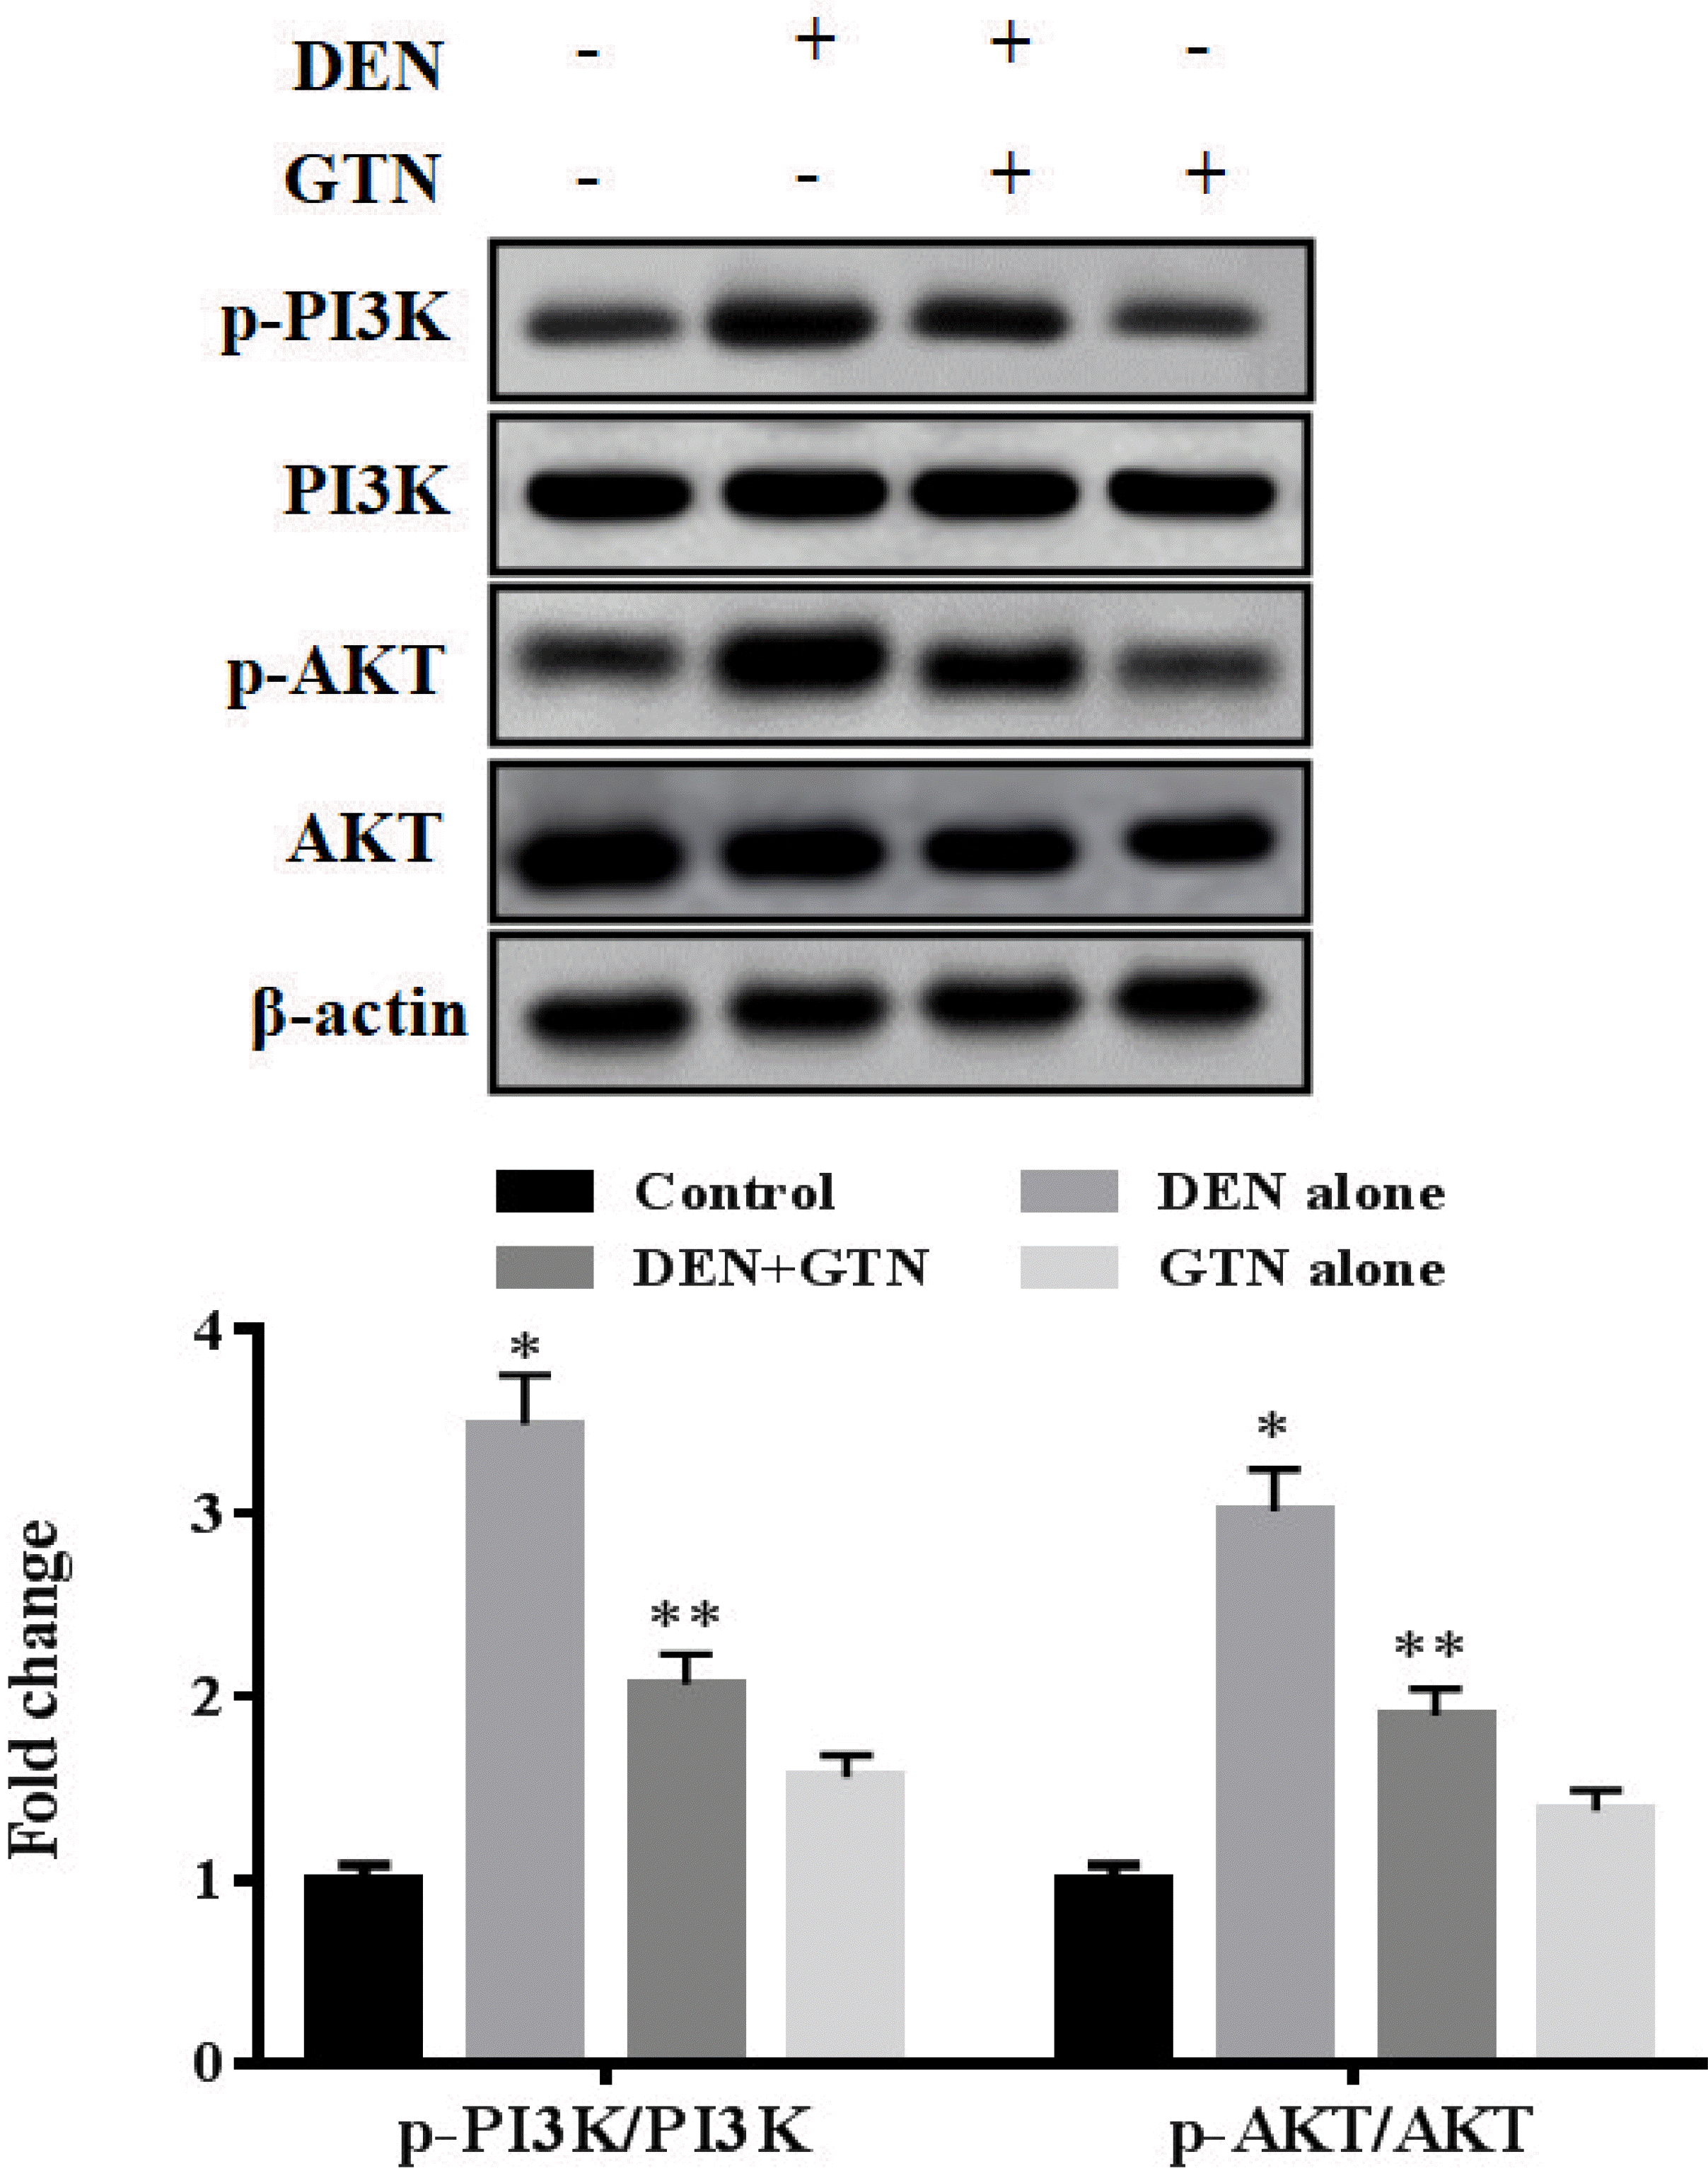 | Fig. 8Expression of PI3K, p-PI3K, AKT and p-AKT pathways in DEN-prompted HCC rats (n = 6).The concentrations of band were measured by densitometry and normalized to the β-actin internal control. Bars are expressed as mean ± SD. At *,**p < 0.05, values that do not share a common superscript letter symbol differ statistically significant. GTN, goniothalamin; DEN, diethylnitrosamine; HCC, hepatocellular carcinoma.
|


 PDF
PDF Citation
 Print
Print


 XML Download