Abstract
Background and Purpose
Methods
Results
Supplementary materials
Supplementary Results
Notes
ACKNOWLEDGMENTS
References
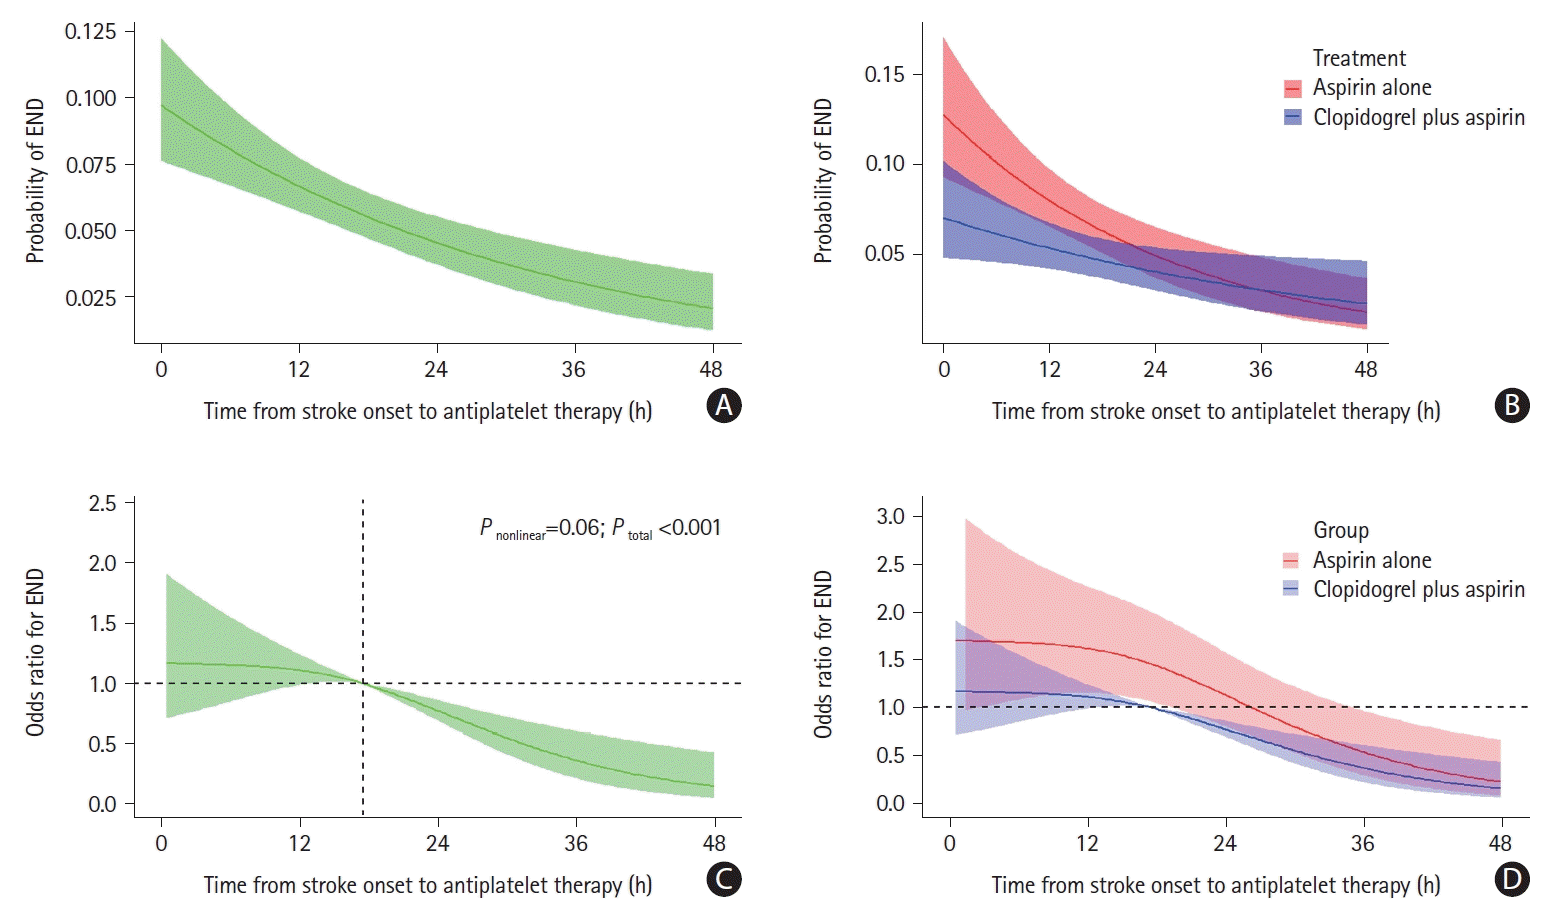
Figure 2.

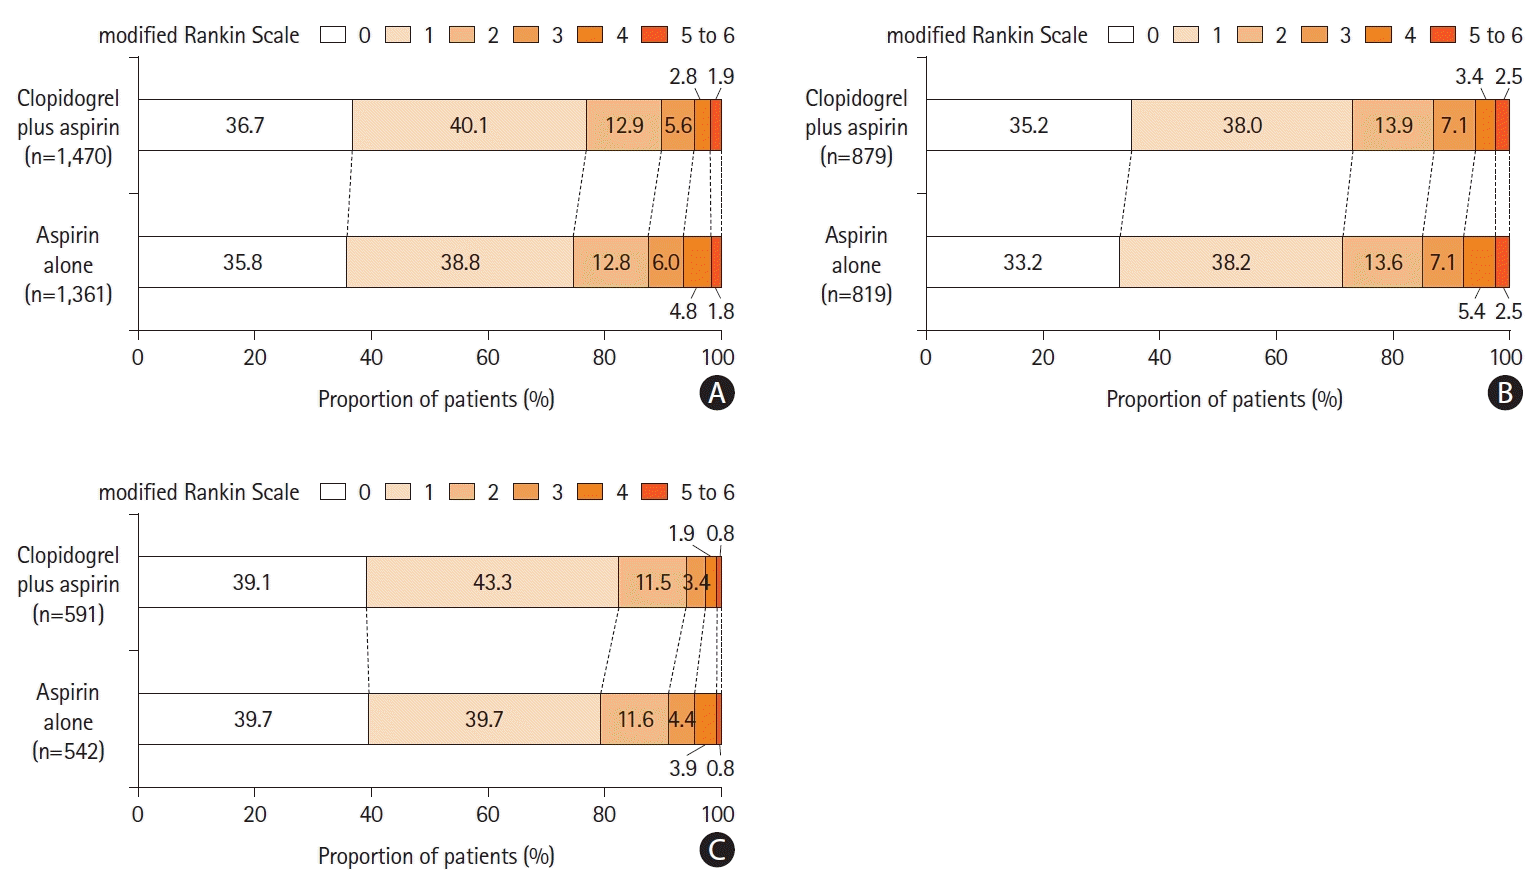
Figure 3.

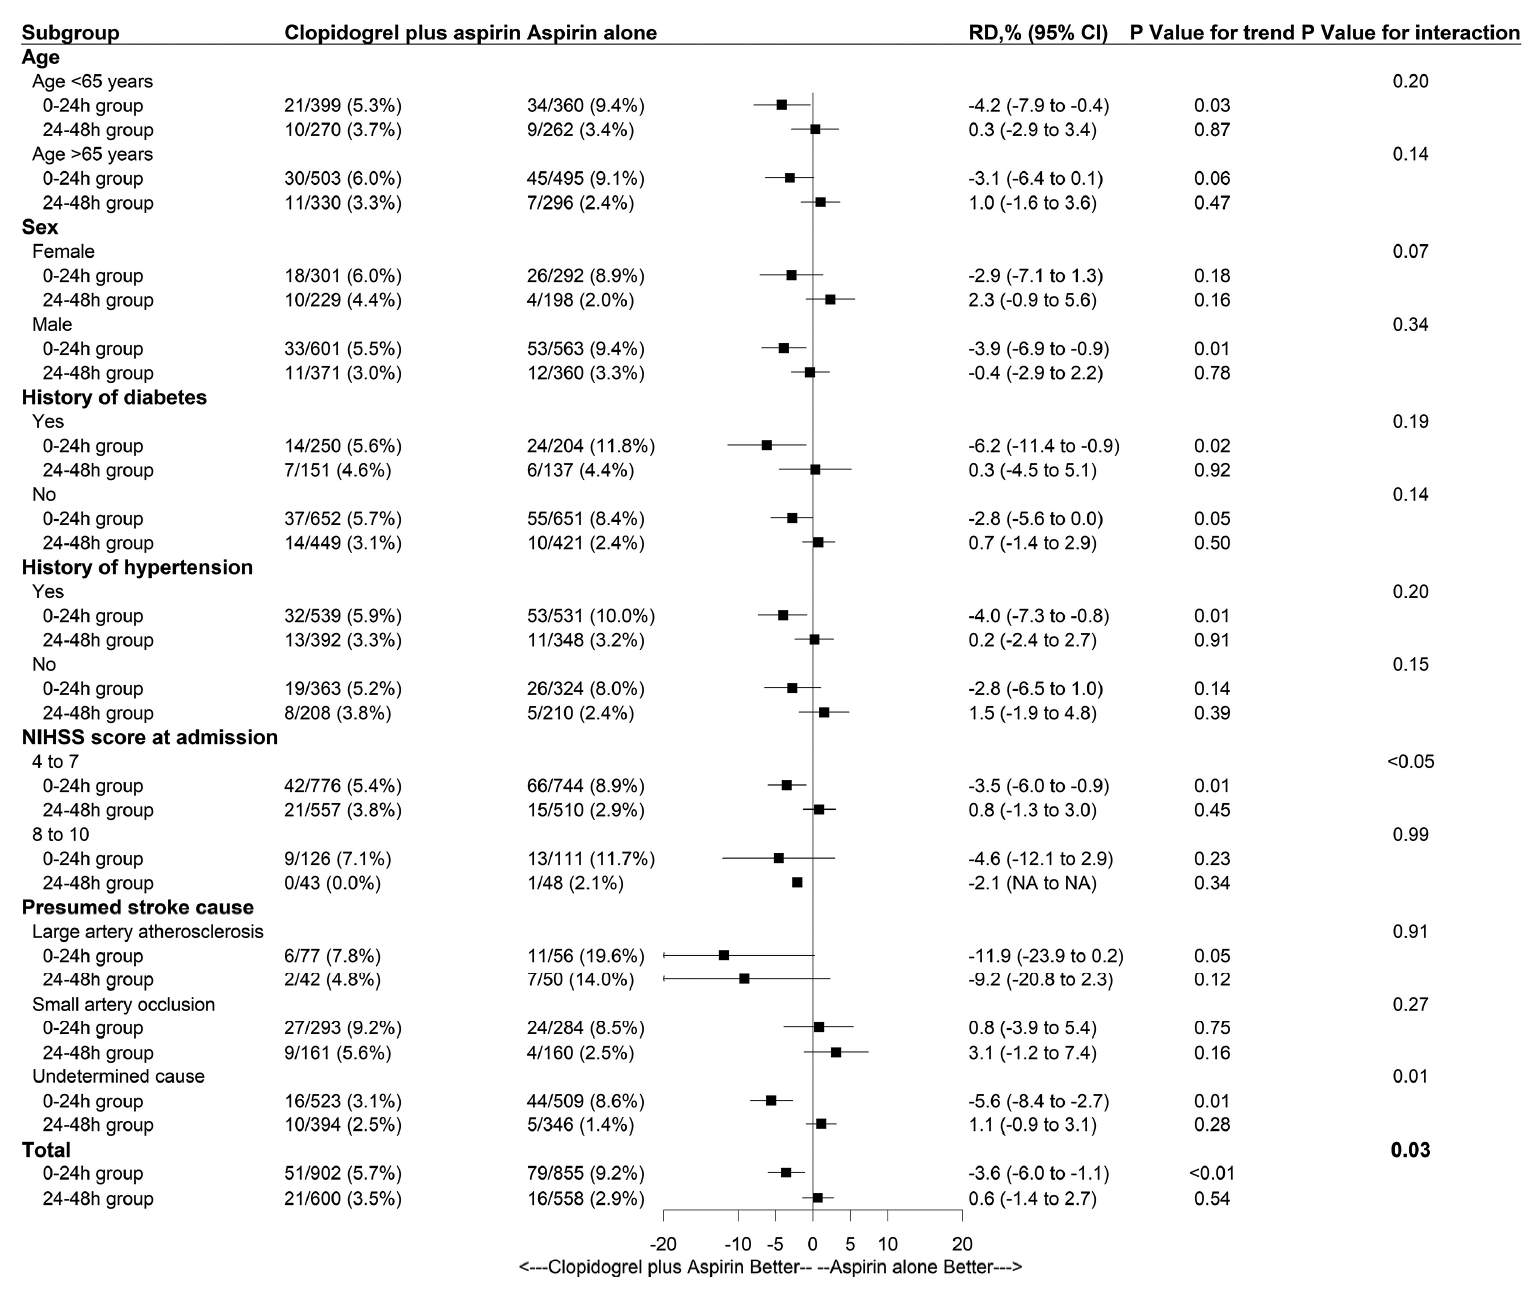
Figure 4.

Table 1.
|
0-24 h group |
24-48 h group |
P | |||||||
|---|---|---|---|---|---|---|---|---|---|
| Total patients (n=1,757) | Clopidogrel plus aspirin (n=902) | Aspirin alone (n=855) | P | Total patients (n=1,158) | Clopidogrel plus aspirin (n=600) | Aspirin alone (n=558) | P | ||
| Age (yr) | 66 (59–74) | 66 (59–73) | 67 (59–74) | 0.29 | 65 (58–73) | 66 (58–72) | 65 (58–74) | 0.63 | <0.01 |
| Sex | 0.73 | 0.34 | 0.08 | ||||||
| Male | 1,164 (66.2) | 601 (66.6) | 563 (65.8) | 731 (63.1) | 371 (61.8) | 360 (64.5) | |||
| Female | 593 (33.8) | 301 (33.4) | 292 (34.2) | 427 (36.9) | 229 (38.2) | 198 (35.5) | |||
| Current smoking | 632/1,745 (36.2) | 335/895 (37.4) | 297/850 (34.9) | 0.28 | 335/1,147 (29.2) | 168/594 (28.3) | 167/553 (30.2) | 0.48 | <0.01 |
| Current drinking* | 386/1,743 (22.1) | 203/893 (22.7) | 183/850 (21.5) | 0.55 | 204/1,148 (17.8) | 98/596 (16.4) | 106/552 (19.2) | 0.22 | <0.01 |
| Comorbidities† | |||||||||
| Hypertension | 1,070 (60.9) | 539 (59.8) | 531 (62.1) | 0.31 | 740 (63.9) | 392 (65.3) | 348 (62.4) | 0.29 | 0.10 |
| Diabetes | 454 (25.8) | 250 (27.7) | 204 (23.9) | 0.07 | 288 (24.9) | 151 (25.2) | 137 (24.6) | 0.81 | 0.56 |
| Previous stroke‡ | 546/1,747 (31.3) | 275/894 (30.8) | 271/853 (31.8) | 0.65 | 393/1,153 (34.1) | 207/597 (34.7) | 186/556 (33.5) | 0.66 | 0.11 |
| Previous TIA | 9/1,741 (0.5) | 7/895 (0.8) | 2/846 (0.2) | 0.11 | 3/1,153 (0.3) | 0/598 (0.0) | 3/555 (0.5) | 0.07 | 0.29 |
| Blood pressure at randomization | |||||||||
| Systolic (mm Hg) | 153 (140–170) | 153 (140–170) | 153 (140–170) | 0.99 | 150 (140–167) | 150 (140–169) | 151 (140–165) | 0.69 | 0.26 |
| Diastolic (mm Hg) | 90 (80–98) | 90 (80–98) | 90 (80–98) | 0.30 | 90 (80–100) | 90 (80–100) | 90 (80–98) | 0.22 | 0.67 |
| Blood glucose (mmol/L) | 6.0 (5.2–7.9) | 6.1 (5.3–8.0) | 6.0 (5.2–7.8) | 0.25 | 6.0 (5.2–8.1) | 6.0 (5.3–8.0) | 6.1 (5.1–8.2) | 0.57 | 0.92 |
| Baseline NIHSS score§ | 5 (4–6) | 5 (4–6) | 5 (4–6) | 0.69 | 4 (4–6) | 4 (4–6) | 4 (4–6) | 0.56 | <0.01 |
| Estimated premorbid function (mRS)ǁ | 0.24 | 0.98 | 0.90 | ||||||
| No symptoms | 1,247 (71.0) | 630 (69.8) | 617 (72.2) | 825 (71.2) | 426 (71.0) | 399 (71.5) | |||
| Symptoms without disability | 508 (28.9) | 270 (29.9) | 238 (27.8) | 331 (28.6) | 173 (28.8) | 158 (28.3) | |||
| Mild disability | 2 (0.1) | 2 (0.2) | 0 (0.0) | 2 (0.2) | 1 (0.2) | 1 (0.2) | |||
| OTT (h) | 9.0 (5.4–14.5) | 8.8 (5.2–14.1) | 9.0 (5.7–14.7) | 0.37 | 28.6 (25.1–41.2) | 28.1 (25.1–40.0) | 29.0 (25.1–42.3) | 0.26 | <0.01 |
| Presumed stroke cause¶ | 0.54 | 0.48 | 0.02 | ||||||
| UDC | 1,032/1,752 (58.9) | 523/899 (58.2) | 509/853 (59.7) | 740 (63.9) | 394 (65.7) | 346 (62.0) | |||
| SAO | 577/1,752 (32.9) | 293/899 (32.6) | 284/853 (33.3) | 321 (27.7) | 161 (26.8) | 160 (28.7) | |||
| LAA** | 133/1,752 (7.6) | 77/899 (8.6) | 56/853 (6.6) | 92 (7.9) | 42 (7.0) | 50 (9.0) | |||
| ODC | 6/1,752 (0.3) | 4/899 (0.4) | 2/853 (0.2) | 5 (0.4) | 3 (0.5) | 2 (0.4) | |||
| CE | 4/1,752 (0.2) | 2/899 (0.2) | 2/853 (0.2) | 0 (0.0) | 0 (0.0) | 0 (0.0) | |||
| Location of responsible vessel (identified by circulation infarction) | 0.22 | 0.11 | <0.01 | ||||||
| Anterior | 1,102/1,502 (73.4) | 569/791 (71.9) | 533/711 (75.0) | 678/1,005 (67.5) | 341/526 (64.8) | 337/479 (70.4) | |||
| Posterior | 354/1,502 (23.6) | 200/791 (25.3) | 154/711 (21.7) | 297/1,005 (29.6) | 171/526 (32.5) | 126/479 (26.3) | |||
| Anterior & posterior | 46/1,502 (3.1) | 22/791 (2.8) | 24/711 (3.4) | 30/1,005 (3.0) | 14/526 (2.7) | 16/479 (3.3) | |||
The data are shown with median (IQR) for continuous characteristic or frequency (percentages) for categorical characteristic.
TIA, transient ischemic attack; NIHSS, National Institutes of Health Stroke Scale; mRS, modified Rankin Scale; OTT, time from stroke onset to antiplatelet therapy; UDC, undetermined cause; SAO, small artery occlusion; LAA, large artery atherosclerosis; ODC, other determined cause; CE, cardioembolic; IQR, interquartile range.
* Current drinking means consuming alcohol at least once a week within 1 year before onset of the disease and consuming alcohol continuously for more than 1 year;
§ Patients with NIHSS scores of 6 to 16 were eligible for this study; NIHSS scores range from 0 to 42, with higher scores indicating more severe neurologic deficit;
ǁ Scores on the mRS of functional disability range from 0 (no symptoms) to 6 (death). No symptoms indicates scoring 0, symptoms without disability indicates scoring 1, and mild disability indicates scoring 2;
¶ The presumed stroke cause was classified according to the Trial of Org 10172 in Acute Stroke Treatment (TOAST) classification system13 using clinical findings, brain imaging, and laboratory tests. Other determined causes included pulmonary embolism, peripheral vessel incident, and cardiovascular incident;
Table 2.
| Clopidogrel plus aspirin (n=1,502) | Aspirin alone (n=1,413) | Treatment effect metric |
Model 1* |
Model 2† |
Model 3‡ |
Pint | ||||
|---|---|---|---|---|---|---|---|---|---|---|
| Treatment difference (95% CI) | P | Treatment difference (95% CI) | P | Treatment difference (95% CI) | P | |||||
| Primary outcome | ||||||||||
| END at 7 days§ | 72/1,502 (4.8) | 95/1,413 (6.7) | RDǁ | -1.9 (-3.6 to -0.2) | 0.03 | -1.9 (-3.1 to -0.7) | <0.01 | -1.9 (-3.6 to -0.2) | 0.03 | 0.13 |
| Secondary outcomes | ||||||||||
| mRS 0–1 at 90 days¶ | 1,130/1,470 (76.9) | 1,015/1,361 (74.6) | RDǁ | 2.4 (-0.8 to 5.6) | 0.14 | 2.3 (0.0 to 4.5) | 0.05 | 2.4 (-0.8 to 5.5) | 0.14 | 0.92 |
| mRS at 90 days¶ | NA | NA | OR** | 1.10 (0.96 to 1.25) | 0.19 | 1.09 (0.99 to 1.20) | 0.08 | 1.10 (0.97 to 1.26) | 0.10 | 0.66 |
| Change in NIHSS at 14 days†† | -0.56 (-0.99 to -0.22) | -0.51 (-1.10 to -0.22) | GMRǁ | 0.00 (-0.05 to 0.04) | 0.87 | 0.00 (-0.04 to 0.03) | 0.81 | 0.00 (-0.05 to 0.04) | 0.89 | 0.67 |
| New stroke within 90 days‡‡ | 12/1,470 (0.8) | 13/1,361 (1.0) | HR§§ | 0.86 (0.39 to 1.87) | 0.70 | 0.86 (0.39 to 1.89) | 0.71 | 0.84 (0.39 to 1.85) | 0.67 | 0.28 |
| Other vascular events or death within 90 daysǁǁ | 16/1,470 (1.1) | 12/1,361 (0.9) | HR§§ | 1.24 (0.59 to 2.61) | 0.58 | 1.20 (0.57 to 2.54) | 0.63 | 1.24 (0.59 to 2.63) | 0.59 | 0.13 |
| Safety outcomes¶¶ | ||||||||||
| Any bleeding events | 10/1,521 (0.7) | 14/1,442 (1.0) | RDǁ | -0.3 (-1.0 to 0.3) | 0.35 | -0.3 (-1.0 to 0.3) | 0.33 | -0.3 (-1.0 to 0.3) | 0.34 | 0.06 |
| Intracranial hemorrhage | 1/1,521 (0.1) | 2/1,442 (0.1) | RDǁ | -0.1 (-0.3 to 0.2) | 0.54 | -0.1 (-0.2 to 0.1) | 0.38 | -0.1 (-0.3 to 0.2) | 0.55 | 0.89 |
The data are shown with median (IQR) for continuous characteristic or frequency (percentages) for categorical characteristic unless otherwise indicated.
CI, confidence interval; END, early neurological deterioration; mRS, modified Rankin Scale; NIHSS, National Institutes of Health Stroke Scale; RD, risk difference; OR, odds ratio; GMR, geometric mean ratio; HR, hazard ratio; IQR, interquartile range; NA, not applicable; TOAST, Trial of Org 10172 in Acute Stroke Treatment.
‡ Adjusted for time from symptom onset to antiplatelet therapy and pre-specified covariates (age, sex, history of diabetes, history of hypertension, NIHSS score at randomization, and presumed stroke cause based on the TOAST classification13);
§ END was defined as an increase between baseline and 7 days of ≥2 on the NIHSS score, but not as result of cerebral hemorrhage10;
** A shift measures of function according to the full range of scores on the mRS at 90 days was analyzed by ordinal logistic regression, and the chi-square for the likelihood ratio test were 7.34 (P=0.20) in the model 1, 14.89 (P=0.11) in the model 2, and 12.20 (P=0.27) in the model 3;
Table 3.
| Time (h) | Clopidogrel plus aspirin (n=1,502) | Aspirin alone (n=1,413) | Treatment effect metric |
Model 1* |
Model 4† |
Model 5‡ |
Pint | ||||
|---|---|---|---|---|---|---|---|---|---|---|---|
| Treatment difference (95% CI) | P | Treatment difference (95% CI) | P | Treatment difference (95% CI) | P | ||||||
| Primary outcome | |||||||||||
| END at 7 days§ | 0–24 | 51/902 (5.7) | 79/855 (9.2) | RDǁ | -3.6 (-6.0 to -1.1) | <0.01 | -3.5 (-6.0 to -1.1) | <0.01 | -3.7 (-5.5 to -2.0) | <0.01 | 0.03 |
| 24–48 | 21/600 (3.5) | 16/558 (2.9) | 0.6 (-1.4 to 2.7) | 0.54 | 0.6 (-0.8 to 2.1) | 0.39 | 0.6 (-0.8 to 2.0) | 0.40 | |||
| Secondary outcomes | |||||||||||
| mRS 0–1 at 90 days¶ | 0–24 | 643/879 (73.2) | 585/819 (71.4) | RDǁ | 1.7 (-2.5 to 6.0) | 0.43 | 1.7 (-2.6 to 6.0) | 0.44 | 1.8 (-1.2 to 4.8) | 0.23 | 0.98 |
| 24–48 | 487/591 (82.4) | 430/542 (79.3) | 3.1 (-1.5 to 7.7) | 0.19 | 3.1 (-0.2 to 6.3) | 0.06 | 3.0 (-0.3 to 6.2) | 0.07 | |||
| mRS at 90 days¶ | 0–24 | NA | NA | OR** | 1.10 (0.93 to 1.31) | 0.27 | 1.10 (0.93 to 1.31) | 0.27 | 1.11 (0.98 to 1.25) | 0.10 | 0.25 |
| 24–48 | NA | NA | 1.06 (0.86 to 1.32) | 0.59 | 1.06 (0.91 to 1.24) | 0.45 | 1.06 (0.91 to 1.23) | 0.50 | |||
| Change in NIHSS at 14 day†† | 0–24 | -0.51 (-0.91 to -0.22) | -0.51 (-0.98 to -0.22) | GMRǁ | 0.01 (-0.05 to 0.07) | 0.66 | 0.02 (-0.04 to 0.08) | 0.60 | 0.02 (-0.03 to 0.06) | 0.43 | 0.20 |
| 24–48 | -0.56 (-1.10 to -0.25) | -0.69 (-1.10 to -0.34) | -0.03 (-0.10 to 0.04) | 0.37 | -0.03 (-0.08 to 0.02) | 0.19 | -0.04 (-0.08 to 0.01) | 0.17 | |||
| New stroke within 90 days‡‡ | 0–24 | 5/879 (0.6) | 9/819 (1.1) | HR§§ | 0.52 (0.17 to 1.54) | 0.24 | 0.52 (0.17 to 1.56) | 0.24 | 0.54 (0.18 to 1.61) | 0.27 | 0.12 |
| 24–48 | 7/591 (1.2) | 4/542 (0.7) | 1.61 (0.47 to 5.50) | 0.45 | 1.61 (0.47 to 5.49) | 0.45 | 1.84 (0.53 to 6.39) | 0.34 | |||
| Other vascular events or death within 90 daysǁǁ | 0–24 | 13/879 (1.5) | 11/819 (1.3) | HR§§ | 1.10 (0.49 to 2.46) | 0.81 | 1.12 (0.50 to 2.51) | 0.78 | 1.17 (0.52 to 2.63) | 0.71 | 0.37 |
| 24–48 | 3/591 (0.5) | 1/542 (0.2) | 2.76 (0.29 to 26.49) | 0.38 | 2.75 (0.29 to 26.44) | 0.38 | 2.35 (0.21 to 26.85) | 0.49 | |||
| Safety outcomes¶¶ | |||||||||||
| Any bleeding events | 0–24 | 4/914 (0.4) | 11/873 (1.3) | RDǁ | -0.8 (-1.7 to 0.0) | 0.06 | -0.8 (-1.7 to 0.0) | 0.05 | -0.9 (-1.5 to -0.3) | <0.01 | 0.05 |
| 24–48 | 6/607 (1.0) | 3/569 (0.5) | 0.5 (-0.5 to 1.5) | 0.36 | 0.5 (-0.2 to 1.2) | 0.20 | 0.5 (-0.2 to 1.2) | 0.20 | |||
| Intracranial hemorrhage | 0–24 | 1/914 (0.1) | 2/873 (0.2) | RDǁ | -0.1 (-0.5 to 0.3) | 0.54 | -0.1 (-0.7 to 0.6) | 0.93 | -0.1 (-0.4 to 0.2) | 0.39 | 0.99 |
| 24–48 | 0/607 (0.0) | 0/569 (0.0) | NA | NA | NA | NA | NA | NA | |||
The data are shown with median (IQR) for continuous characteristic or frequency (percentages) for categorical characteristic unless otherwise indicated.
CI, confidence interval; END, early neurological deterioration; mRS, modified Rankin Scale; NIHSS, National Institutes of Health Stroke Scale; RD, risk difference; OR, odds ratio; GMR, geometric mean ratio; HR, hazard ratio; IQR, interquartile range; NA, not applicable; TOAST, Trial of Org 10172 in Acute Stroke Treatment.
† Adjusted for unbalanced covariates between clopidogrel plus aspirin group and aspirin alone group;
‡ Adjusted for pre-specified covariates (age, sex, history of diabetes, history of hypertension, NIHSS score at randomization, and presumed stroke cause based on the TOAST classification13) and unbalanced covariates between clopidogrel plus aspirin group and aspirin alone group;
§ END was defined as an increase between baseline and 7 days of ≥2 on the NIHSS score, but not as result of cerebral hemorrhage10;
** A shift measures of function according to the full range of scores on the mRS at 90 days was analyzed by ordinal logistic regression, and the chi-square for the likelihood ratio test were 3.22 (P=0.67) and 6.71 (P=0.24) in the model 1, 7.03 (P=0.72) and 8.47 (P=0.58) in the model 4, and 48.77 (P=0.16) and 13.27 (P=0.21) in the model 5;


 PDF
PDF Citation
 Print
Print


 XML Download