Journal List > Clin Transplant Res > v.38(3) > 1516088603

Nimje, Goyal, Singh, Shekhrajka, Mishra, and Mittal: Assessment of fluid responsiveness after tidal volume challenge in renal transplant recipients: a nonrandomized prospective interventional study

Abstract

Background

When applying lung-protective ventilation, fluid responsiveness cannot be predicted by pulse pressure variation (PPV) or stroke volume variation (SVV). Functional hemodynamic testing may help address this limitation. This study examined whether changes in dynamic indices such as PPV and SVV, induced by tidal volume challenge (TVC), can reliably predict fluid responsiveness in patients undergoing renal transplantation who receive lung-protective ventilation.

Methods

This nonrandomized interventional study included renal transplant recipients with end-stage renal disease. Patients received ventilation with a 6 mL/kg tidal volume (TV), and the FloTrac system was attached for continuous hemodynamic monitoring. Participants were classified as responders or nonresponders based on whether fluid challenge increased the stroke volume index by more than 10%.

Results

The analysis included 36 patients, of whom 19 (52.8%) were responders and 17 (47.2%) were nonresponders. Among responders, the mean ΔPPV6-8 (calculated as PPV at a TV of 8 mL/kg predicted body weight [PBW] minus that at 6 mL/kg PBW) was 3.32±0.75 and ΔSVV6-8 was 2.58±0.77, compared to 0.82±0.53 and 0.70±0.92 for nonresponders, respectively. ΔPPV6-8 exhibited an area under the curve (AUC) of 0.97 (95% confidence interval [CI], 0.93–1.00; P≤0.001), with an optimal cutoff value of 1.5, sensitivity of 94.7%, and specificity of 94.1%. ΔSVV6-8 displayed an AUC of 0.93 (95% CI, 0.84–1.00; P≤0.001) at the same cutoff value of 1.5, with a sensitivity of 94.7% and a specificity of 76.5%.

Conclusions

TVC-induced changes in PPV and SVV are predictive of fluid responsiveness in renal transplant recipients who receive intraoperative lung-protective ventilation.

HIGHLIGHTS
  • The trial included patients aged 18–60 with hypotension after anesthesia but before fluid or vasopressors.

  • This study identifies ΔPPV6-8 (PPV, pulse pressure variation) as the most reliable predictor of fluid responsiveness following tidal volume challenge (TVC), outperforming other indices such as PPV8 and SVV8 (stroke volume variation).

  • Prior research has highlighted the value of TVC, and our study extends this by applying it specifically to renal transplant patients.

  • Future studies should investigate its long-term efficacy across diverse clinical settings.

INTRODUCTION

Renal transplant (RT) is the preferred treatment for patients with end-stage renal disease (ESRD) [1]. During transplantation, most patients with ESRD undergo hemodialysis, with frequent fluctuations between hypovolemia and hypervolemia. Consequently, there is a very narrow margin of safety for intravenous fluid maintenance and resuscitation throughout the perioperative period. Perioperative fluid imbalances in these patients can therefore precipitate major complications, including fluid overload, pulmonary edema, acute tubular necrosis, and delayed graft function. As a result, careful perioperative hemodynamic management plays a key role in minimizing complications and improving patient outcomes [2].
In traditional RT surgery, a central venous pressure-guided fluid management strategy has been employed, which involves infusing the maximum volume until no further response is observed [3]. However, this method can result in excessive fluid administration, potentially damaging the vascular endothelial glycocalyx and causing fluid to shift into the interstitial space. Studies have indicated that only about 50% of critically ill or surgical patients exhibit fluid responsiveness. Therefore, fluid administration should be based on parameters that can predict such responsiveness [4,5]. Research in the field of RT suggests that dynamic indices, such as pulse pressure variation (PPV) and stroke volume variation (SVV), are superior to static indices in predicting fluid responsiveness, specifically during controlled mechanical ventilation with a minimum tidal volume (TV) of 8 mL/kg. The use of these indices has led to improved outcomes [69].
Lung-protective ventilatory strategies, which involve a TV of 6–8 mL/kg of predicted body weight (PBW), are associated with favorable outcomes and have become the standard of practice, even in the operating room [10]. However, the use of these strategies limits the utility of dynamic indices such as PPV and SVV in predicting fluid responsiveness.
To address this issue, Myatra et al. [11] proposed a test known as TV challenge (TVC) to predict fluid responsiveness. They noted that changes in dynamic indices, prompted by a temporary increase in TV from 6 to 8 mL/kg for 1 minute, could reliably forecast fluid responsiveness in patients receiving lung-protective ventilation. Separately, TVC has demonstrated effectiveness in predicting fluid responsiveness among critically ill patients, while not being influenced by factors such as low lung compliance, moderate positive end-expiratory pressure (PEEP), or the use of different measurement devices [1217]. Recently, Messina et al. [18,19] demonstrated that changes in PPV and SVV following TVC are reliable intraoperative predictors of fluid responsiveness in neurosurgical patients receiving low-TV ventilation. However, data on the utility of TVC in patients undergoing RT are limited.
The purpose of this study was to evaluate whether changes in dynamic indices such as PPV and SVV, induced by TVC, could reliably predict fluid responsiveness in patients undergoing RT who receive ventilation using a lung-protective strategy.

METHODS

This study was approved by the Institutional Ethics Committee of Mahatma Gandhi Medical College and Hospital (No. MGMC&H/IEC/JPR/2022/683). Written informed consent was obtained from all participants. The study was registered as a clinical trial (CTRI/2022/04/042038). Mahatma Gandhi Medical College and Hospital is a tertiary university teaching hospital located in Jaipur, India. The study employed a prospective interventional single-center, single-arm design.
Adult patients with ESRD undergoing elective open RT recipient surgery were included in the study on a nonrandom basis if they met the following criteria: between 18 and 60 years old, required invasive arterial and central line monitoring intraoperatively, and developed hypotension (a fall in systolic arterial pressure [SAP] of ≥20% from before anesthetic induction) after the induction of anesthesia and prior to the administration of a fluid bolus or vasopressor agents. Patients were excluded from the analysis if they exhibited frequent cardiac arrhythmias, reduced left ventricular ejection fraction of less than 40%, body mass index above 30 kg/m2, restrictive lung disease, moderate to severe pulmonary hypertension, preoperative use of beta blockers, use of vasopressors or inotropes before or during TVC, new-onset intraoperative arrhythmia, or a heart rate-to-respiratory rate ratio of less than 3.6.

Perioperative Management

Standard intraoperative monitoring, including heart rate, peripheral oxygen saturation, continuous electrocardiography, and noninvasive blood pressure monitoring, was performed in all patients and baseline parameters were recorded. General anesthesia was induced using titrated doses of fentanyl (2 μg/kg), propofol (1–2 mg/kg), and cisatracurium besylate (0.15–0.20 mg/kg). Maintenance of anesthesia was achieved with the inhalation agent isoflurane, intravenous fentanyl for analgesia, and an infusion of cisatracurium besylate (2–3 μg/kg/min) to ensure complete neuromuscular blockade throughout the operation. The bispectral index was maintained between 40 and 60 intraoperatively for all patients. Plasma-Lyte (Baxter International Inc.), a balanced salt solution, was administered at a rate of 2 mL/kg/hr as a maintenance fluid.
The patients were ventilated using volume-control mode, with a TV of 6 mL/kg of PBW and a PEEP of 5 cm H2O, to maintain peripheral oxygen saturation above 96%. The end-tidal carbon dioxide concentration was held between 35 and 45 mmHg by titrating the respiratory rate. PBW (in kilograms) was calculated using the formula: X + 0.91 [height (cm) − 152.4], where X equals 50 for males and 45.5 for females. After anesthesia was induced, central and arterial lines were placed. A FloTrac system (Edwards Lifesciences) was attached to the patient for continuous hemodynamic monitoring.

Study Protocol

The TVC test was conducted at a specific time point, after the induction of anesthesia, when the patient exhibited hypotension—a fall in SAP greater than 20% from baseline or a mean arterial pressure below 70 mmHg—and before the administration of a fluid bolus or vasopressor agents. Prior to TVC, the square-wave test was employed to assess whether the pressure signal was underdamped or overdamped. Hemodynamic parameters, including pulse rate, SAP, diastolic arterial pressure, mean arterial pressure, central venous pressure, stroke volume index, SVV, and PPV, were recorded.
TVC was conducted by temporarily increasing the TV from 6 mL/kg to 8 mL/kg of PBW for 1 minute. Following this, a new set of hemodynamic parameters was recorded. Additionally, the changes in PPV and SVV were determined, where ΔPPV6-8 was calculated as PPV8 – PPV6 and ΔSVV6-8 was defined as SVV8 – SVV6. After TVC, the TV was returned to 6 mL/kg PBW, and the hemodynamic parameters were measured again.
Subsequently, fluid challenge was performed, involving the infusion of 250 mL of Plasma-Lyte solution over a 10-minute period. Then, the same set of hemodynamic parameters was recorded. Patients were classified as responders or nonresponders based on whether fluid challenge resulted in an increase in stroke volume index of more than 10%. The data from the first fluid challenge administered to each patient were analyzed. For patient safety, the attending anesthetist had the discretion to interrupt the protocol.

Statistical Analysis

All analyses were performed using SPSS ver. 26.0 (IBM Corp.), RStudio Team (2020; RStudio), and Stata ver. 14 (StataCorp). Continuous variables were reported as mean±standard deviation or median with interquartile range, as appropriate. Categorical data were presented as frequencies (percentages). The chi-square test or Fisher exact test was used to compare categorical data. Continuous variables, such as demographic characteristics and hemodynamic parameters, were compared between the responder and nonresponder groups using the independent Student t-test or the Mann-Whitney U-test, depending on the data distribution. Within each group, the paired t-test or Wilcoxon signed-rank test was used to compare continuous variables. Receiver operating characteristic (ROC) curves, along with the area under the curve (AUC) and 95% confidence intervals (CIs), were used to assess and compare the diagnostic performance of six parameters for detecting fluid responsiveness. These parameters included PPV at a TV of 6 mL/kg PBW; PPV at a TV of 8 mL/kg PBW; ΔPPV6-8, or the change in PPV after increasing TV from 6 to 8 mL/kg PBW; SVV at a TV of 6 mL/kg PBW; SVV at a TV of 8 mL/kg PBW; and ΔSVV6-8, or the change in SVV after increasing TV from 6 to 8 mL/kg PBW. Diagnostic indices, including sensitivity, specificity, positive likelihood ratio, negative likelihood ratio, positive predictive value, negative predictive value, and misclassification rate, were reported. The optimal cutoff value for each diagnostic variable was determined based on the Youden index, calculated as (sensitivity + specificity − 1). Sample size estimation was based on the area under the ROC curve, referencing Messina et al. [18]. Anticipating an area under the ROC curve of 0.94 for ΔPPV TVC, a null hypothesis of 0.50, and a sample size ratio of 1 between negative and positive groups, the final sample size was estimated to be 28 (across both groups) with 80% power and a 5% level of significance. All statistical tests were performed at a 5% significance level, and a P-value of less than 0.05 was considered to indicate statistical significance.

RESULTS

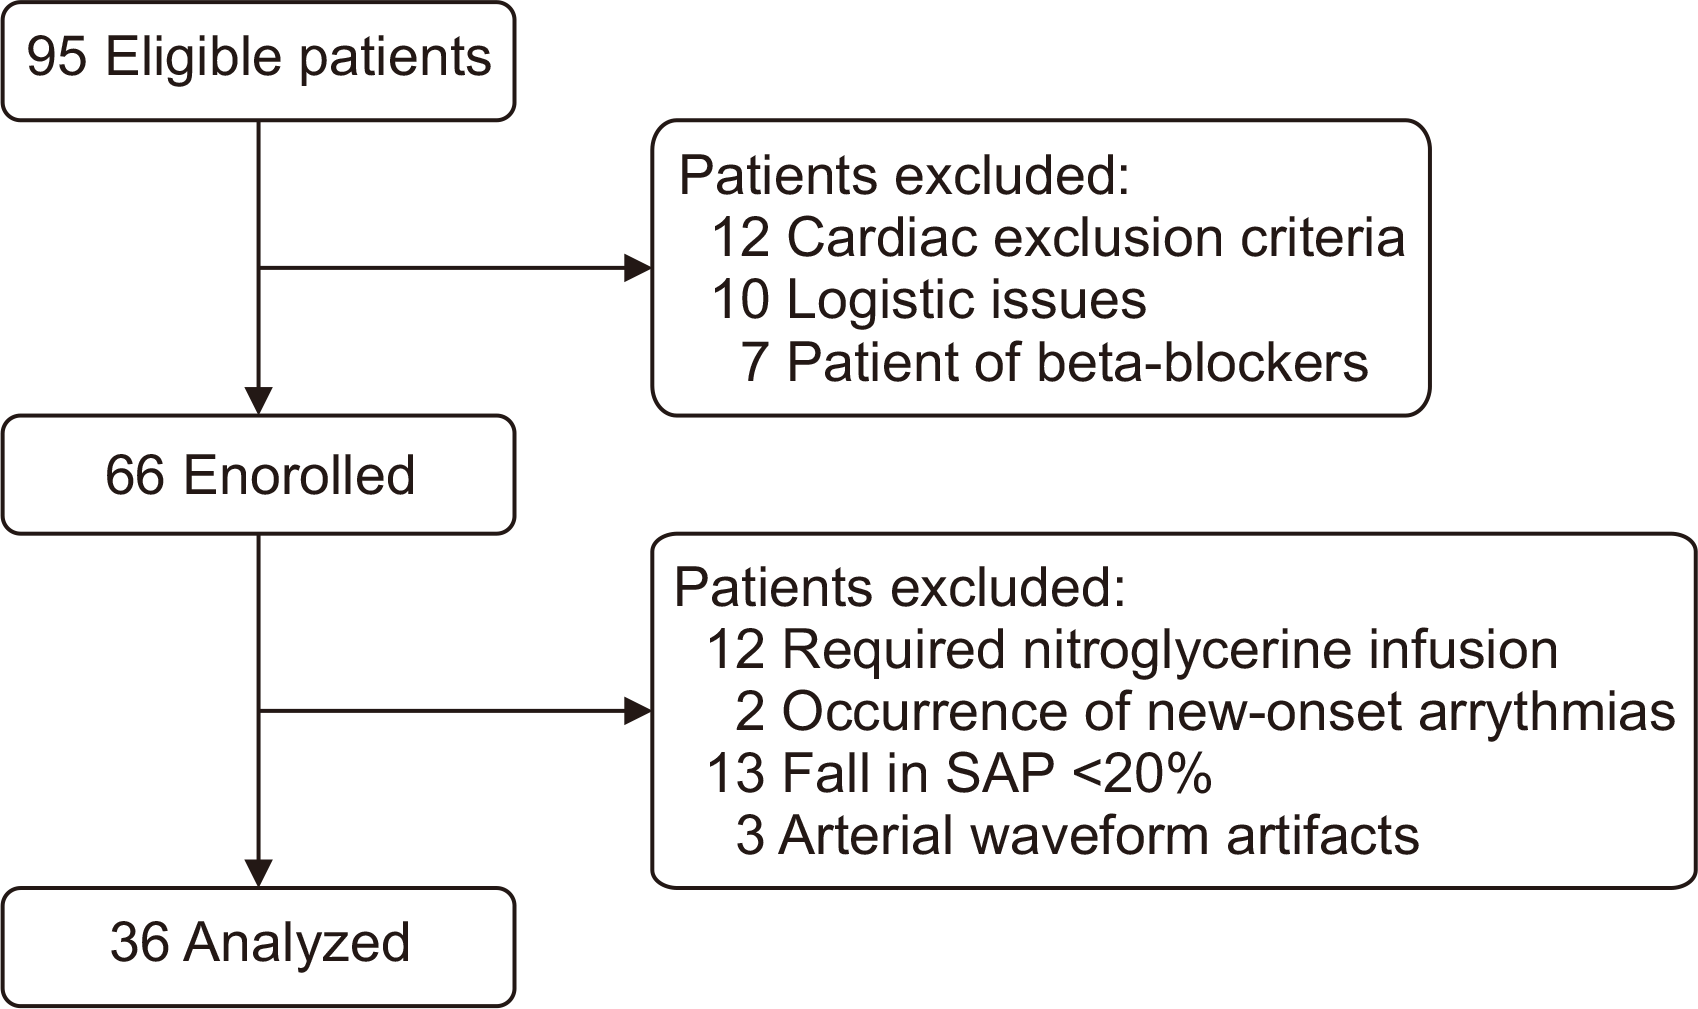
This prospective nonrandomized interventional study was conducted from June 2022 to October 2022, during which 95 patients underwent RT. Of these, 66 patients were enrolled in the study, but only 36 were eligible for the final analysis (Fig. 1). None of the patients experienced any adverse events during the TVC test, and the study protocol was strictly followed by the attending anesthesiologist. Among the 36 patients, 19 (52.8%) were classified as responders and 17 (47.2%) as nonresponders. Table 1 presents the general demographics, preoperative hemodynamic parameters, and history of comorbidities among recipients. These factors were statistically similar between the two groups (P>0.05). Table 2 details the hemodynamic parameters in the responder and nonresponder groups at various time points: baseline-1 (TV 6 mL/kg), after TVC (in which TV is increased from 6 mL/kg to 8 mL/kg), baseline-2 (after reducing TV from 8 mL/kg back to 6 mL/kg), and after fluid challenge. Fig. 2 illustrates the PPV and SVV at different time points. The hemodynamic parameters at baseline-1 and baseline-2 were comparable between the two groups.

Impact of Tidal Volume Challenge on Pulse Pressure Variation

The mean change in ΔPPV6-8 was 3.32±0.75 in responders, compared to 0.82±0.53 in nonresponders. The average percentage increase in ΔPPV6-8 was 39%±13% in responders and 10%±7% in nonresponders. These findings suggest that ΔPPV6-8 can effectively differentiate between fluid responders and nonresponders (Table 3).

Impact of Tidal Volume Challenge on Stroke Volume Variation

The mean change in ΔSVV6-8 was 2.58±0.77 in responders, compared to 0.70±0.92 in nonresponders. The average percentage increase in ΔSVV6-8 was 30%±12% in responders and 9%±11% in nonresponders. These findings suggest that ΔSVV6-8 can effectively differentiate between fluid responders and nonresponders (Table 3).

Receiver Operating Characteristic Comparisons

In the ROC curve analysis (Fig. 3), both the absolute change and the percentage increase demonstrated the capacity to predict fluid responsiveness. ΔPPV6-8 displayed an AUC of 0.97 (95% CI, 0.93–1.00; P<0.001) and an optimal cutoff value of 1.5, with a sensitivity of 94.7% and a specificity of 94.1%. In turn, ΔSVV6-8 exhibited an AUC of 0.93 (95% CI, 0.84–1.00; P<0.001) and the same cutoff value of 1.5, yielding a sensitivity of 94.7% and a specificity of 76.5%.

DISCUSSION

The primary finding of this study is that although PPV8, SVV8, the change in PPV (ΔPPV6-8), and the change in SVV (ΔSVV6-8) following TVC can predict fluid responsiveness, ΔPPV6-8 emerged as the superior predictor. This finding was based on the AUC, sensitivity, specificity, and positive and negative predictive values. Additionally, the study reveals that while the percentage changes in PPV and SVV (ΔPPV6-8 [%] and ΔSVV6-8 [%]) are reliable measures of fluid responsiveness, they require additional computations and are not suitable for bedside use.
Our findings further indicate that even when all other validity criteria are met, a protective ventilatory approach precludes the use of baseline PPV and SVV for assessing volume status. Moreover, approximately 50% of the patients displayed fluid responsiveness, aligning with previous observations in elective surgical patients [20,21]. This suggests that functional hemodynamic tests should be employed for patients under protective ventilation in the operating room to improve the predictive value of PPV and SVV.
The TVC hypothesis was first effectively tested by Myatra et al. [11] in a study of 20 critically ill patients. According to their findings, the use of low TV during protective ventilation can lead to false-negative values of dynamic indices. Therefore, increasing the TV and intrathoracic pressure should differentially elevate PPV and SVV in responders versus nonresponders. Additionally, TVC is preferable to classic fluid challenge, as the latter carries a risk of fluid overload, especially when administered repeatedly in cases of fluid unresponsiveness. Consequently, TVC intervention should be applied in subsequent episodes of hypotension.
Several studies conducted in operating room settings have corroborated our findings. These studies demonstrated that a change in PPV following an increase in TVC from 6 to 8 mL/kg of PBW accurately predicted fluid responsiveness in patients undergoing neurosurgery and in those undergoing robotic surgery in the Trendelenburg position [15,18,19].
According to Myatra et al. [11], the absolute changes in PPV and SVV induced by TVC reliably predicted fluid responsiveness, with cutoff values of 3.5% and 2.5% and areas under the ROC curve of 0.99 and 0.97, respectively. However, their research included only 20 patients. The larger patient sample in our study and the varied pathophysiological status of the patients could account for the discrepancies in cutoff value and specificity.
In resource-limited centers lacking advanced hemodynamic monitoring devices for measuring cardiac output, a simple test such as TVC may be employed in patients on lung-protective ventilation strategies. The resulting change in PPV can then be utilized to distinguish between fluid responders and nonresponders, as suggested by Myatra et al. [11] and corroborated by our findings.
Shi et al. [16] found neither PPV8 nor SVV8 useful in predicting fluid responsiveness. This aligns with previous research indicating that PPV and SVV values ranging from 9% to 13% fall within a “grey zone,” rendering them inconclusive for predicting preload responsiveness and necessitating further functional hemodynamic testing [19,21]. In our study, the TVC-induced measurement ΔPPV6-8 reliably predicted fluid responsiveness, demonstrating a sensitivity of 94.7% and a specificity of 94.1%. These figures are slightly lower than those reported by Myatra et al. [11], who observed a sensitivity of 94% and a specificity of 100%. Consequently, ΔPPV6-8 is a superior marker of fluid responsiveness relative to a single PPV measurement at a given TV.
The cutoff values for ΔPPV6-8 and ΔSVV6-8 identified by ROC curve analysis in our study differ from those reported by Messina et al. [18]. This discrepancy may be attributed to the differing hemodynamic impact of TVC in an RT context as opposed to the neurosurgical patients examined by Messina et al. [18].
When transitioning to goal-directed fluid therapy using dynamic indices like PPV and SVV rather than traditional static indices for fluid and hemodynamic management, the use of TVC helps overcome the limitations associated with low-TV ventilation. This approach is designed to optimize fluid balance and respiratory function while preserving hemodynamic stability, thereby potentially improving outcomes in RT recipients. Prospective studies involving large patient samples with long-term follow-up are needed to validate these results.

Strengths of the Study

Lung-protective strategies involving low-TV ventilation are increasingly becoming an integral part of intraoperative care, and the importance of TVC has been highlighted by prior research. In this context, our study is likely the first to employ the TVC-PPV test to predict fluid responsiveness in patients receiving RTs.

Limitations of the Study

The use of PPV has limitations in certain patient groups, such as those with arrhythmias, spontaneous breathing efforts, or pneumoperitoneum, rendering the TVC-PPV test unreliable in these scenarios. Patients with PPV in the “grey zone” also require further study to confirm our findings. The amount and duration of fluid administration for fluid challenge, as well as the TV for use in TVC, warrant additional research. Continuous cardiac output monitoring is required to observe changes in SVV, which may be challenging in a resource-limited setting. Furthermore, the intraoperative phase is dynamic and can change abruptly; the intervention in our study was limited to a single time frame. Finally, this is a single-center study with a small sample size, which suggests the need for further research to assess the findings with a larger sample. TVC-induced changes in PPV and SVV are predictive of fluid responsiveness in RT recipients who receive intraoperative low-TV ventilation as part of a lung-protective ventilation strategy.

ARTICLE INFORMATION

Conflict of Interest

No potential conflict of interest relevant to this article was reported.

Author Contributions

Conceptualization: GRN, VKG, PS (Pankaj Singh), PS (Praveenkumar Shekhrajka). Data curation: all authors. Formal analysis: GRN, VKG, PS (Pankaj Singh), AM. Writing–original draft: GRN, VKG, PS (Pankaj Singh). Writing–review & editing: all authors. All authors read and approved the final manuscript.

Additional Contributions

The authors would like to thank the Jaipur Paper Clinic (JPC) run by Prof. VK Kapoor, Head of the Department of Hepato-pancreato-biliary Surgery at the Mahatma Gandhi Medical College and Hospital in Jaipur Rajasthan India for his comments on the manuscript.

Additional Information

Current affiliation of Pankaj Singh: Department of Anaesthesia, Critical Care and Pain, Advanced Centre for Treatment, Research and Education in Cancer (ACTREC), Tata Memorial Centre, Homi Bhabha National Institute, Navi Mumbai, India.

REFERENCES

1. Lemmens HJ. 2004; Kidney transplantation: recent developments and recommendations for anesthetic management. Anesthesiol Clin North Am. 22:651–62. DOI: 10.1016/j.atc.2004.05.007. PMID: 15541928.
2. Calixto Fernandes MH, Schricker T, Magder S, Hatzakorzian R. 2018; Perioperative fluid management in kidney transplantation: a black box. Crit Care. 22:14. DOI: 10.1186/s13054-017-1928-2. PMID: 29368625. PMCID: PMC5784708.
3. Wagener G, Bezinover D, Wang C, Kroepfl E, Diaz G, Giordano C, et al. 2021; Fluid management during kidney transplantation: a consensus statement of the committee on transplant anesthesia of the American Society of Anesthesiologists. Transplantation. 105:1677–84. DOI: 10.1097/TP.0000000000003581. PMID: 33323765.
4. Messina A, Longhini F, Coppo C, Pagni A, Lungu R, Ronco C, et al. 2017; Use of the fluid challenge in critically ill adult patients: a systematic review. Anesth Analg. 125:1532–43. DOI: 10.1213/ANE.0000000000002103. PMID: 28514324.
5. Cavaleri M, Veroux M, Palermo F, Vasile F, Mineri M, Palumbo J, et al. 2019; Perioperative goal-directed therapy during kidney transplantation: an impact evaluation on the major postoperative complications. J Clin Med. 8:80. DOI: 10.3390/jcm8010080. PMID: 30642015. PMCID: PMC6351933.
6. Goyal VK, Gupta P, Baj B, Garg VK. 2021; A randomized comparison between pulse pressure variation and central venous pressure in patients undergoing renal transplantation. J Anaesthesiol Clin Pharmacol. 37:628–32. DOI: 10.4103/joacp.JOACP_23_20. PMID: 35340962. PMCID: PMC8944348.
7. Kannan G, Loganathan S, Kajal K, Hazarika A, Sethi S, Sen IM, et al. 2022; The effect of pulse pressure variation compared with central venous pressure on intraoperative fluid management during kidney transplant surgery: a randomized controlled trial. Can J Anaesth. 69:62–71. DOI: 10.1007/s12630-021-02130-y. PMID: 34750747.
8. Biais M, Ehrmann S, Mari A, Conte B, Mahjoub Y, Desebbe O, et al. 2014; Clinical relevance of pulse pressure variations for predicting fluid responsiveness in mechanically ventilated intensive care unit patients: the grey zone approach. Crit Care. 18:587. DOI: 10.1186/s13054-014-0587-9. PMID: 25658489. PMCID: PMC4240833.
9. De Cassai A, Bond O, Marini S, Panciera G, Furian L, Neri F, et al. 2020; Pulse pressure variation guided fluid therapy during kidney transplantation: a randomized controlled trial. Braz J Anesthesiol. 70:194–201. DOI: 10.1016/j.bjan.2020.02.008. PMID: 32534731. PMCID: PMC9373208.
10. Eikermann M, Kurth T. 2015; Apply protective mechanical ventilation in the operating room in an individualized approach to perioperative respiratory care. Anesthesiology. 123:12–4. DOI: 10.1097/ALN.0000000000000707. PMID: 25978325.
11. Myatra SN, Prabu NR, Divatia JV, Monnet X, Kulkarni AP, Teboul JL. 2017; The changes in pulse pressure variation or stroke volume variation after a "tidal volume challenge" reliably predict fluid responsiveness during low tidal volume ventilation. Crit Care Med. 45:415–21. DOI: 10.1097/CCM.0000000000002183.
12. Alvarado Sánchez JI, Caicedo Ruiz JD, Diaztagle Fernández JJ, Amaya Zuñiga WF, Ospina-Tascón GA, Cruz Martínez LE. 2021; Predictors of fluid responsiveness in critically ill patients mechanically ventilated at low tidal volumes: systematic review and meta-analysis. Ann Intensive Care. 11:28. DOI: 10.1186/s13613-021-00817-5. PMID: 33555488. PMCID: PMC7870741.
13. Wang X, Liu S, Gao J, Zhang Y, Huang T. 2023; Does tidal volume challenge improve the feasibility of pulse pressure variation in patients mechanically ventilated at low tidal volumes? A systematic review and meta-analysis. Crit Care. 27:45. DOI: 10.1186/s13054-023-04336-6. PMID: 36732851. PMCID: PMC9893685.
14. Yonis H, Bitker L, Aublanc M, Perinel Ragey S, Riad Z, Lissonde F, et al. 2017; Change in cardiac output during Trendelenburg maneuver is a reliable predictor of fluid responsiveness in patients with acute respiratory distress syndrome in the prone position under protective ventilation. Crit Care. 21:295. DOI: 10.1186/s13054-017-1881-0. PMID: 29208025. PMCID: PMC5718075.
15. Jun JH, Chung RK, Baik HJ, Chung MH, Hyeon JS, Lee YG, et al. 2019; The tidal volume challenge improves the reliability of dynamic preload indices during robot-assisted laparoscopic surgery in the Trendelenburg position with lung-protective ventilation. BMC Anesthesiol. 19:142. DOI: 10.1186/s12871-019-0807-6. PMID: 31390982. PMCID: PMC6686427.
16. Shi R, Ayed S, Moretto F, Azzolina D, De Vita N, Gavelli F, et al. 2022; Tidal volume challenge to predict preload responsiveness in patients with acute respiratory distress syndrome under prone position. Crit Care. 26:219. DOI: 10.1186/s13054-022-04087-w. PMID: 35850771. PMCID: PMC9294836.
17. Xu Y, Guo J, Wu Q, Chen J. 2022; Efficacy of using tidal volume challenge to improve the reliability of pulse pressure variation reduced in low tidal volume ventilated critically ill patients with decreased respiratory system compliance. BMC Anesthesiol. 22:137. DOI: 10.1186/s12871-022-01676-8. PMID: 35508962. PMCID: PMC9066736.
18. Messina A, Montagnini C, Cammarota G, De Rosa S, Giuliani F, Muratore L, et al. 2019; Tidal volume challenge to predict fluid responsiveness in the operating room: an observational study. Eur J Anaesthesiol. 36:583–91. DOI: 10.1097/EJA.0000000000000998. PMID: 31021879.
19. Messina A, Montagnini C, Cammarota G, Giuliani F, Muratore L, Baggiani M, et al. 2020; Assessment of fluid responsiveness in prone neurosurgical patients undergoing protective ventilation: role of dynamic indices, tidal volume challenge, and end-expiratory occlusion test. Anesth Analg. 130:752–61. DOI: 10.1213/ANE.0000000000004494. PMID: 31651455.
20. Cannesson M, Le Manach Y, Hofer CK, Goarin JP, Lehot JJ, Vallet B, et al. 2011; Assessing the diagnostic accuracy of pulse pressure variations for the prediction of fluid responsiveness: a "gray zone" approach. Anesthesiology. 115:231–41. DOI: 10.1097/ALN.0b013e318225b80a.
21. Messina A, Sotgiu G, Saderi L, Puci M, Negri K, Robba C, et al. 2023; Phenotypes of hemodynamic response to fluid challenge during anesthesia: a cluster analysis. Minerva Anestesiol. 89:653–62. DOI: 10.23736/S0375-9393.23.16992-6. PMID: 36943710.

Fig. 1
Flowchart of the study population. SAP, systolic arterial pressure.
ctr-38-3-188-f1.tif
Fig. 2
Error bar charts across various time points for (A) PPV and (B) SVV. PPV, pulse pressure variation; SVV, stroke volume variation; TV, tidal volume; TVC, tidal volume challenge.
ctr-38-3-188-f2.tif
Fig. 3
Receiver operating characteristic (ROC) curves comparing the capacity of various variables to discriminate between fluid responders and nonresponders. The ROC curves are derived from six diagnostic parameters used to assess fluid responsiveness: (A) baseline-1 TVC PPV, the PPV during ventilation with a tidal volume of 6 mL/kg predicted body weight; 8 mL TVC-PPV, the PPV during ventilation with a tidal volume of 8 mL/kg predicted body weight; ΔPPV6-8, the change in PPV upon transition from 6 to 8 mL/kg predicted body weight tidal volume. (B) Baseline-1 TVC SVV, the SVV during ventilation with a tidal volume of 6 mL/kg predicted body weight; 8 mL TVC-SVV, the SVV during ventilation with a tidal volume of 8 mL/kg predicted body weight; and ΔSVV6-8, the change in SVV upon transition from 6 to 8 mL/kg predicted body weight tidal volume. TVC, tidal volume challenge; PPV, pulse pressure variation; SVV, stroke volume variation.
ctr-38-3-188-f3.tif
Table 1
Comparison of general patient characteristics between responders and nonresponders
Characteristic All participants (n=36) Fluid responders (n=19) Fluid nonresponders (n=17) P-value
Age (yr) 33.8±9.6 35.4±11.3 31.9±7.0 0.274
Sex 0.139
Male 26 (72.2) 16 (84.2) 10 (58.8)
Female 10 (27.8) 3 (15.8) 7 (41.2)
Body mass index (kg/m2) 20.8±3.5 21.6±4.2 20.1±2.3 0.211
PBW (kg) 63.5 (54.2–68.0) 64.0 (59.0–68.0) 61.0 (50.0–68.0) 0.175
Duration (mo) 13.5 (6.0–36.0) 18.0 (6.0–36.0) 9.0 (6.0–30.0) 0.531
Duration of dialysis (mo) 3.5 (1.0–8.0) 4.0 (1.0–8.0) 3.0 (1.5–9.5) 0.616
Comorbidities
None 6 (16.7) 3 (15.8) 3 (17.6) >0.999
Hypertension 27 (75.0) 14 (73.7) 13 (76.5) -
Hypertension with diabetes 3 (8.3) 2 (10.5) 1 (5.9) -
2D ECHO: EF% 57.7±3.8 58.5±2.8 56.8±4.7 0.199
No DD 9 (25.0) 6 (31.6) 3 (17.6) 0.438
Grade 1 DD 16 (44.4) 9 (47.4) 7 (41.2) -
Grade 2 DD 11 (30.6) 4 (21.1) 7 (41.2) -
Lactate (mmol/L) 1.0±0.5 1.0±0.6 1.0±0.5 0.870
Heart rate (beats/min) 68.3±8.5 69.3±9.2 67.2±7.7 0.469
SAP (mmHg) 155.0±8.1 154.9±9.1 155.1±7.2 0.968
DAP (mmHg) 87.3±3.4 87.5±3.1 87.1±3.8 0.726
MAP (mmHg) 109.9±4.7 110.0±4.7 109.8±4.8 0.887

Values are presented as mean±standard deviation, number (%), or median (interquartile range).

PBW, predicted body weight; 2D ECHO, two-dimensional echocardiography; EF, ejection fraction; DD, diastolic dysfunction; SAP, systolic arterial pressure; DAP, diastolic arterial pressure; MAP, mean arterial pressure.

Table 2
Comparison of hemodynamic variables between fluid responders and nonresponders at baseline and after fluid challenge
Variable Fluid responders (n=19) Fluid nonresponders (n=17)
Baseline-1 (TV, 6 mL/kg) After TVC (TV, 8 mL/kg) Baseline-2 (TV, 6 mL/kg) After fluid challenge (TV, 6 mL/kg) Baseline-1
(TV, 6 mL/kg)
After TVC
(TV, 8 mL/kg)
Baseline-2
(TV, 6 mL/kg)
After fluid challenge
(TV, 6 mL/kg)
HR (beats/min) 89.7±10.5 89.9±10.3 89.4±10.6 81.3±8.0a),b) 86.2±9.4 86.5±9.2 86.3±8.9 84.5±8.3a),b)
SAP (mmHg) 105.8±7.1 106.5±7.2 106.2±7.0 122.3±4.9a),b),c) 106.2±6.8 106.5±6.2 106.8±6.4 111.3±7.4a),b)
DAP (mmHg) 71.2±4.5 71.5±4.8 71.4±4.8 76.9±4.0a),b),c) 70.3±5.2 70.3±5.2 70.4±5.3 71.5±5.8a),b)
MAP (mmHg) 82.5±4.9 82.7±4.8 82.9±4.8 92.0±3.7a),b),c) 82.2±4.9 82.2±4.8 82.2±4.9 84.6±5.2a),b)
CVP (mmHg) 6.89±1.20 6.89±1.20 6.89±1.20 8.42±1.02a),b) 7.53±0.94 7.53±0.94 7.53±0.94 7.94±0.83a),b)
SVR (dyne × sec/cm5) 1,095±139 1,091±132 1,084±117 1,142±110a),b) 1,102±147 1,097±143 1,103±134 1,131±137
CI (L/min/m2) 5.58±0.51 5.61±0.50d) 5.60±0.49 5.92±0.44a),b),c) 5.47±0.53 5.47±0.53 5.47±0.53 5.44±0.49
SVI (mL/m2) 37.7±5.2 38.0±5.3d) 37.8±5.4 43.8±5.5a),b) 41.1±7.3 40.9±7.3 40.5±7.1 41.2±7.4
PPV (%) 8.95±2.39 12.26±2.26c),d) 8.84±2.32 6.79±1.40a),b),c) 9.18±2.68 10.00±2.54d) 9.12±2.47 8.24±2.24a),b)
SVV (%) 9.04±2.39 11.63±2.19c),d) 8.89±2.26 6.63±1.26a),b),c) 9.24±2.64 9.94±2.46d) 9.35±2.34 8.53±2.15a),b)

Values are presented as mean±standard deviation.

TV, tidal volume; TVC, tidal volume challenge; HR, heart rate; SAP, systolic arterial pressure; DAP, diastolic arterial pressure; MAP, mean arterial pressure; CVP, central venous pressure; SVR, systemic vascular resistance; CI, cardiac index; SVI, stroke volume index; PPV, pulse pressure variation; SVV, stroke volume variation.

a)P<0.05: baseline-1 vs. after fluid challenge; b)P<0.05: baseline-2 vs. after fluid challenge; c)P<0.05: fluid responders vs. fluid nonresponders; d)P<0.05: baseline-1 vs. after TVC.

Table 3
Diagnostic performance of various parameters in predicting fluid responsiveness
Variable AUC (95% CI) P-value Cutoff value Youden index Sensitivity (%) Specificity (%) LR+ LR− Positive predictive value (%) Negative predictive value (%) Misclassification rate (%)
PPV6 0.50 (0.31–0.70) 0.975 7.5 0.09 73.7 35.3 1.14 0.88 56.0 54.5 44.4
PPV8 0.73 (0.55–0.91) 0.019 9.5 0.53 94.7 58.8 2.30 0.09 72.0 90.9 22.2
PPV6-8 0.97 (0.93–1.00) <0.001 1.5 0.88 94.7 94.1 16.05 0.05 94.7 94.1 5.0
ΔPPV6-8 (%) 0.95 (0.88–1.00) <0.001 0.2 0.88 94.7 94.1 16.05 0.05 94.7 94.1 5.0
SVV6 0.51 (0.32–0.71) 0.874 7.5 0.14 79.0 35.3 1.21 0.60 57.6 60.0 41.0
SVV8 0.70 (0.52–0.88) 0.039 9.5 0.38 79.0 58.8 1.88 0.36 68.1 71.4 30.5
SVV6-8 0.93 (0.84–1.00) <0.001 1.5 0.71 94.7 76.5 4.02 0.07 78.2 92.3 16.7
ΔSVV6-8 (%) 0.91 (0.81–1.00) <0.001 0.18 0.72 89.5 76.5 3.80 0.14 81.0 87.6 17.0

AUC, area under the receiver operating characteristic curve; CI, confidence interval; LR+, positive likelihood ratio; LR−, negative likelihood ratio; PPV6, pulse pressure variation at a tidal volume of 6 mL/kg; PPV8, pulse pressure variation at a tidal volume of 8 mL/kg; ΔPPV6-8, change in pulse pressure variation following change in tidal volume from 6 to 8 mL/kg; ΔPPV6-8 (%), percent change in pulse pressure variation following change in tidal volume from 6 to 8 mL/kg; SVV6, stroke volume variation at a tidal volume of 6 mL/kg; SVV8, stroke volume variation at a tidal volume of 8 mL/kg; ΔSVV6-8, change in stroke volume variation following change in tidal volume from 6 to 8 mL/kg; ΔSVV6-8 (%), percent change in stroke volume variation following change in tidal volume from 6 to 8 mL/kg.

TOOLS
Similar articles