Abstract
Objective
Methods
Results
Conclusion
Notes
CONFLICT OF INTEREST
J.H.J. has been an editorial board member since May 2018; however, has no role in the decision to publish this article.
AUTHOR CONTRIBUTIONS
E.J.K. and J.H.J. devised the project, the main conceptual ideas and proof outline. E.J.K. worked out all the technical details and performed the numerical suggested statistical analysis. Y.P. refined the KISS cohort data for analysis. E.J.K. and S.K.K. wrote the manuscript. All of authors reviewed the manuscript and agreed the content.
REFERENCES
Figure 1

Figure 2

Table 1
Table 2
| CSS (n=21) | pSS (n=239) | n | p-value | |
|---|---|---|---|---|
| Female | 19 (90.48%) | 237 (99.16%) | 260 | 0.034 |
| Age at diagnosis (yr) | 61.90±9.48 | 50.63±12.22 | 260 | <0.001 |
| BMI (kg/m2) |
22.06±3.70 21.76 [20.31, 23.73] |
22.15±2.93 21.88 [20.00, 23.63] |
260 | 0.843 |
| Smoking history | 211 | 0.222 | ||
| Non-smoker | 19 (90.48%) | 176 (92.52%) | ||
| Current smoker | 2 (9.52%) | 5 (2.69%) | ||
| Ex-smoker | 0 (0.00%) | 5 (2.69%) | ||
| Sicca symptom | ||||
| Dry eye | 15 (71.43%) | 223 (93.30%) | 260 | 0.004 |
| Dry mouth | 18 (85.71%) | 227 (94.98%) | 260 | 0.110 |
| Diagnostic items for pSS* | ||||
| Minor salivary gland biopsy | 0 (0.00%) | 215 (89.95%) | 260 | <0.001 |
| Anti-Ro (SSA) Ab | 2 (10.00%) | 185 (84.09%) | 240 | <0.001 |
| Schirmer test | 1 (14.29%) | 169 (72.22%) | 241 | 0.003 |
| Ocular staining score | 0 (0.00%) | 64 (43.24%) | 155 | 0.042 |
| Decreased uSFR | 15 (78.95%) | 78 (82.10%) | 114 | 0.750 |
| uSFR (mL/min) |
0.08±0.10 0.04 [0.02, 0.09] |
0.10±0.19 0.05 [0.00, 0.10] |
107 | 0.856 |
| sSFR (mL/min) |
0.65±0.57 0.44 [0.28, 0.92] |
0.54±1.15 0.20 [0.20, 0.20] |
103 | 0.001 |
| EGMs |
0.38±0.67 0.00 [0.00, 1.00] |
1.08±1.03 1.00 [0.00, 2.00] |
260 | 0.001 |
| ESSDAI |
1.05±2.48 0.00 [0.00, 0.50] |
3.05±3.69 1.00 [0.00, 5.00] |
259 | <0.001 |
| ESSPRI | 4.78±1.57 | 5.41±1.84 | 206 | 0.131 |
| ANA* | 9 (45.00%) | 165 (89.19%) | 205 | <0.001 |
| Titer |
220±560 80 [0,180] |
610±670 400 [160,800] |
204 | <0.001 |
| Anti-La (SSB) Ab | 1 (8.33%) | 112 (51.14%) | 231 | 0.010 |
| RF* | 4 (22.22%) | 125 (65.79%) | 208 | 0.001 |
| Serum level (IU/mL) | 11.95±18.69 | 98.88±206.24 | 208 | <0.001 |
| ACPA (IU/mL) | 0.17±0.28 | 23.19±82.36 | 200 | <0.001 |
| Cryoglobulin | 0 (0.00%) | 7 (4.14%) | 174 | >0.999 |
| β2-microglobulin (μg/mL) |
1.78±0.41 1.72 [1.69, 1.72] |
1.98±0.78 1.92 [1.49, 2.19] |
82 | 0.510 |
| Hypergammaglobulinemia* | 1 (16.67%) | 89 (46.84%) | 196 | 0.221 |
| Serum IgG (mg/dL) |
1395.33±169.22 1322.50 [1280.00, 1476.00] |
1756.57±708.63 1522.50 [1311.00, 2007.00] |
196 | 0.162 |
| Hypocomplementemia* | 1 (5.00%) | 91 (42.92%) | 232 | 0.002 |
| C3 (mg/dL) | 103.25±11.98 | 92.87±16.60 | 232 | 0.007 |
| C4 (mg/dL) |
25.31±0.00 26.90 [20.50, 30.35] |
23.78±13.57 22.35 [18.10, 26.95] |
232 | 0.094 |
| CH50 (U/mL) |
56.35±4.31 56.35 [53.30, 59.40] |
55.30±10.40 55.25 [49.05, 60.40] |
190 | 0.811 |
| WBC count (×109/L) |
6.11±2.21 5.48 [4.64, 6.69] |
5.10±2.08 4.61 [3.90, 5.74] |
249 | 0.017 |
| Leukopenia* | 2 (10.00%) | 61 (26.64%) | 249 | 0.170 |
| ANC count (×109/L) |
3.57±1.51 3.21 [2.36, 4.49] |
2.90±1.85 2.52 [1.90, 3.30] |
247 | 0.010 |
| Neutropenia* | 0 (0.00%) | 20 (8.81%) | 247 | 0.384 |
| Hb (g/dL) |
13.33±0.79 13.30 [12.60, 13.90] |
12.78±1.19 12.90 [12.00, 13.70] |
249 | 0.051 |
| Hct (%) |
40.36±2.68 40.25 [38.65, 41.95] |
41.33±33.75 38.60 [36.10, 40.60] |
249 | 0.008 |
| Anemia* | 0 (0.00%) | 52 (22.71%) | 249 | 0.010 |
| Platelet count (×109/L) |
225.60±60.25 233.00 [185.50, 267.50] |
225.39±54.23 219.00 [187.00, 260.00] |
249 | 0.725 |
| Thrombocytopenia* | 2 (10.00%) | 14 (6.11%) | 249 | 0.375 |
| ESR (mm/hr) |
9.38±10.33 7.00 [5.00, 11.00] |
28.96±21.43 24.00 [13.00, 38.50] |
244 | <0.001 |
| CRP (mg/dL) |
0.11±0.15 0.05 [0.03, 0.12] |
0.31±1.28 0.07 [0.03, 0.28] |
243 | 0.274 |
| AST (IU/L) |
21.85±7.23 21.00 [17.50, 23.00] |
25.63±30.59 22.00 [18.00, 26.00] |
247 | 0.333 |
| ALT (IU/L) |
23.85±8.38 23.00 [18.00, 27.50] |
20.82±15.62 17.00 [13.00, 23.00] |
247 | 0.006 |
| BUN (mg/dL) |
13.02±3.41 12.80 [10.95, 15.15] |
12.99±4.14 12.20 [10.20, 15.10] |
244 | 0.596 |
| Cr (mg/dL) |
0.73±0.11 0.71 [0.68, 0.78] |
0.73±0.14 0.71 [0.65, 0.80] |
245 | 0.887 |
| CPK (IU/L) |
76.33±29.97 70.00 [61.00, 88.00] |
94.92±199.38 69.00 [51.00, 96.00] |
223 | 0.873 |
| LDH (IU/L) |
361.11±161.37 364.00 [180.00, 444.00] |
315.16±125.93 316.50 [216.00, 393.00] |
230 | 0.195 |
| Fasting glucose (mg/dL) |
106.95±26.51 100.50 [93.00, 106.00] |
96.16±24.98 92.00 [88.00, 99.00] |
245 | 0.004 |
| Total cholesterol (mg/dL) | 189.37±37.42 | 172.78±33.07 | 238 | 0.039 |
| HDL (mg/dL) |
50.20±15.09 43.00 [40.00, 58.00] |
53.17±15.59 52.00 [41.00, 61.00] |
173 | 0.657 |
| LDL (mg/dL) |
103.06±34.94 104.50 [81.00, 129.00] |
102.09±25.43 100.00 [82.00, 116.00] |
206 | 0.755 |
| Triglyceride (mg/dL) |
111.53±58.64 97.00 [64.50, 161.50] |
98.89±53.07 87.00 [67.00, 119.00] |
212 | 0.439 |
| Free T4 (ng/dL) |
1.25±0.24 1.22 [1.14, 1.28] |
1.17±0.30 1.10 [0.99, 1.27] |
181 | 0.061 |
| TSH (μIU/mL) |
2.39±1.67 2.06 [1.30, 3.07] |
2.52±2.08 2.70 [1.27, 3.12] |
193 | 0.989 |
| Albuminuria | 0 (0.00%) | 19 (8.64%) | 232 | 0.606 |
| Hematuria | 3 (23.08%) | 37 (16.82%) | 233 | 0.472 |
In both groups, significant differences were observed in terms of sex and age at the time of diagnosis, with no consideration for interactions between these variables and others in this table. The results expressed with mean±standard deviation in continuous variable with normality. In case of non-normal variables with failure to normality test, additional median (25% quantile, 75% quantile) was also presented. Categorical variables are shown as number (percentile). P-value less than 0.05 was set to be statistically significant. CSS: chronic sclerosing sialadenitis, pSS: primary Sjögren’s syndrome, N: numbers, BMI: body mass index, uSFR: unstimulated salivary flow rate, sSFR: stimulated salivary flow rate, EGMs: extraglandular manifestations, ESSDAI: EULAR Sjögren's syndrome disease activity index, ESSPRI: EULAR Sjögren’s syndrome patient-reported index, EULAR: European Alliance of Associations for Rheumatology, ANA: anti-nuclear antibody, RF: rheumatoid factor, ACPA: anti-cyclic citrullinated peptide antibody, C3: complement 3, C4: complement 4, CH50: 50% hemolytic complement, WBC: white blood cell count, ANC: absolute neutrophil count, Hb: hemoglobin, Hct: hematocrit, ESR: erythrocyte sedimentation rate, CRP: C-reactive protein, AST: aspartate transaminase, ALT: alanine transaminase, BUN: blood urea nitrogen, Cr: creatinine, CPK: creatine phosphokinase, LDH: lactate dehydrogenase, HDL: high-density lipoprotein, LDL: low-density lipoprotein, TSH: thyroid stimulating hormone. *Only counted in case of excessing cut-off value or positivity result.
Table 3
Even when considering CSS as indicative of pSS, it is evident that there are differences in various clinical manifestations and autoimmune profiles between the two. The results were demonstrated as mean±standard deviation for continuous variables that exhibited a normal distribution. For non-normally distributed variables, median (25th percentile, 75th percentile) values were included. Categorical variables were represented as counts (percentages). Statistical significance was considered at a p-value below 0.05. CSS: chronic sclerosing sialadenitis, pSS: primary Sjögren’s syndrome, N: numbers, BMI: body mass index, uSFR: unstimulated salivary flow rate, EGMs: extraglandular manifestations, ESSDAI: EULAR Sjögren's syndrome disease activity index, ESSPRI: EULAR Sjögren’s syndrome patient-reported index, EULAR: European Alliance of Associations for Rheumatology, ANA: anti-nuclear antibody, RF: rheumatoid factor, ACPA: anti-cyclic citrullinated peptide antibody, sSFR: stimulated salivary flow rate.
Table 4
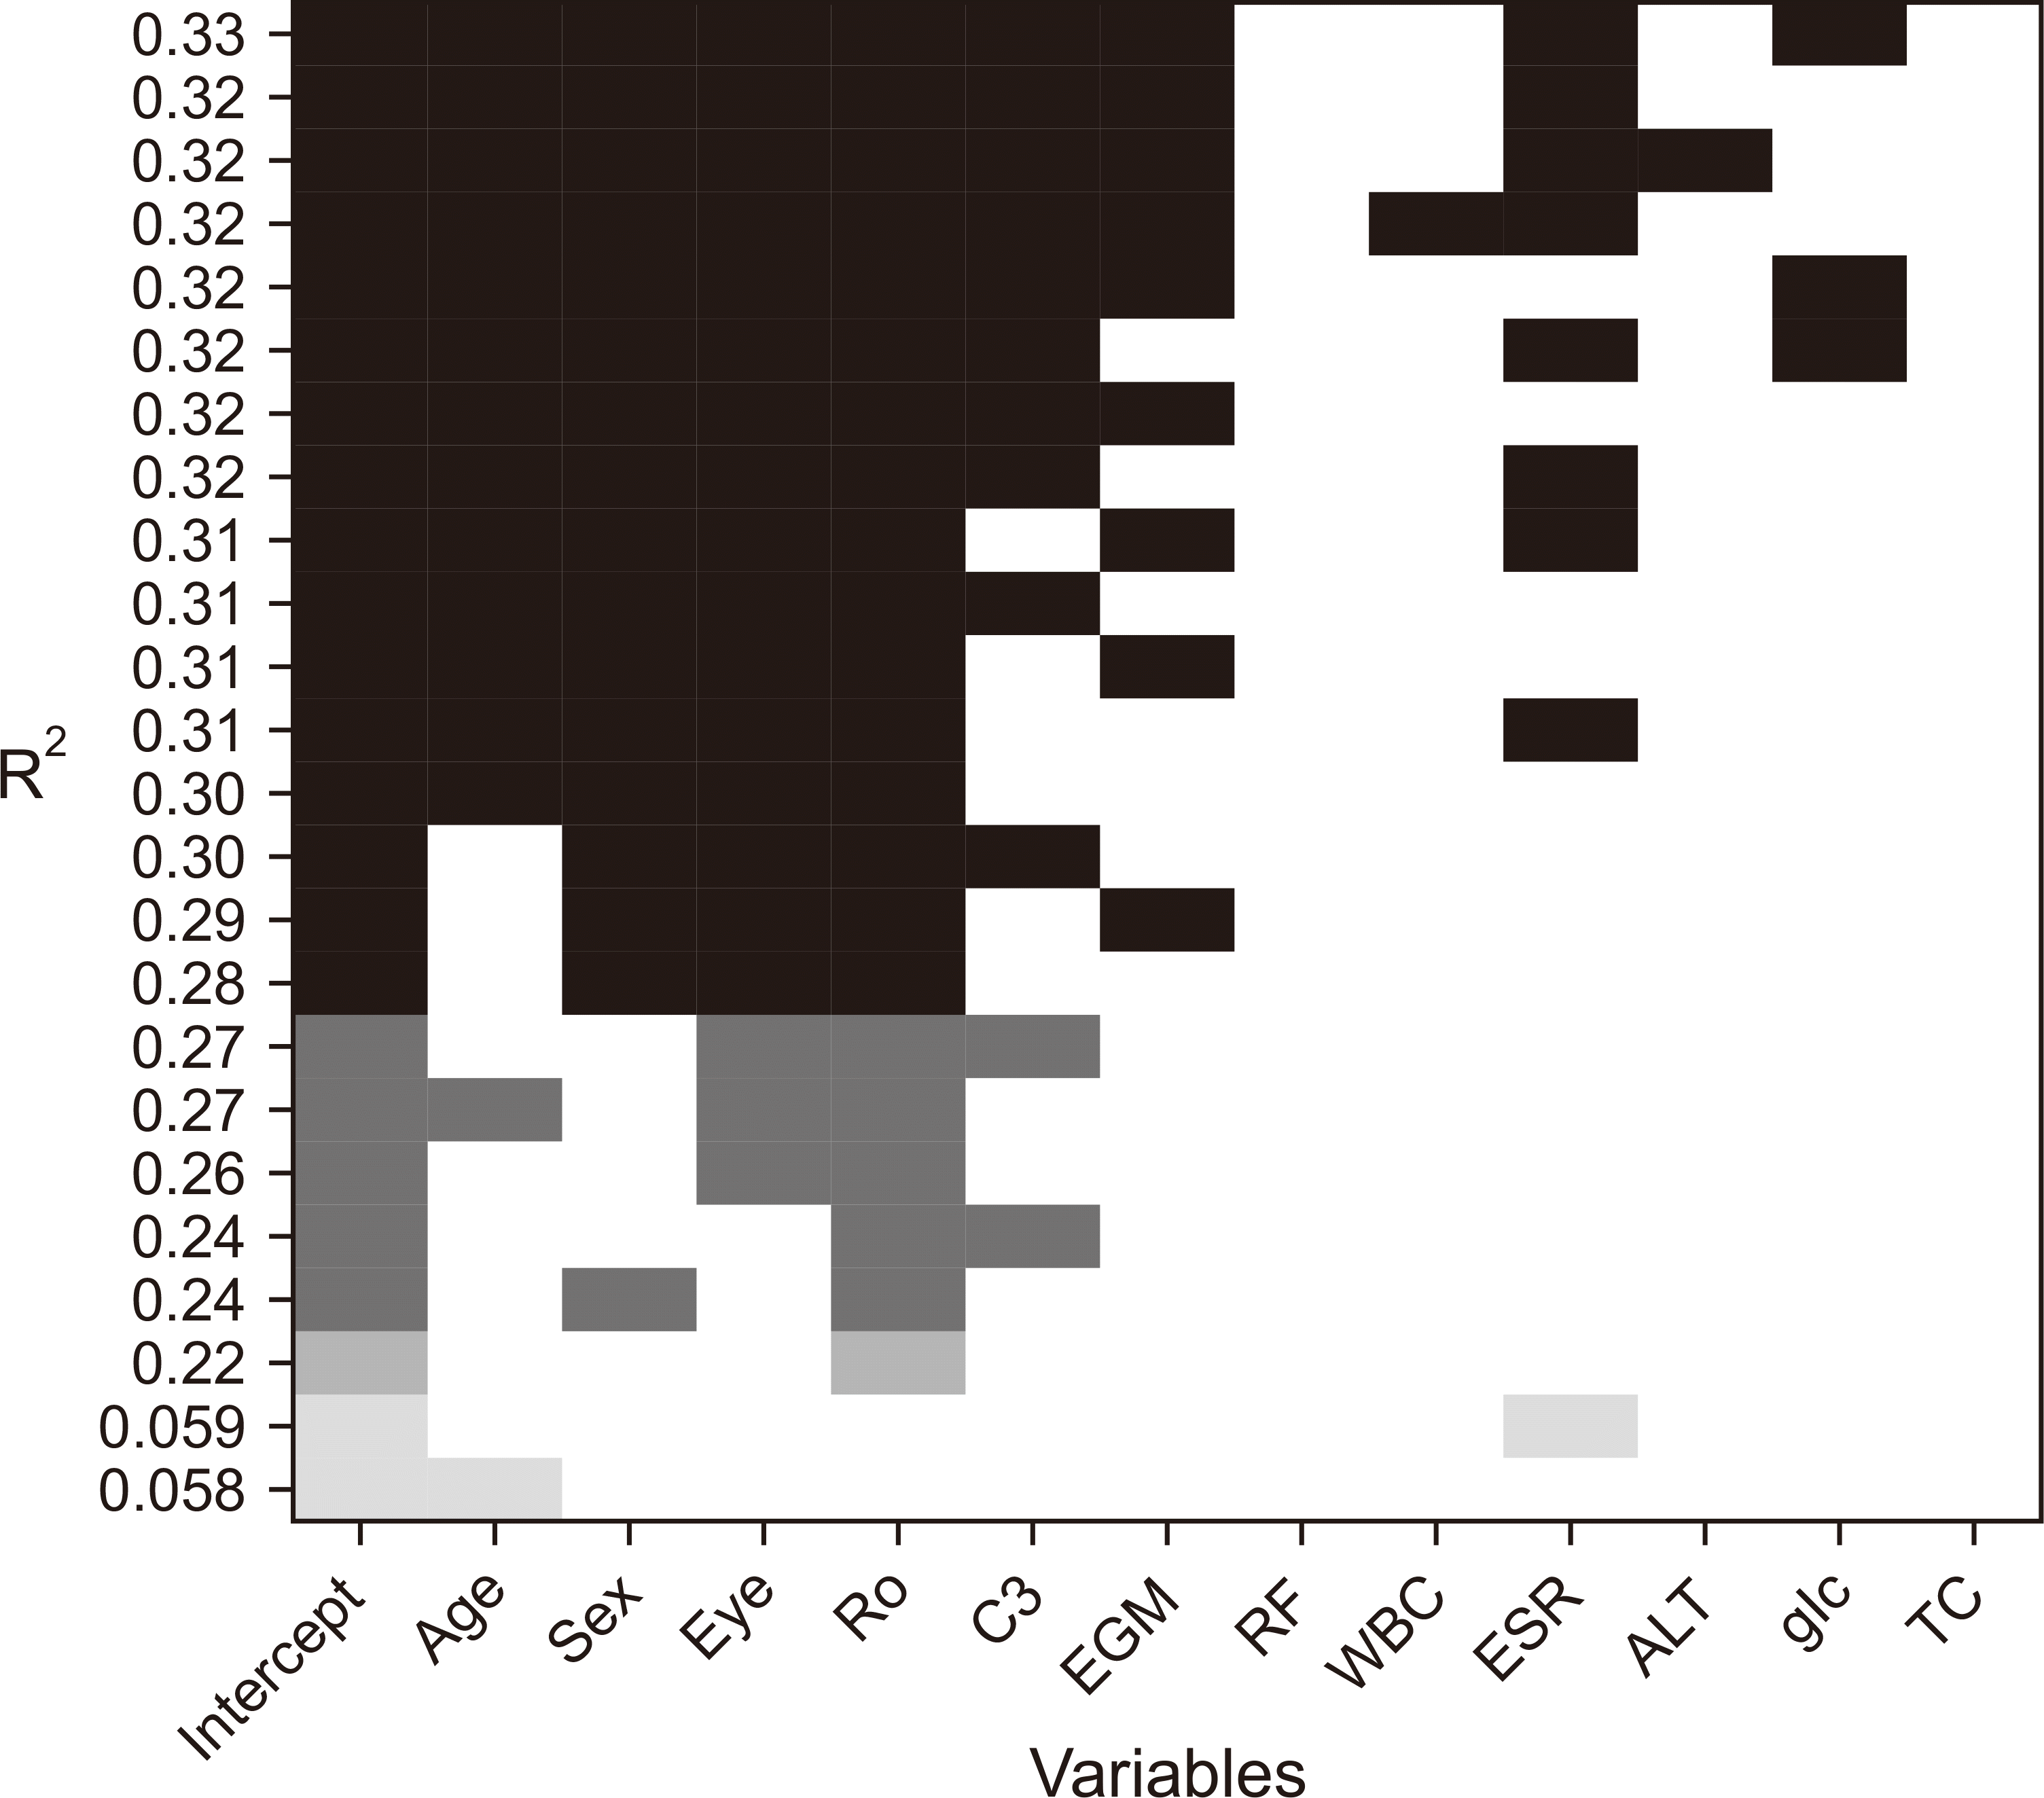
The final logistic regression analysis present significant differences in characteristics of CSS from pSS. CSS: chronic sclerosing sialadenitis, pSS: primary Sjögren’s syndrome, SE: standard error, z: z-score, OR: odd ratio, LCL: lower confidence limit, UCL: upper confidence limit, VIF: variation inflation factor, C3: complement 3, ESR: erythrocyte sedimentation rate.


 PDF
PDF Citation
 Print
Print


 XML Download