INTRODUCTION
Temporomandibular disorders (TMDs) are a group of disorders originating from the musculoskeletal structure of the masticatory system, with a prevalence of up to 43% in adults.
1 TMDs affect different oral and maxillofacial structures, including the masticatory muscles, temporomandibular joint (TMJ), and articular disc.
2 Clinical symptoms of TMDs include pain, clicking, popping, limited opening, deviation of the mandible on mouth opening and closing, headaches, earaches, muscle tenderness, and malocclusion.
3 Although the etiology of TMDs remains unclear, five etiologic factors have been supported by research, including occlusal condition, trauma, emotional stress, deep pain input, and parafunctional activity.
4 Among these, the occlusal condition considerably influences the joints through two main mechanisms. First, acute changes in the occlusal condition can result in joint disorders by causing occlusal highs or premature contact, inducing pain during tooth contact, and prompting protective muscle co-contraction. TMD symptoms may develop with persistence of these acute changes. Second, occlusal changes can affect joint position. The occlusal condition can induce instability in the joint position, causing the condyle and articular disc to not be in the corresponding position. Consequently, the internal load of the joint increases, potentially resulting in TMD.
4 Establishing a definitive link between specific malocclusions and significant TMD symptoms remains challenging,
5-8 and some studies suggest that orthodontic treatment does not typically cause TMD.
6,7
Cone-beam computed tomography (CBCT) has become an indispensable diagnostic tool for evaluating the joint position and morphology. However, its high radiation dose limits its use as a monitoring and screening tool, primarily in orthodontic treatment. Furthermore, dynamic evaluation of joint function is essential because the TMJ is a ginglymo-arthrodial joint. CBCT provides static images and does not completely enable joint functional evaluations. Therefore, a fast, non-invasive, radiation-free, and dynamic method is required to monitor and screen joints during orthodontic treatment.
Joint Vibration Analysis (JVA) and Jaw Tracker (JT) serve as evaluation tools for dynamic joint and mandibular functions. JVA is a device that detects internal vibrations in joints. In normal joints, the vibration is minimal (< 20 PaHz). When a lesion is present inside a joint, the internal vibration of the joint increases. During clinical examinations, TMJ vibrations are often assessed through palpation or auscultation. However, these two methods are influenced by the subjectivity of the operator.
9 JVA can determine the health status of a joint based on the amplitude of internal vibration within the joint.
10 Different pathological stages of discs have different vibration frequencies.
11 JT is a device for magnetic tracking and recording of mandibular movements. It records the size, speed, and direction of the mandibular opening and closing and lateral movement through a recording module placed in the lower anterior teeth area, thereby revealing the dynamic function of the joint and its adaptation to TMDs.
12 According to research, patients with TMDs exhibit significant differences in mandibular range of motion (ROM) compared to healthy individuals.
13 The range of mandibular movement can be used to distinguish between asymptomatic individuals and patients with TMDs. Muscle pain, muscle spasms, joint pain, and/or disc displacement lead to limited mandibular mobility.
14 These methods offer fast, non-invasive, and radiation-free means of assessing joint function. Therefore, this study aimed to correlate TMJ morphology and position using CBCT, JVA, and JT to provide a radiation-free and dynamic method for screening and monitoring TMJ morphology and position in orthodontic patients.
RESULTS
Multiple mixed logistic regression analyses revealed no correlation between the JT and JVA measurements and abnormal condylar surface morphology (
Tables 3 and
4). However, cut-off values were calculated to distinguish between normal and abnormal condylar surface morphologies in the JT and JVA measurements (
Tables 3 and
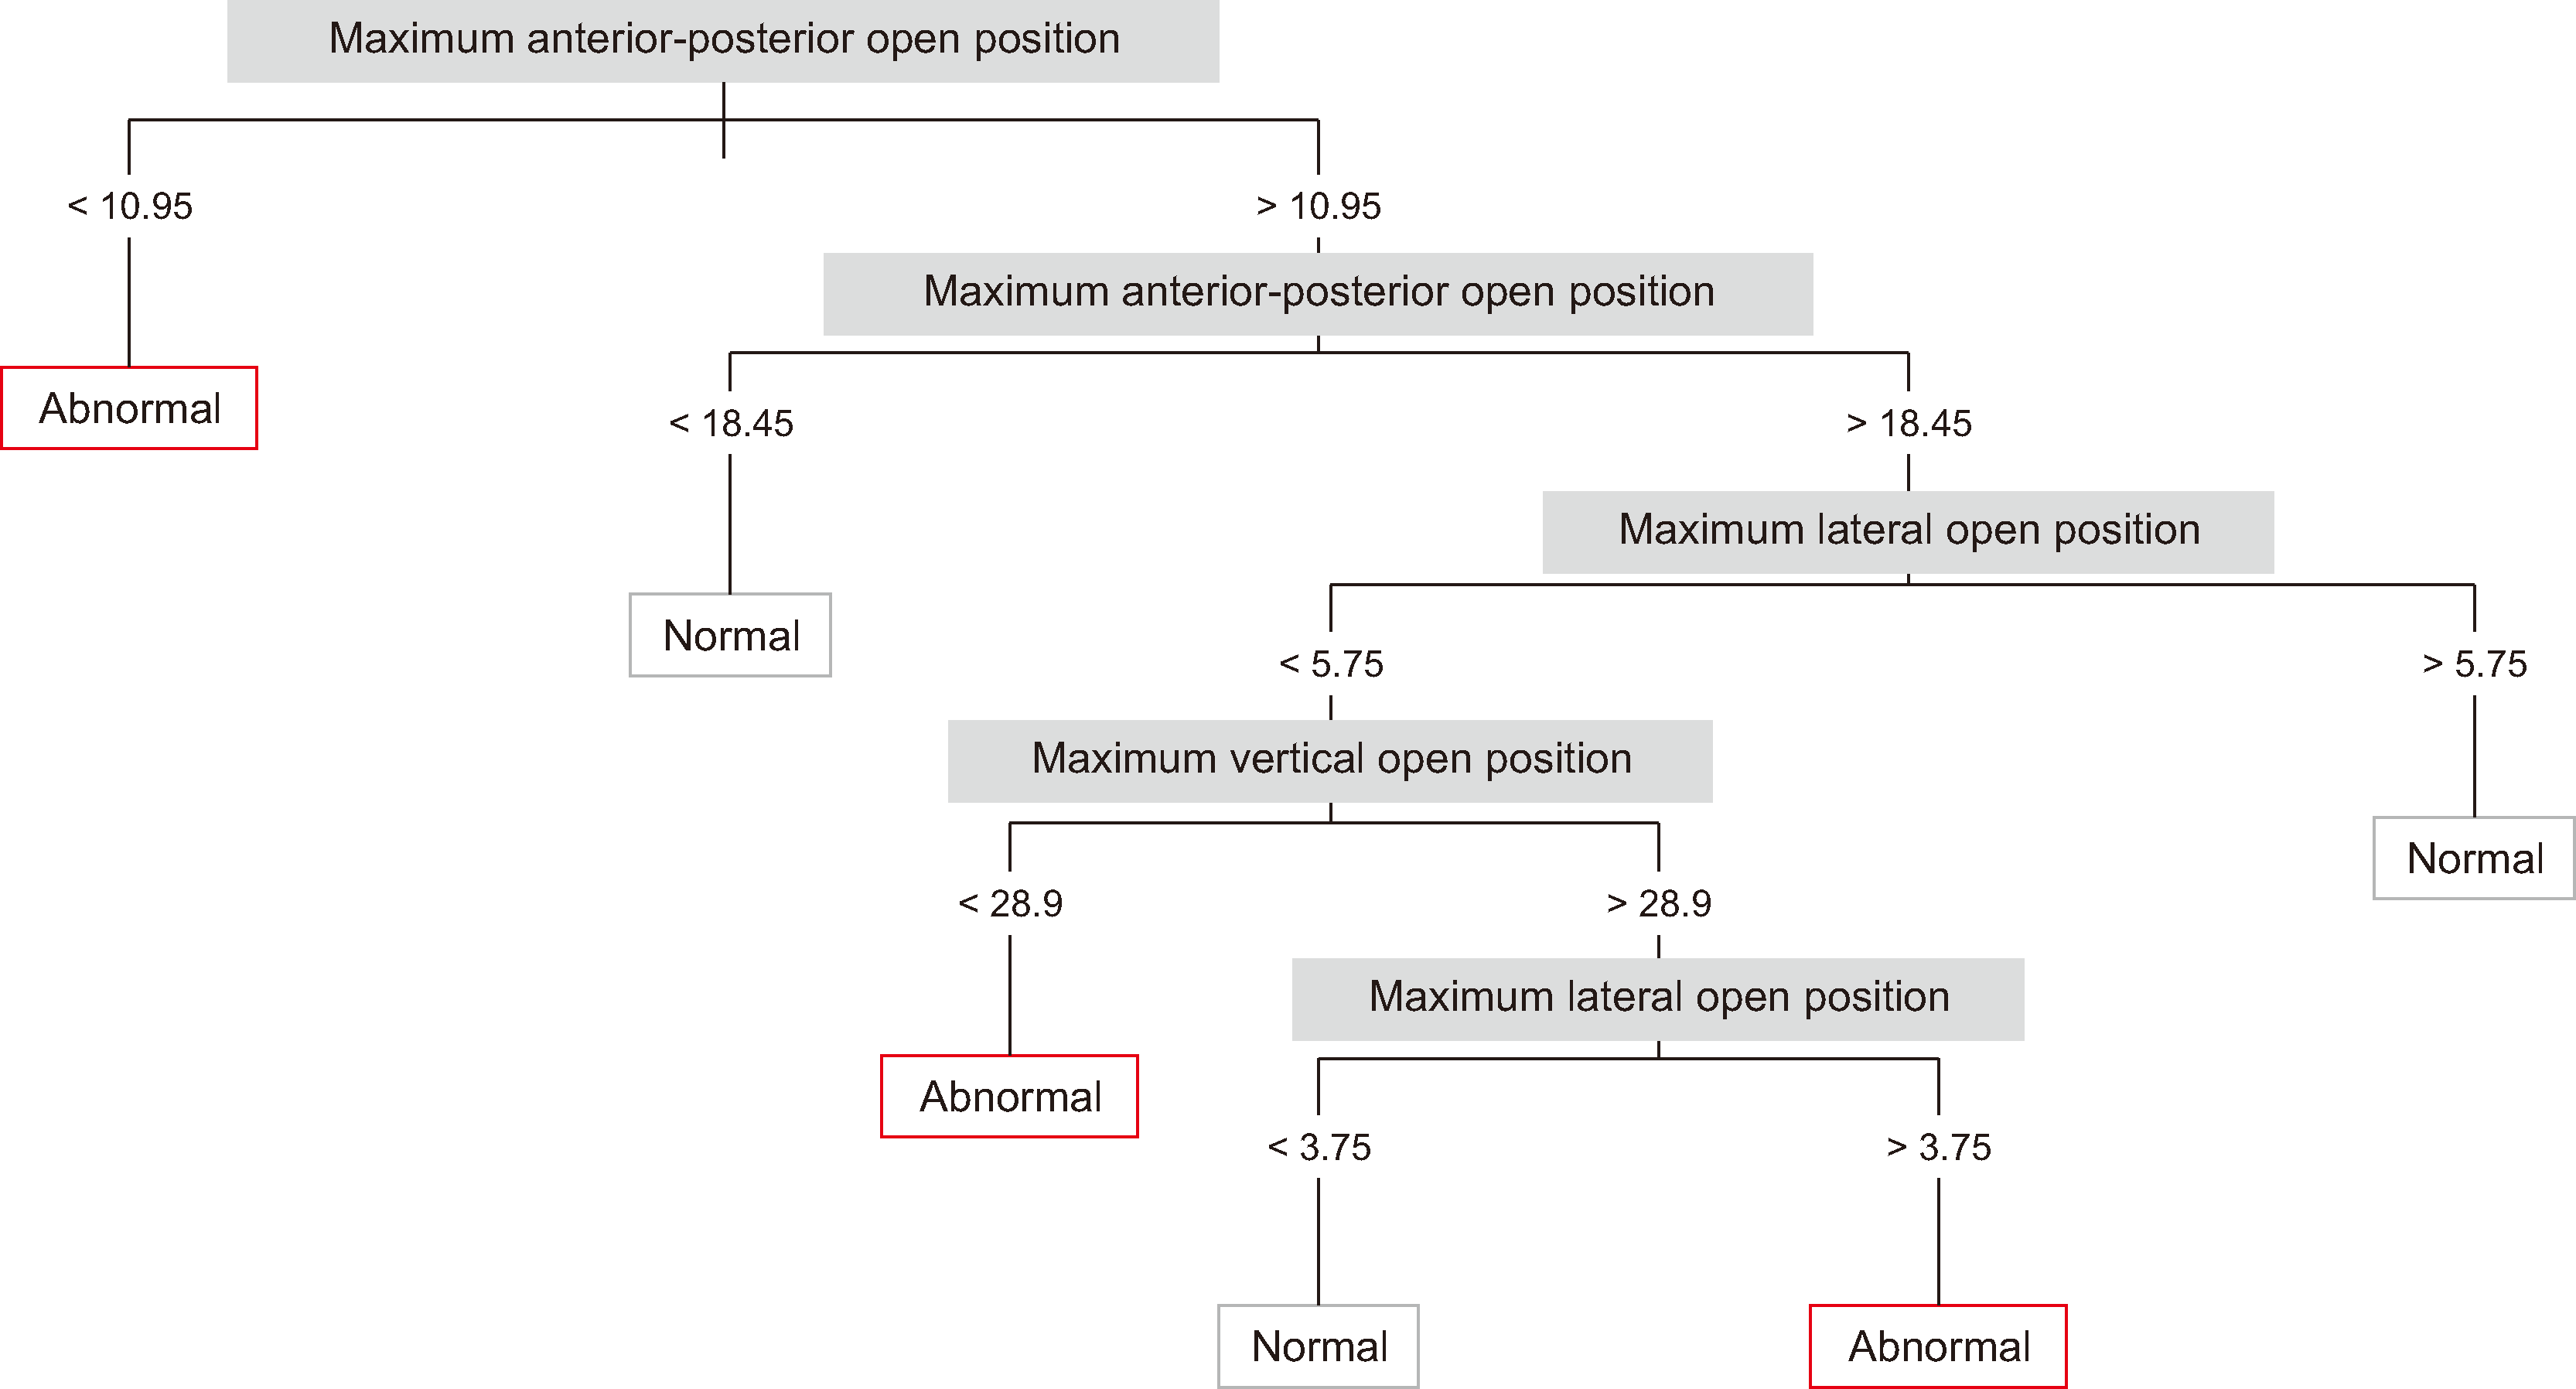
4). The cut-off value results showed that when the multiple measurements were grouped (maximum anteroposterior open position, maximum vertical open position, and maximum lateral open position) within a certain range (
Figure 6), a 300/< 300 Hz ratio ≥ 0.09 suggested abnormal condylar surface morphology, with an area under the curve (AUC) of 0.54 (
P < 0.05;
Table 3). Additionally, it indicated that the surface morphology of the condyle was abnormal, and the AUC was 0.81 (
P < 0.001;
Table 4).
The correlation results between joint position, morphology (condylar height, width, and axial angle), and JVA and JT measurements are shown in
Tables 5,
6, and 7. In the correlation of JVA measurements (
Tables 5 and
7), the > 300/< 300 Hz ratio and median frequency showed statistically significant negative correlations with the MJS. The > 300/< 300 Hz ratio and median frequency decreased with an increase in the MJS. The total integral, integral < 300 Hz, and peak amplitude were negatively correlated with the LJS, with statistical significance. The total integral, integral < 300 Hz, and peak amplitude decreased with increasing LJS. The peak frequency was negatively correlated with the SSJS with a statistical significance. The peak frequency decreased with an increase in SSJS. For correlations of condylar height, width, and axis angle, total integral, integral < 300 Hz, integral > 300 Hz, and peak amplitude had positive correlations with condylar height (
P < 0.05); these measurements increased with the increase in condylar height. The total integral and integral < 300 Hz were positively correlated with condylar width (
P < 0.05). The total integral and integral < 300 Hz increased with an increase in the condylar width. The > 300/< 300 Hz ratio had a negative correlation with the condylar axis angle (
P < 0.01); the > 300/< 300 Hz ratio decreased with an increase in the condylar axis angle.
According to the results (
Tables 6 and
7), in the JT measurements, the maximum opening velocity was negatively correlated with the CSJS and SSJS, with statistical significance. The maximum opening velocity decreased with increasing CSJS and SSJS. The maximum vertical open position was significantly negatively correlated with the LJS. The maximum vertical open position decreased with an increase in the LJS. For condylar height, width, and axis angle, a positive correlation was observed between the maximum vertical open position and condylar width (
P < 0.01). The maximum vertical open position increased with an increase in condylar width. The lateral to left position during maximum active lateral mouth opening had a negative correlation with condylar height (
P < 0.01), which decreased as condylar height increased.
Regression equations were derived using multiple mixed and generalized linear models to establish the relationships between JT and JVA measurements and joint position and morphology parameters, as shown in
Table 7.
DISCUSSION
The diagnosis of TMD depends on history and clinical examination, according to the latest diagnostic criteria for TMD (DC/TMD).
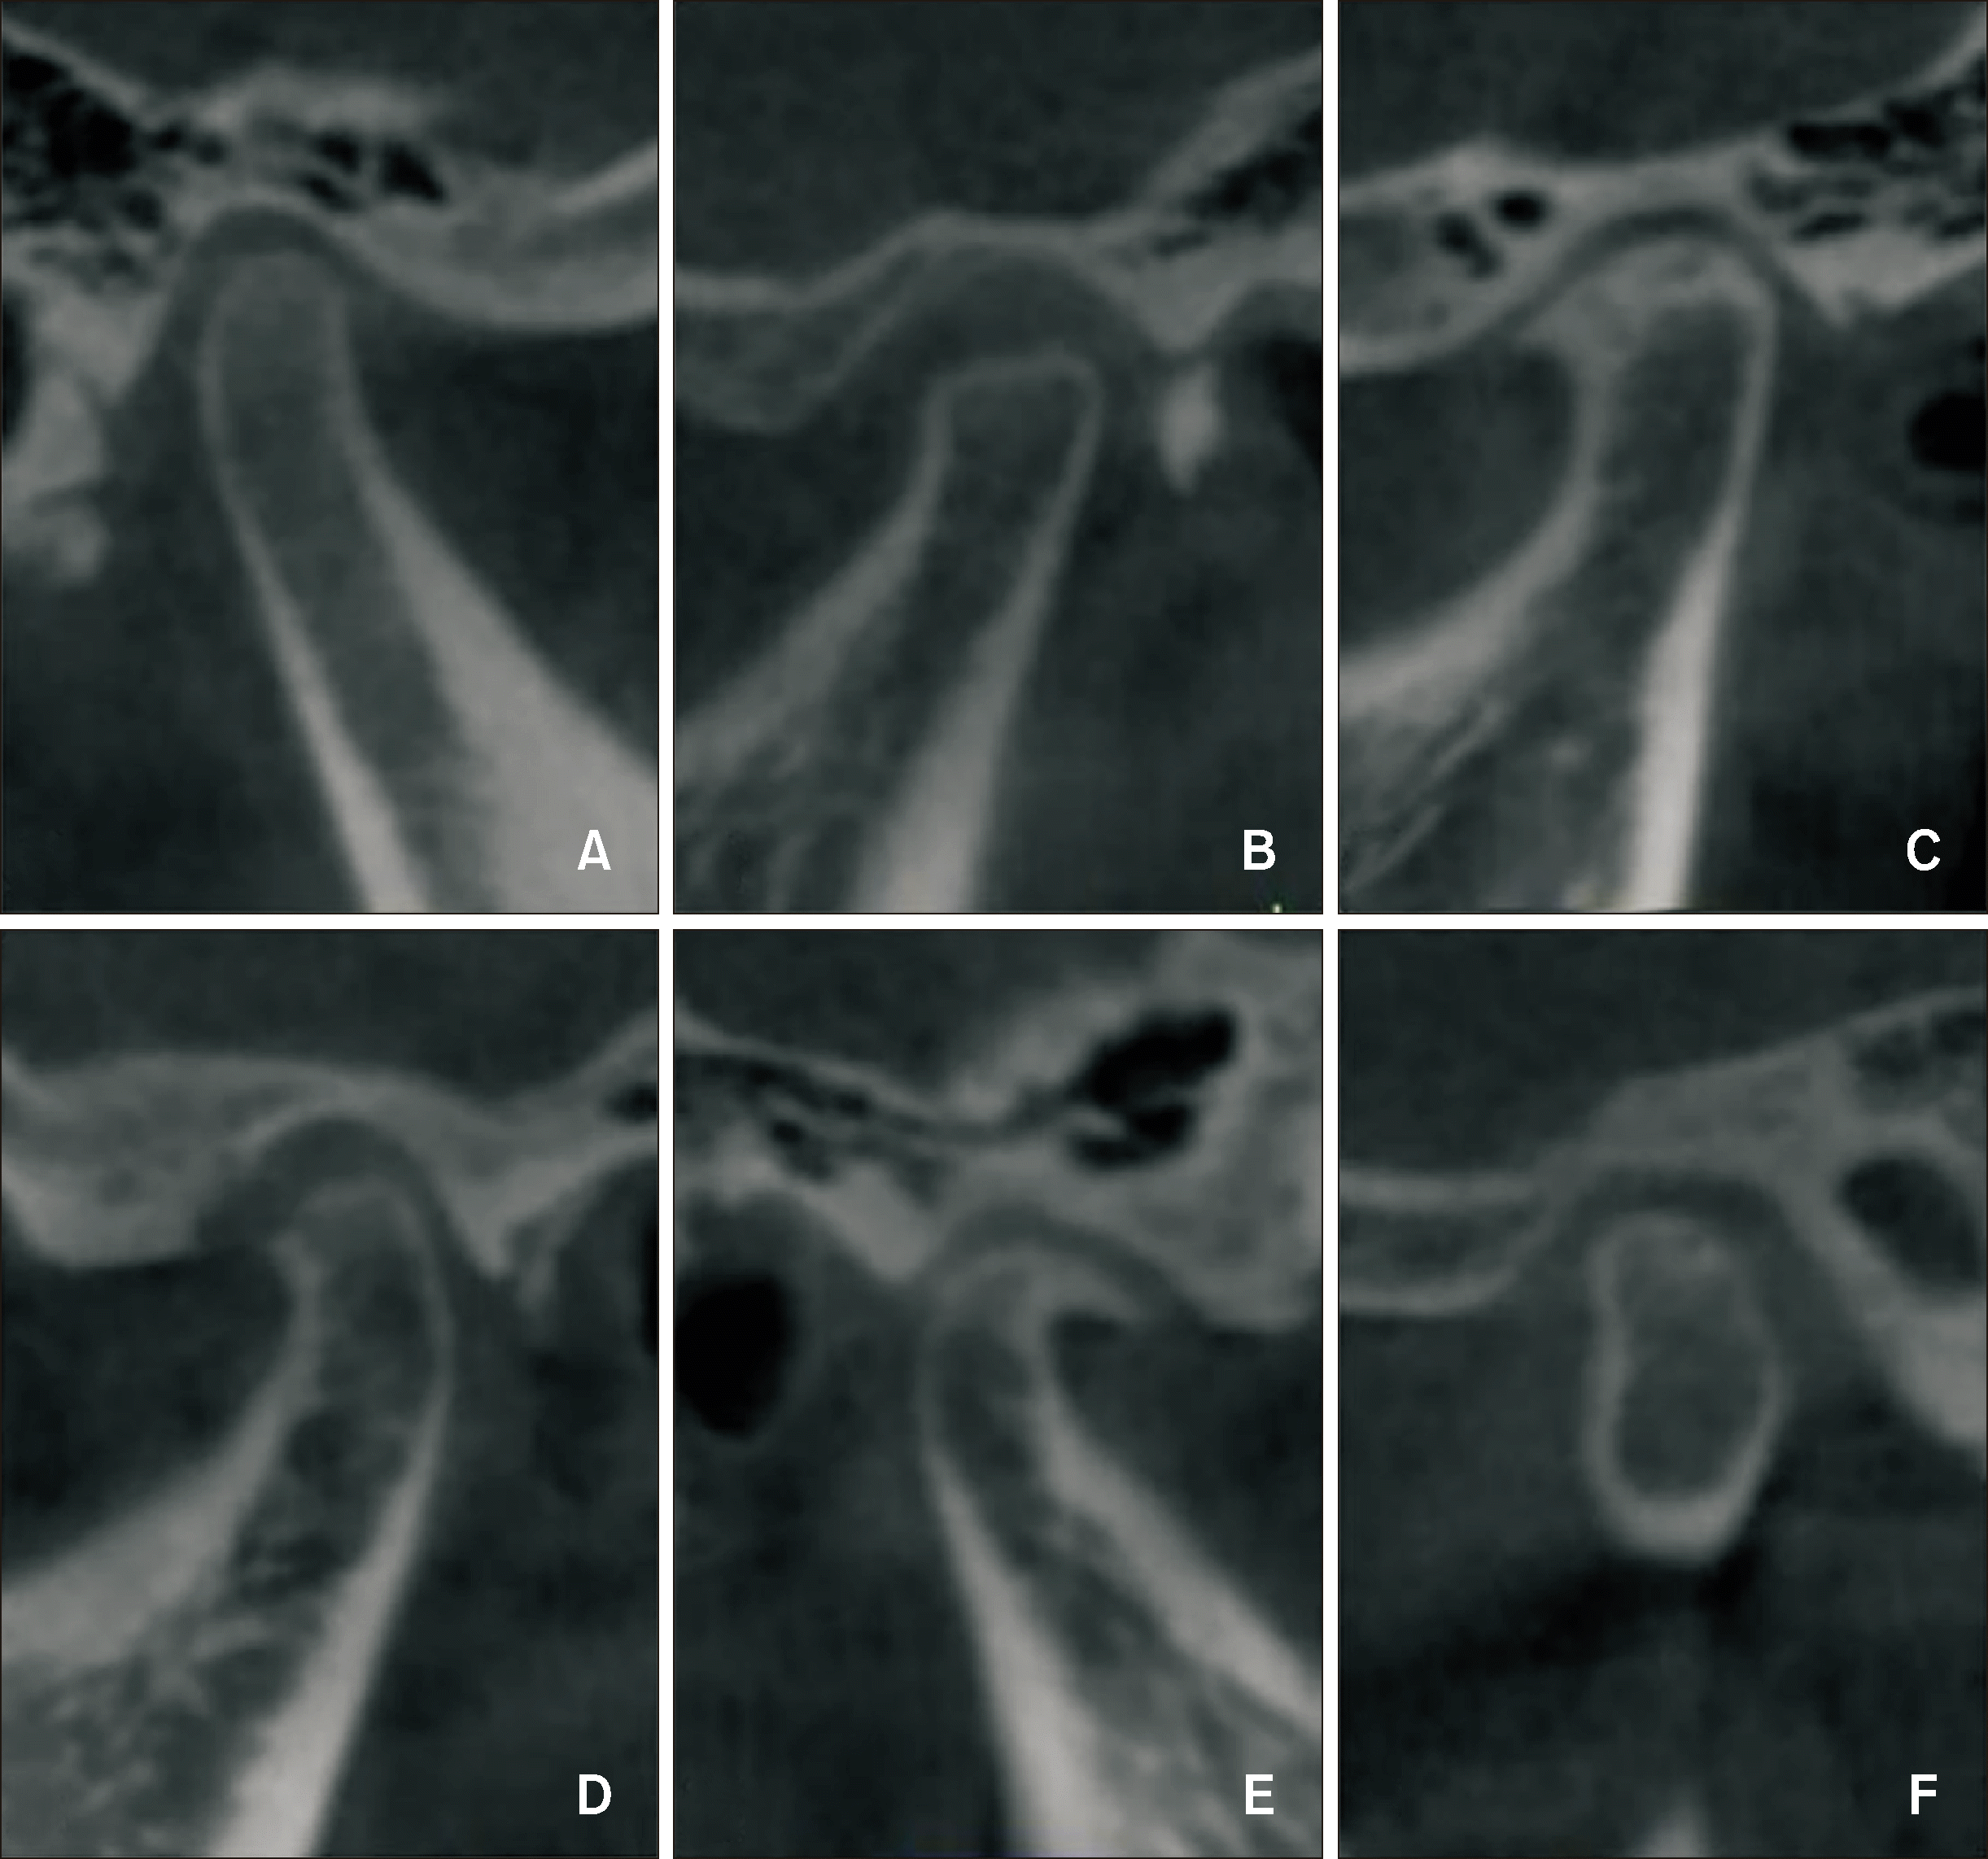
15 However, the sensitivity of diagnosing certain types of TMD based solely on clinical symptoms is low, necessitating further confirmatory methods. CBCT is considered the gold standard for diagnosing morphological changes in the TMJ. However, its high radiation dose limits its use as a screening tool, particularly in asymptomatic patients. Therefore, a fast, non-invasive, and radiation-free method is required to monitor and screen joint morphology and position in patients without symptoms or history. In this study, we evaluated condylar surface morphology based on the latest DC/TMD diagnostic criteria for joint degenerative changes.
11 Despite factors such as aging and remodeling potentially causing flattening and cortical sclerosis, our study aimed to evaluate condylar surface morphology without age limitations, including these factors in the evaluation criteria.
We found no correlation between the JT measurements and abnormal condylar surface morphology in the JT or joint morphology correlation results. However, we investigated the cut-off values of the JT measurements and found that specific ranges of the maximum anteroposterior open position, maximum vertical open position, and maximum lateral open position indicated a high likelihood of abnormal condylar surface morphology. Quantifying the mandibular boundary motion and condylar rotation and translation is clinically relevant for assessing the presence, severity, and post-treatment outcomes of TMDs.
16
ROM is a crucial indicator for evaluating mandibular motion and function, influenced by extracapsular and intracapsular joint structures. Dysfunction of the extracapsular structures is primarily attributed to muscle problems. Reduced blood flow to the masticatory muscles due to vasoconstriction caused by muscle hyperactivity can impede nutrient and metabolite transport, which can result in byproduct accumulation, thereby triggering pain.
17 Intracapsular structures are mainly affected by the joint capsule structure, including the disc position and the bony structure of the joint. Displacement of the disc affects condylar movement, which is reflected in the movement of the mandible.
18,19 Our study revealed that mandibular ROM is affected by abnormalities in the condylar surface morphology. Animal experiments have demonstrated that changes in joint degeneration result in reduced ROM in the condyles and incisors.
20 Additionally, previous studies have found a negative correlation between condylar flattening and sclerosis in patients with osteoarthritis, indicating that changes in condylar morphology may deteriorate masticatory efficiency.
21 These findings emphasize the impact of joint degeneration on mandibular function. Understanding the condylar morphology is crucial for assessing masticatory efficiency and jaw movement. Changes in the condylar surface morphology typically begin with fibrosis and cracking of the articular cartilage, progressing to erosion and direct contact between the condyle and glenoid fossa. This can cause pain due to bone-to-bone contact, leading to functional degradation and ultimately affecting jaw movement.
22 Consequently, the association between the maximum anteroposterior open position, maximum vertical open position, and maximum lateral open position with the condyle abnormal surface becomes apparent.
Our study revealed correlations between condylar height, width, and axis angle and mandibular motion range and velocity. Previous research reported that the maximum mandibular opening was affected by the mandibular body height and mandibular length and angle.
23 Moreover, a correlation was found between maximum mandibular opening and condylar movement.
24 The complex movement pattern of the TMJ, involving rotation and translation, complicates direct measurement during movement.
25 Changes in condylar width, height, and axial angle may affect the condylar path, subsequently affecting ROM.
Additionally, our findings suggest that joint position influences mandibular ROM and velocity, consistent with the findings of previous studies.
18,19 Patients with internal derangement exhibit varying effects on mouth opening depending on the severity, as altered disc position affects condylar position and subsequent mouth opening. Additionally, internal derangement influences movement velocity,
26 with symptomatic patients demonstrating slower chewing and longer chewing cycles than do asymptomatic patients.
In our study, no correlation was observed between the JVA measurements and abnormal condylar surface morphology. A statistically significant difference was observed in the cut-off value of the > 300/< 300 Hz ratio; however, the AUC was relatively low (0.54), indicating limited reliability. The vibration source may originate from abnormal positional relationships between the disc and condyle,
27 hyperfunctioning lateral pterygoid muscles,
28 ligament stretching,
29 or irregularities in the articular surfaces. Under normal conditions, the disc adapts to the shapes of the condyle and fossa, thereby reducing joint obstruction during movement, with minimal vibration. The presence of synovial fluid between the articular surface and the disc minimizes friction during joint movement, resulting in minimal vibration within the joint during normal activities. However, an abnormal surface morphology increases the vibration amplitude, surpassing that of a normal joint. The vibration frequency reflects the joint adaptability to the environment. Joints that can adapt better exhibit lower vibration frequencies, whereas joints that cannot adapt exhibit higher vibration frequencies. The patients selected for this study were asymptomatic; therefore, they likely possessed better joint adaptability and lower vibration frequencies inside the joints. Consequently, no correlation was found with abnormal condylar surface morphology.
Moreover, our study discovered that the condylar height, width, and axial angle influence internal vibration. The total integral, integral < 300 Hz, integral > 300 Hz, and peak amplitude increased with increasing condylar height and width, whereas the > 300/< 300 Hz ratio decreased with increasing condylar axis angle. This finding underscores the impact of the joint morphology on internal joint vibrations, and further research is required.
Regarding the correlation between joint position and JVA measurements, the > 300/< 300 Hz ratio and median frequency of JVA measurements were negatively correlated with the MJS. The position of the condyle is affected by various factors, including occlusal interference, disc position, excessive joint effusion, degenerative joint disease, orthodontic treatments, and surgery,
30-32 which ultimately affect the joint space.
The median frequency is the midpoint of the frequency range. A decreased vibration frequency inside the joint indicates better adaptation to the internal pressure, resulting in a decreased median frequency. Conversely, an increase in the > 300/< 300 Hz ratio suggests acute symptoms or inadequate adaptation to the internal environment. A decreasing ratio indicated that the joint gradually became chronic or adapted to the internal environment. Stress is primarily concentrated on the anterior and medial slopes of the condyle during movement, resulting in vibrations in these areas. A reduced MJS implies a failure to maintain the distance between the condyle and fossa, causing the joint to struggle to adapt internally, resulting in increased internal pressure, median frequency, and > 300/< 300 Hz ratio.
Similarly, the total integral, integral < 300 Hz, peak amplitude, and peak frequency reflected the magnitude of the vibration within the joint. The total integral gauges internal vibration levels and serves as an evaluation parameter for joint vibration. An integral of < 300 Hz indicates vibrations below 300 Hz, which are typically attributed to soft tissues. The peak amplitude and frequency indicated the high-frequency vibration and joint adaptability, with decreased values suggesting internal environmental stabilization. Normal joint spaces maintain internal environmental stability, whereas decreased joint spaces compress the internal tissues. An abnormal joint shape or position and increased internal vibration occur when the joint cannot adapt to the internal pressure. This explains why these indices were negatively correlated with the joint space in this study.
Our purpose was to offer a fast, non-invasive, dynamic, and radiation-free screening and monitoring method for joint morphology and position in patients without symptoms or history. This method is not intended to replace CBCT, which remains the gold standard for diagnosing joint morphology and position with high reliability. Changes in joint morphology and position alone do not necessarily indicate the presence of TMD, and clinical symptoms, medical history, and imaging examinations are required to confirm this diagnosis.
JVA and JT serve as complementary diagnostic tools and may be particularly useful for screening asymptomatic patients at risk of TMD due to abnormalities in joint morphology and position. Utilizing the regression equations and cut-off values provided in this study enables clinicians to estimate the likelihood of abnormal joint morphology and the size of the joint space based on JVA and JT measurements. Therefore, in clinical practice, these methods can provide valuable preliminary insights into patients without joint symptoms or a history of suspected changes in joint morphology and position. This information can guide further diagnostic decisions, such as whether to proceed with CBCT or other imaging modalities to confirm the diagnosis and plan appropriate treatment strategies. In this study, we aimed to develop a tool that can complement CBCT for screening the morphology and position of the TMJ during clinical diagnosis and treatment. It applies equally to individuals of all ages and genders during diagnosis and treatment. Therefore, in this study, the groups were not compared based on age and gender.
This study has the inherent limitations of a cross-sectional design, and longitudinal studies with larger sample sizes could help improve screening and diagnostic protocols by assessing how joint morphology changes over time and with treatment.


 PDF
PDF Citation
 Print
Print


 XML Download