ACKNOWLEDGEMENTS
Notes
AUTHOR CONTRIBUTIONS
Park KS and Kim JS had full access to all the data in the study and take responsibility for data integrity and the accuracy of data analysis. Conceptualization: Yoon SY, Park KS, and Kim JS; Methodology: Yoon SY, Park KS, and Kim JS; Investigation: Yoon SY, Park KS, and Kim JS; Visualization: Yoon SY, Park KS, and Kim JS; Supervision: Yoon SY, Park KS, and Kim JS; Writing – original draft: Yoon SY, Park KS, and Kim JS; Writing – review & editing: Yoon SY, Park KS, and Kim JS. All authors have read and approved the final manuscript. The corresponding authors attest that all listed authors meet the authorship criteria and that no other author meeting the criteria has been omitted.
References
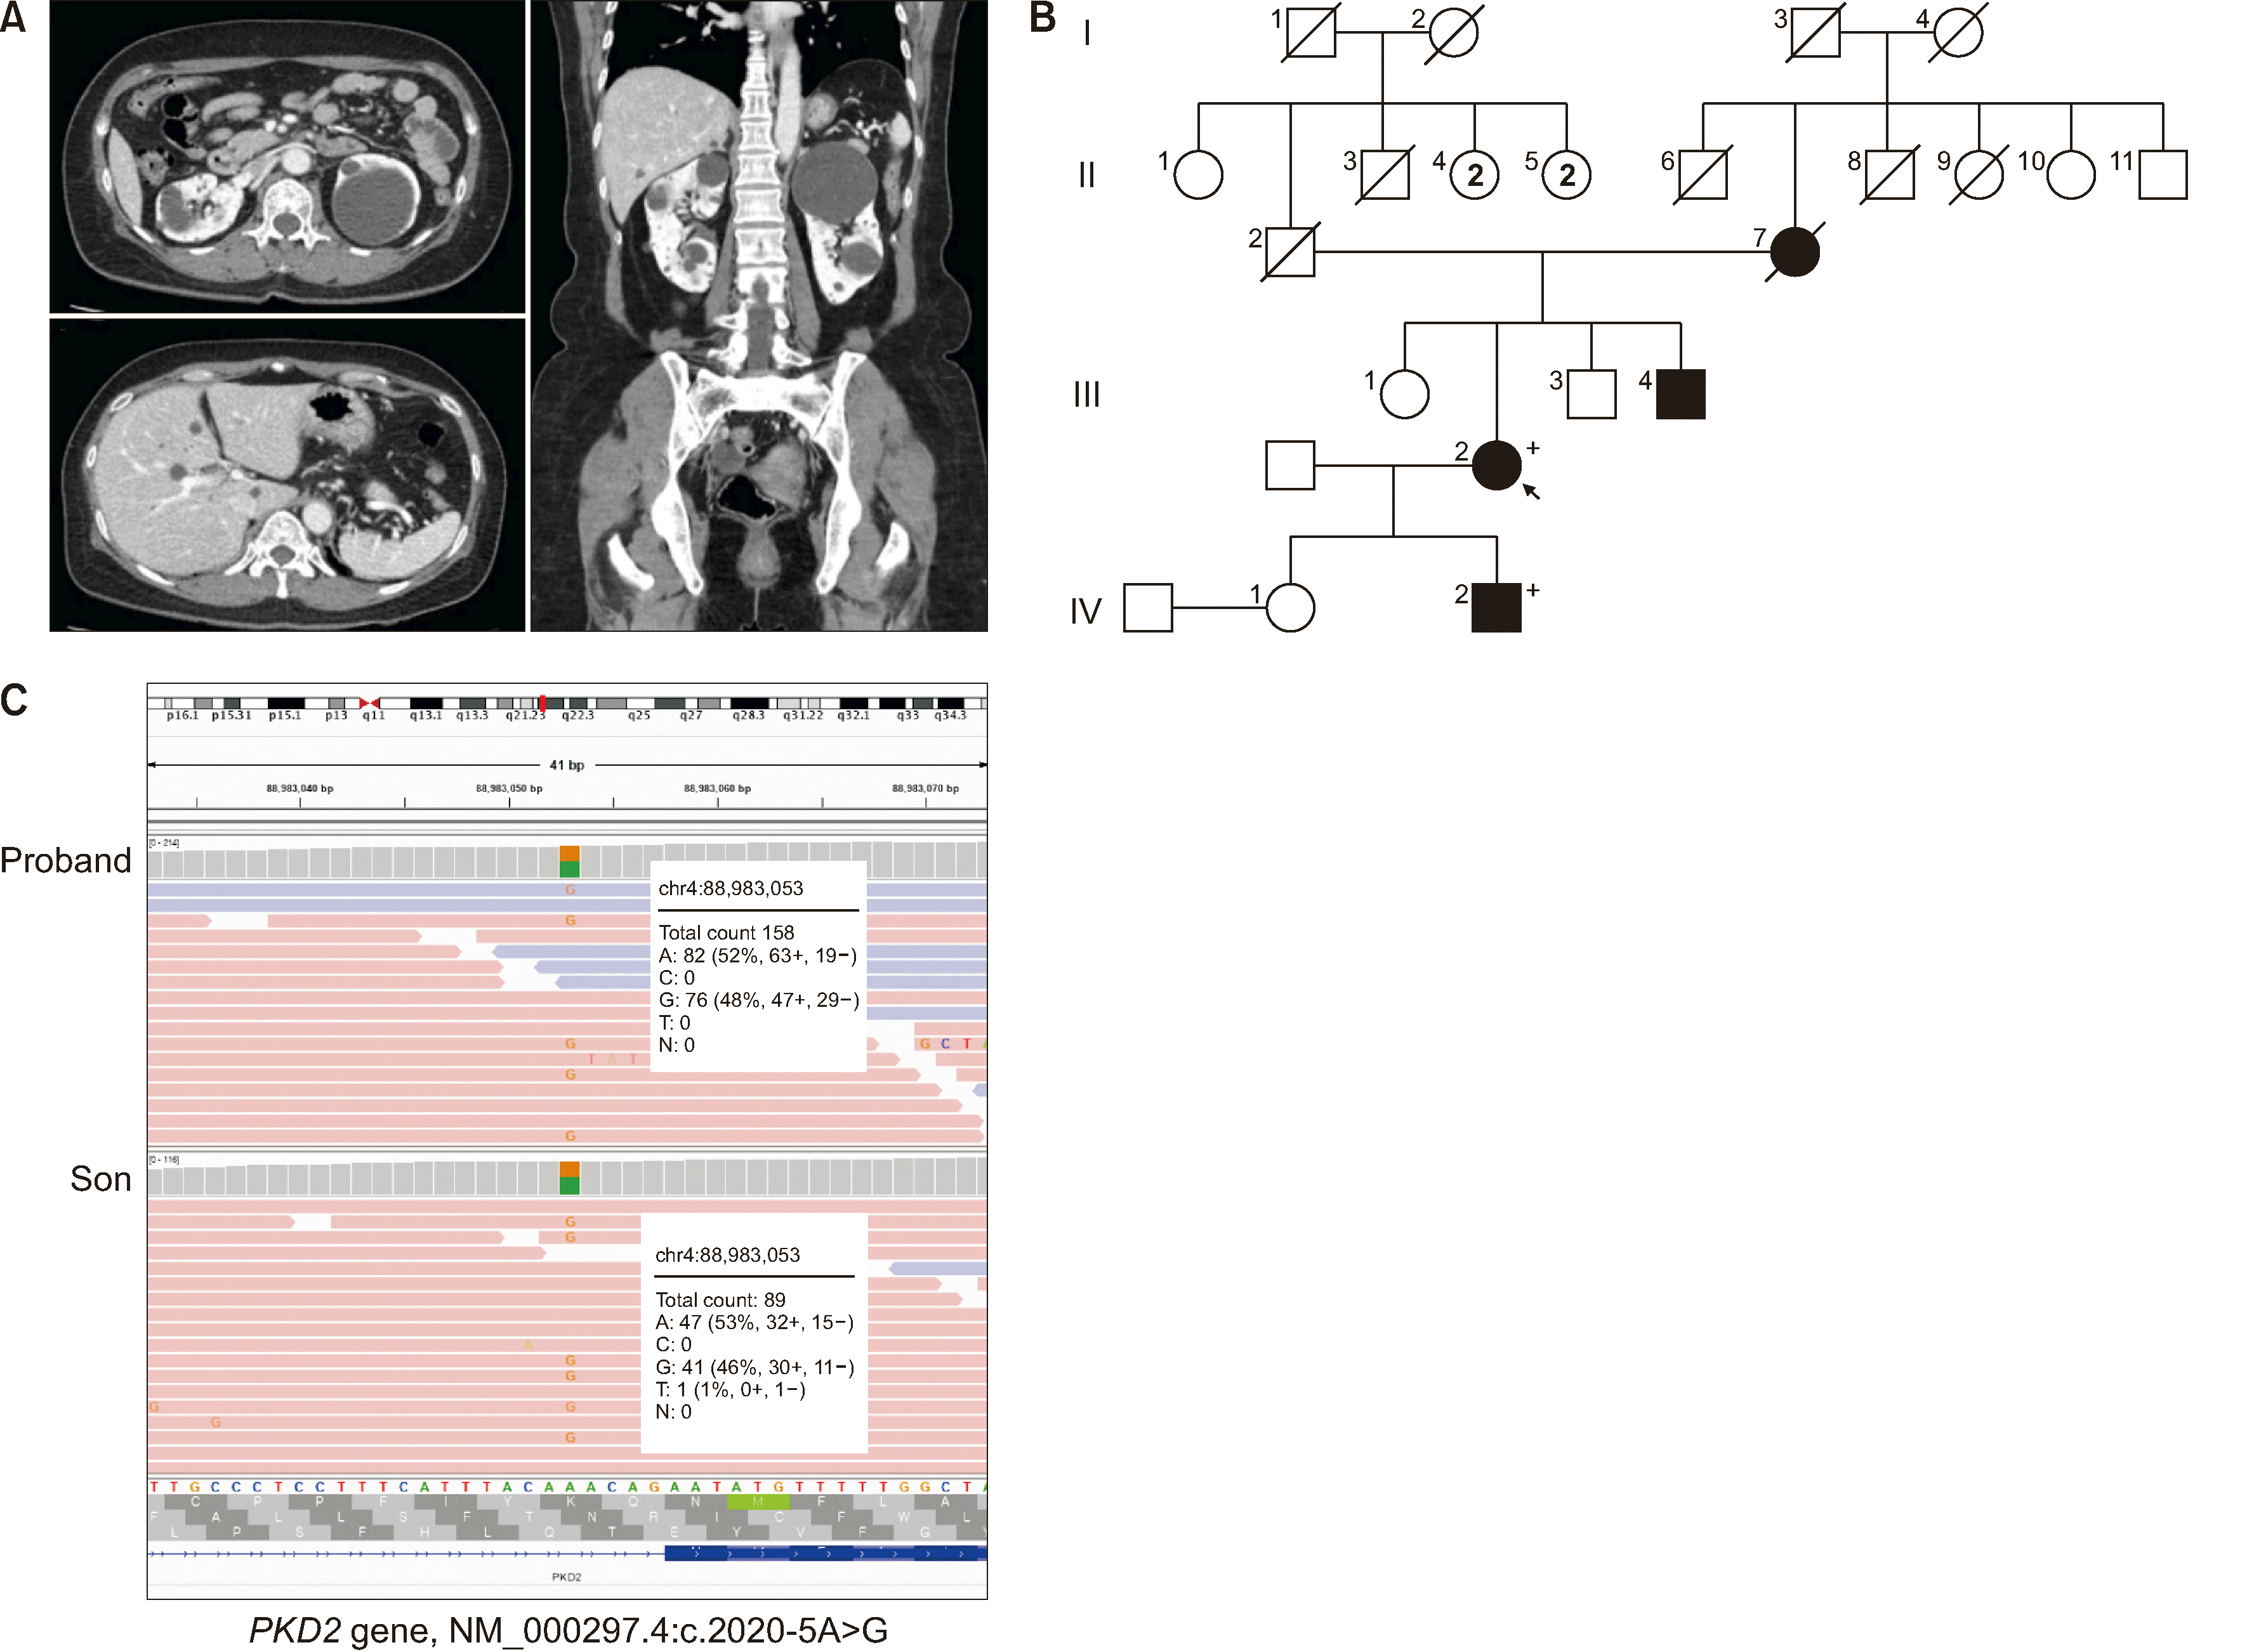
Fig. 1
The CT findings, pedigree analysis, and next-generation sequencing results of the proband with ADPKD. (A) Multiple renal cysts were identified in the transverse plane of the CT scan. Multiple hepatic cysts were observed in the transverse plane of the CT scan. Multiple renal and hepatic cysts were visible in the coronal plane of the CT scan. (B) Pedigree of the proband (III-2) with ADPKD. The mother (II-7), younger brother (III-4), and son (IV-2) of the proband were diagnosed as having multiple renal or hepatic cysts. The same PKD2 variant was identified in both the proband and her son. (C) Results of next-generation sequencing testing related to ADPKD for the proband and son. The same heterozygous variant in PKD2 (NM_000297.4:c.2020-5A>G) was found in the proband and son.

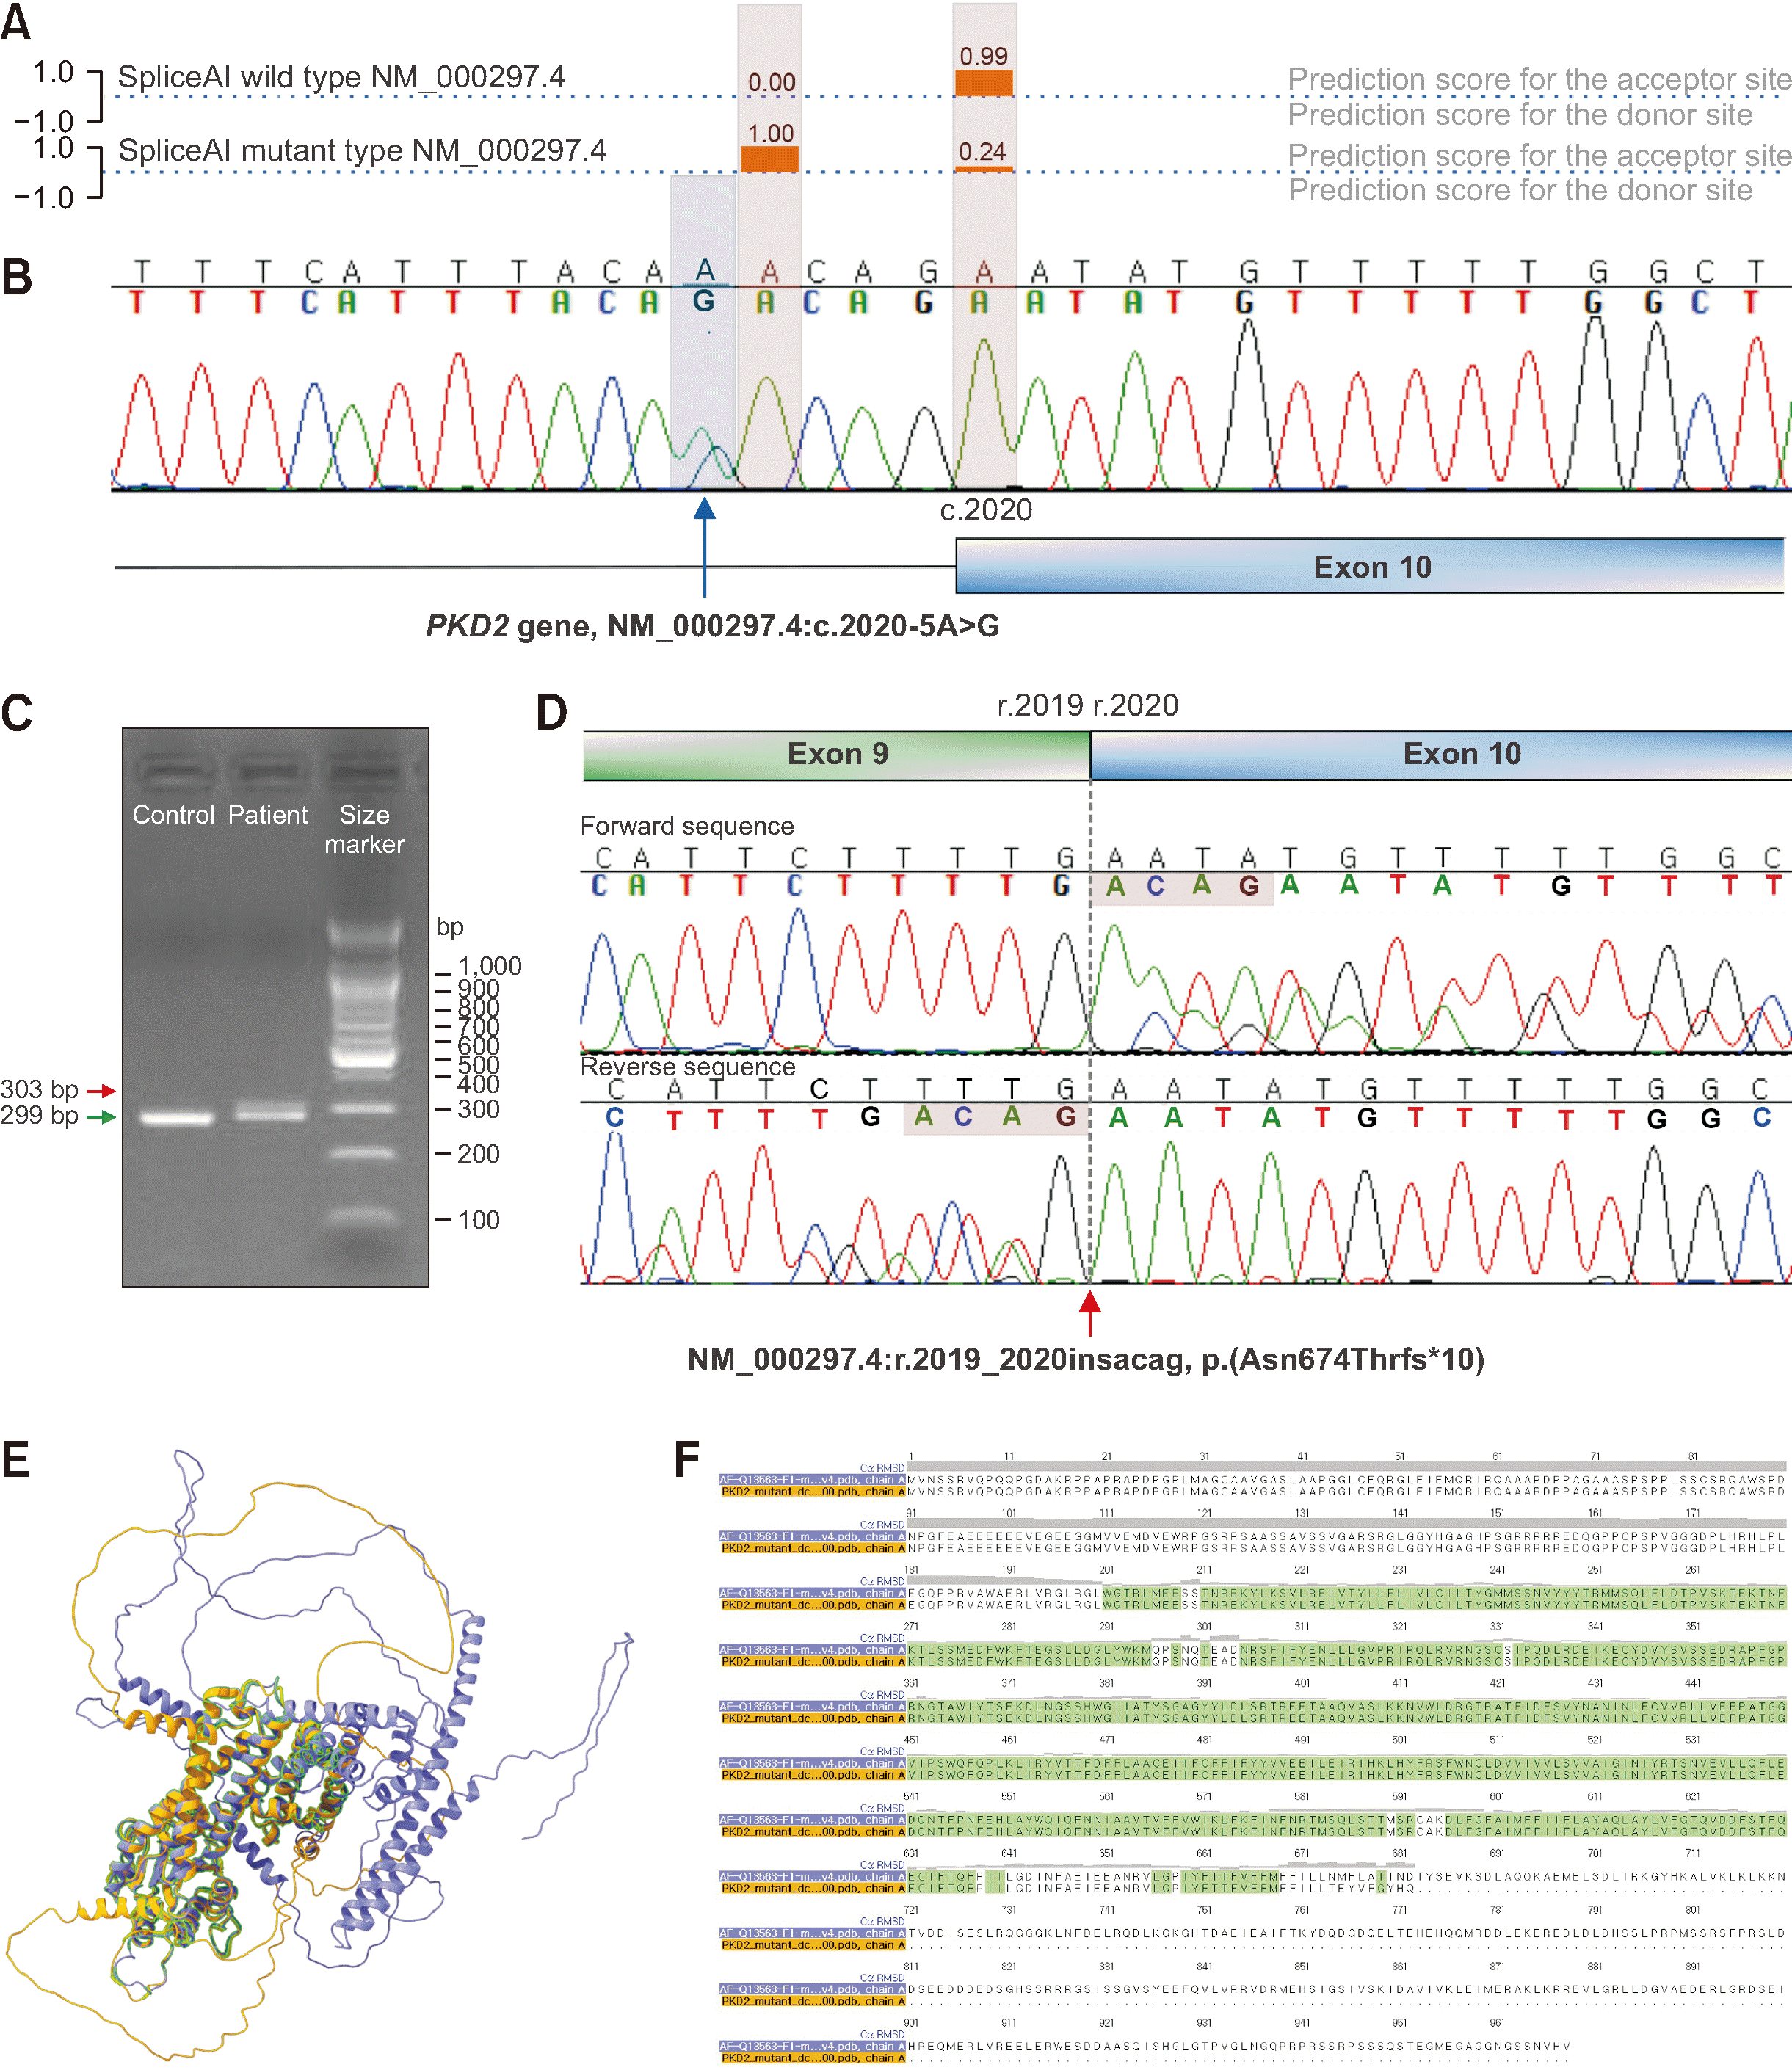
Fig. 2
Additional confirmatory results for interpreting the genetic variant identified in the proband. (A) The pathogenicity of NM_000297.4:c.2020-5A>G was predicted using SpliceAI [3]. It was predicted that, because of this intronic variant, acceptor loss would occur at the +5 bp position (with a change from 0.99 to 0.24, delta score of 0.76), and acceptor gain would occur at the +1 bp position (with a change from 0 to 1, delta score of 1). The SpliceAI score was visualized with some modifications using MobiDetails (https://mobidetails.iurc.montp.inserm.fr/MD/) (B) Sanger sequencing was conducted to reassess the presence of the intronic variant in the proband, and the results confirmed its presence. (C) Agarose gel electrophoresis of a targeted reverse transcription PCR product, showing a single band of 299 bp in the control and two bands of different sizes (299 bp and 303 bp) in the proband. (D) Targeted RNA sequencing revealed a change in the 299-bp RNA sequence (NM_000297.4:r.2019_2020insacag), which is anticipated to induce a PTC (p.(Asn674Thrfs*10)). The boundary between exons 9 and 10 in the RNA sequence is marked with a vertical dashed line on the chromatogram. (E) PKD2 structure (yellow) predicted using AlphaFold2 [5] based on the mutant sequence compared with the canonical PKD2 structure (purple) using ChimeraX Matchmaker [6]. Regions predicted to have the same structure based on RMSD in MatchMaker are highlighted in green. (F) The MatchMaker Multalign viewer displays the RMSD values (Cα RMSD) of the pairwise sequence alignment between the canonical and mutant sequences as the height of the histogram bars. Matched residues are highlighted with green boxes.


 PDF
PDF Citation
 Print
Print


 XML Download