Abstract
Background
Methods
Results
Conclusions
Notes
AUTHOR CONTRIBUTIONS
Yue Y, Zhang R, and Wang Q conceived and designed the research. Yue Y, Zhang J, and Zhao J collected and tabulated the data. Yue Y and Zhang J conducted the research. Yue Y and Zhang R analyzed and interpreted the data. Zhang J and Zhao J wrote the initial draft. Yue Y and Zhang R revised the manuscript. All authors have accepted responsibility for the entire content of this manuscript and approved its submission.
References
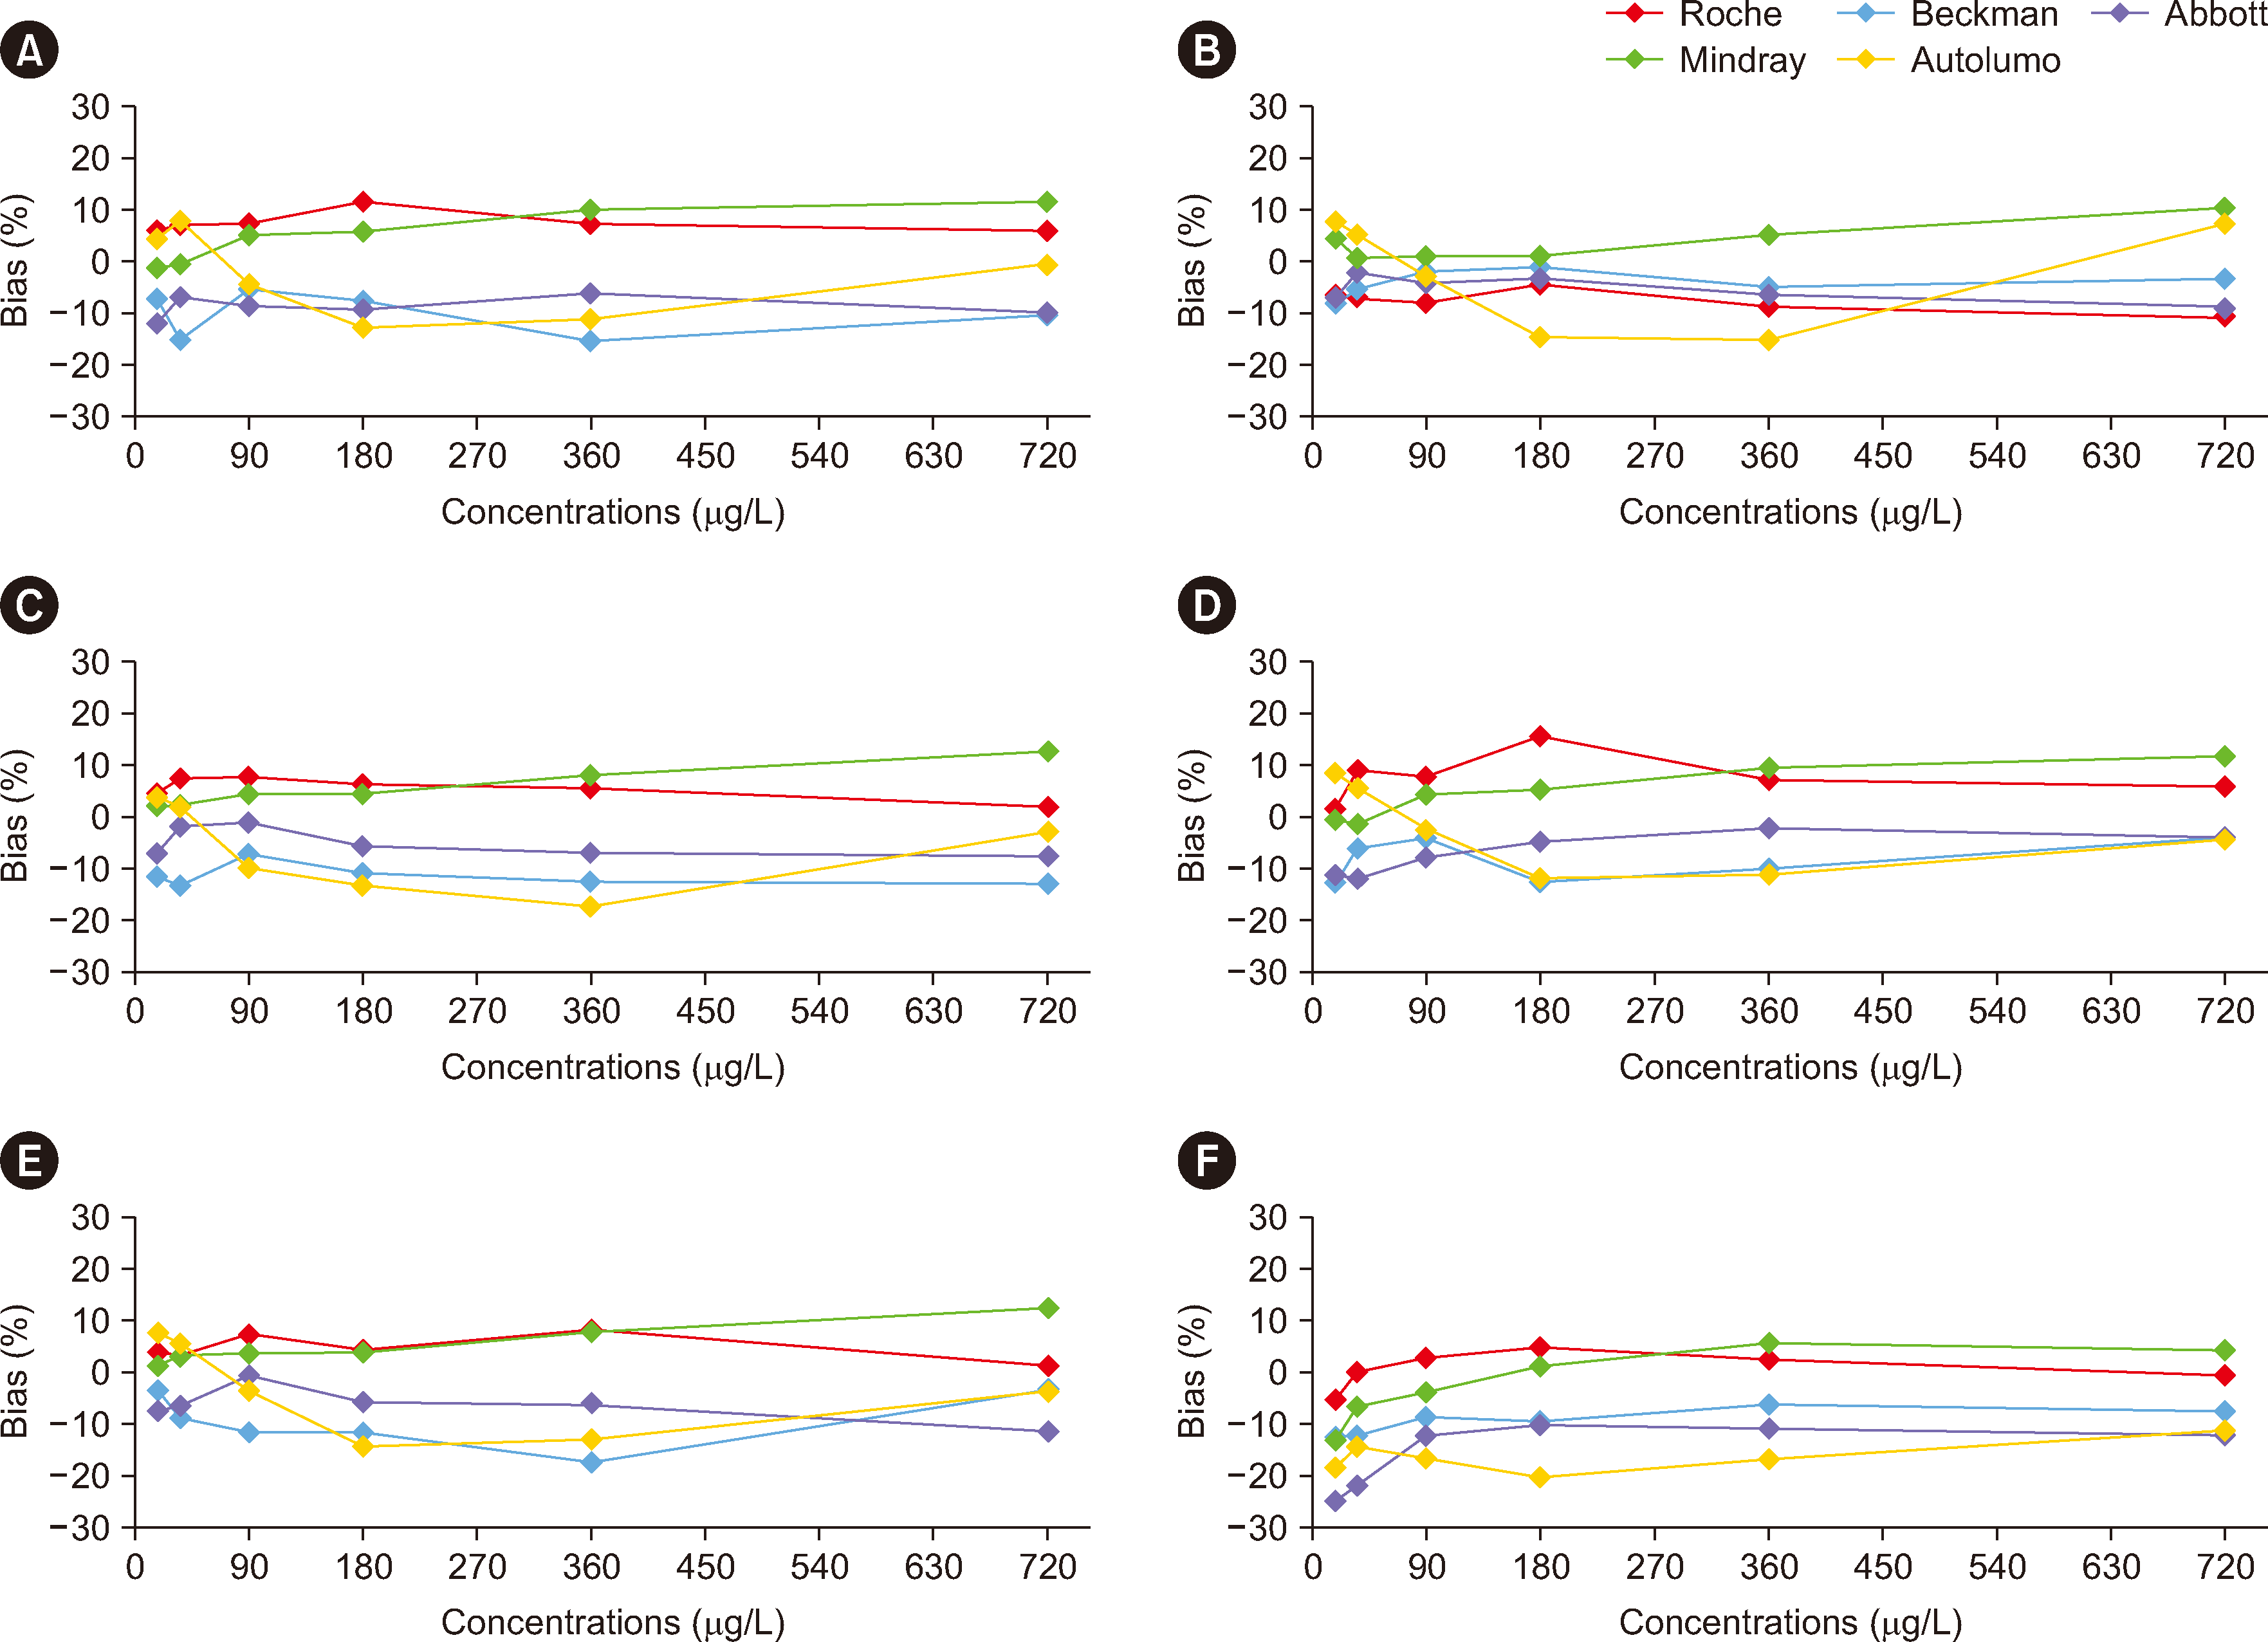
Fig. 1
Comparability of the results obtained when the WHO72/225 standard was diluted in six different buffer matrices and tested using five different alpha-fetoprotein immunoassays. Panels A–F show the results obtained with six different buffer matrices, including (A) phosphate-buffered saline, (B) a healthy human serum pool, (C) DMEM, (D) minimal essential medium, (E) Roswell Park Memorial Institute 1640 medium, and (F) distilled water.

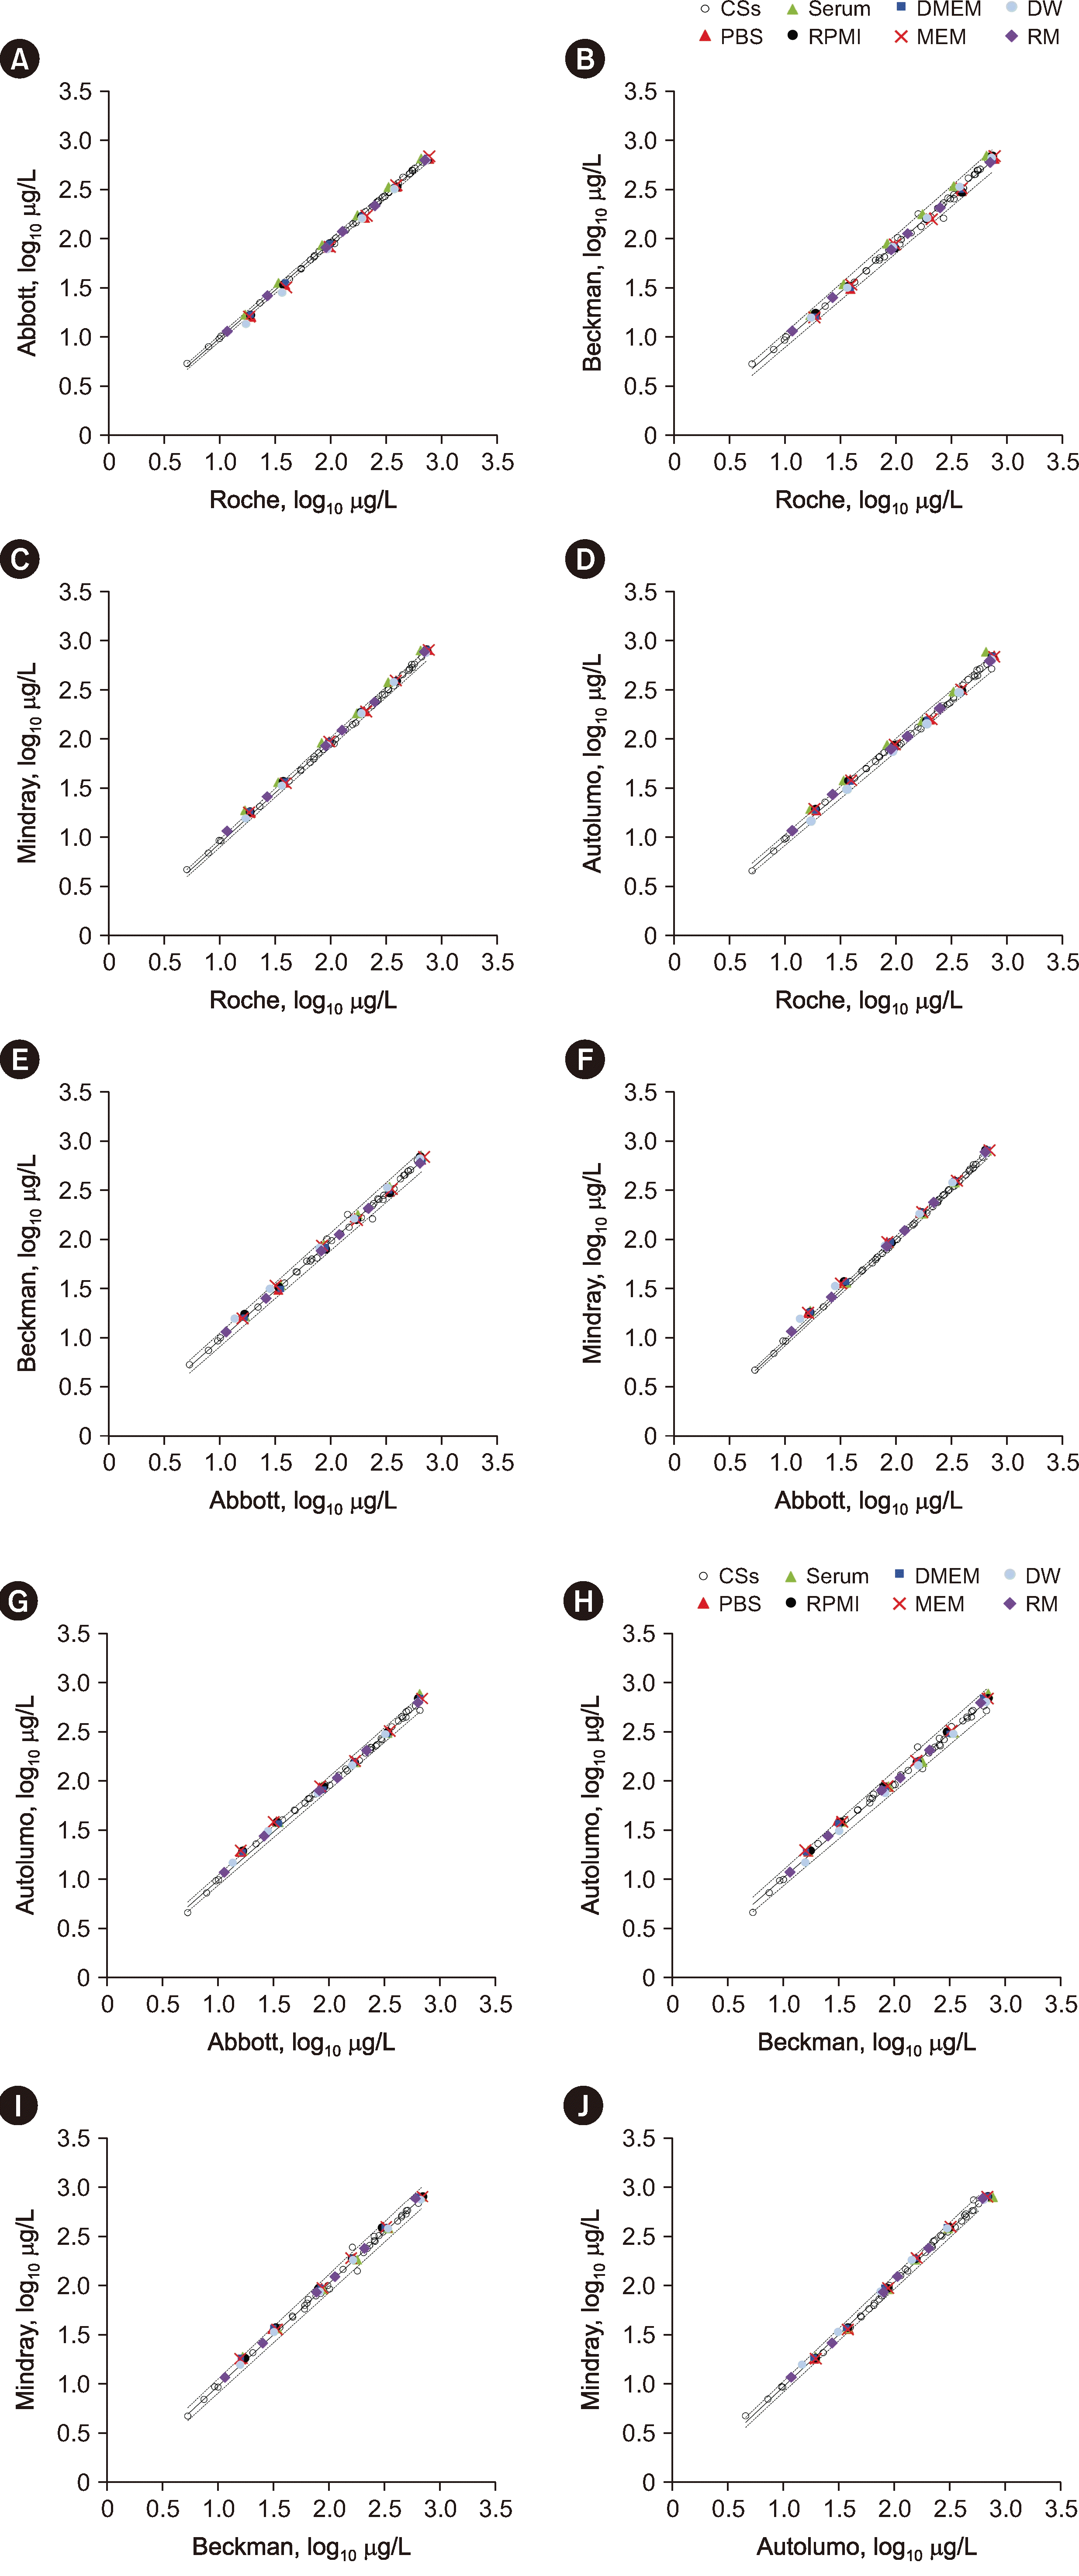
Fig. 2
Assessing the commutability of reference materials across five analytical systems for determining alpha-fetoprotein concentrations based on the CLSI document EP30-A method. (A) Roche assay results – Abbott assay results. (B) Roche assay – Beckman assay. (C) Roche assay – Mindray assay. (D) Roche assay – Autolumo assay. (E) Abbott assay – Beckman assay. (F) Abbott assay – Mindray assay. (G) Abbott assay – Autolumo assay. (H) Beckman assay – Autolumo assay. (I) Beckman assay – Mindray assay. (J) Autolumo assay – Mindray assay. The solid black lines are regression curves, and the dashed lines are two-tailed 95% prediction lines.

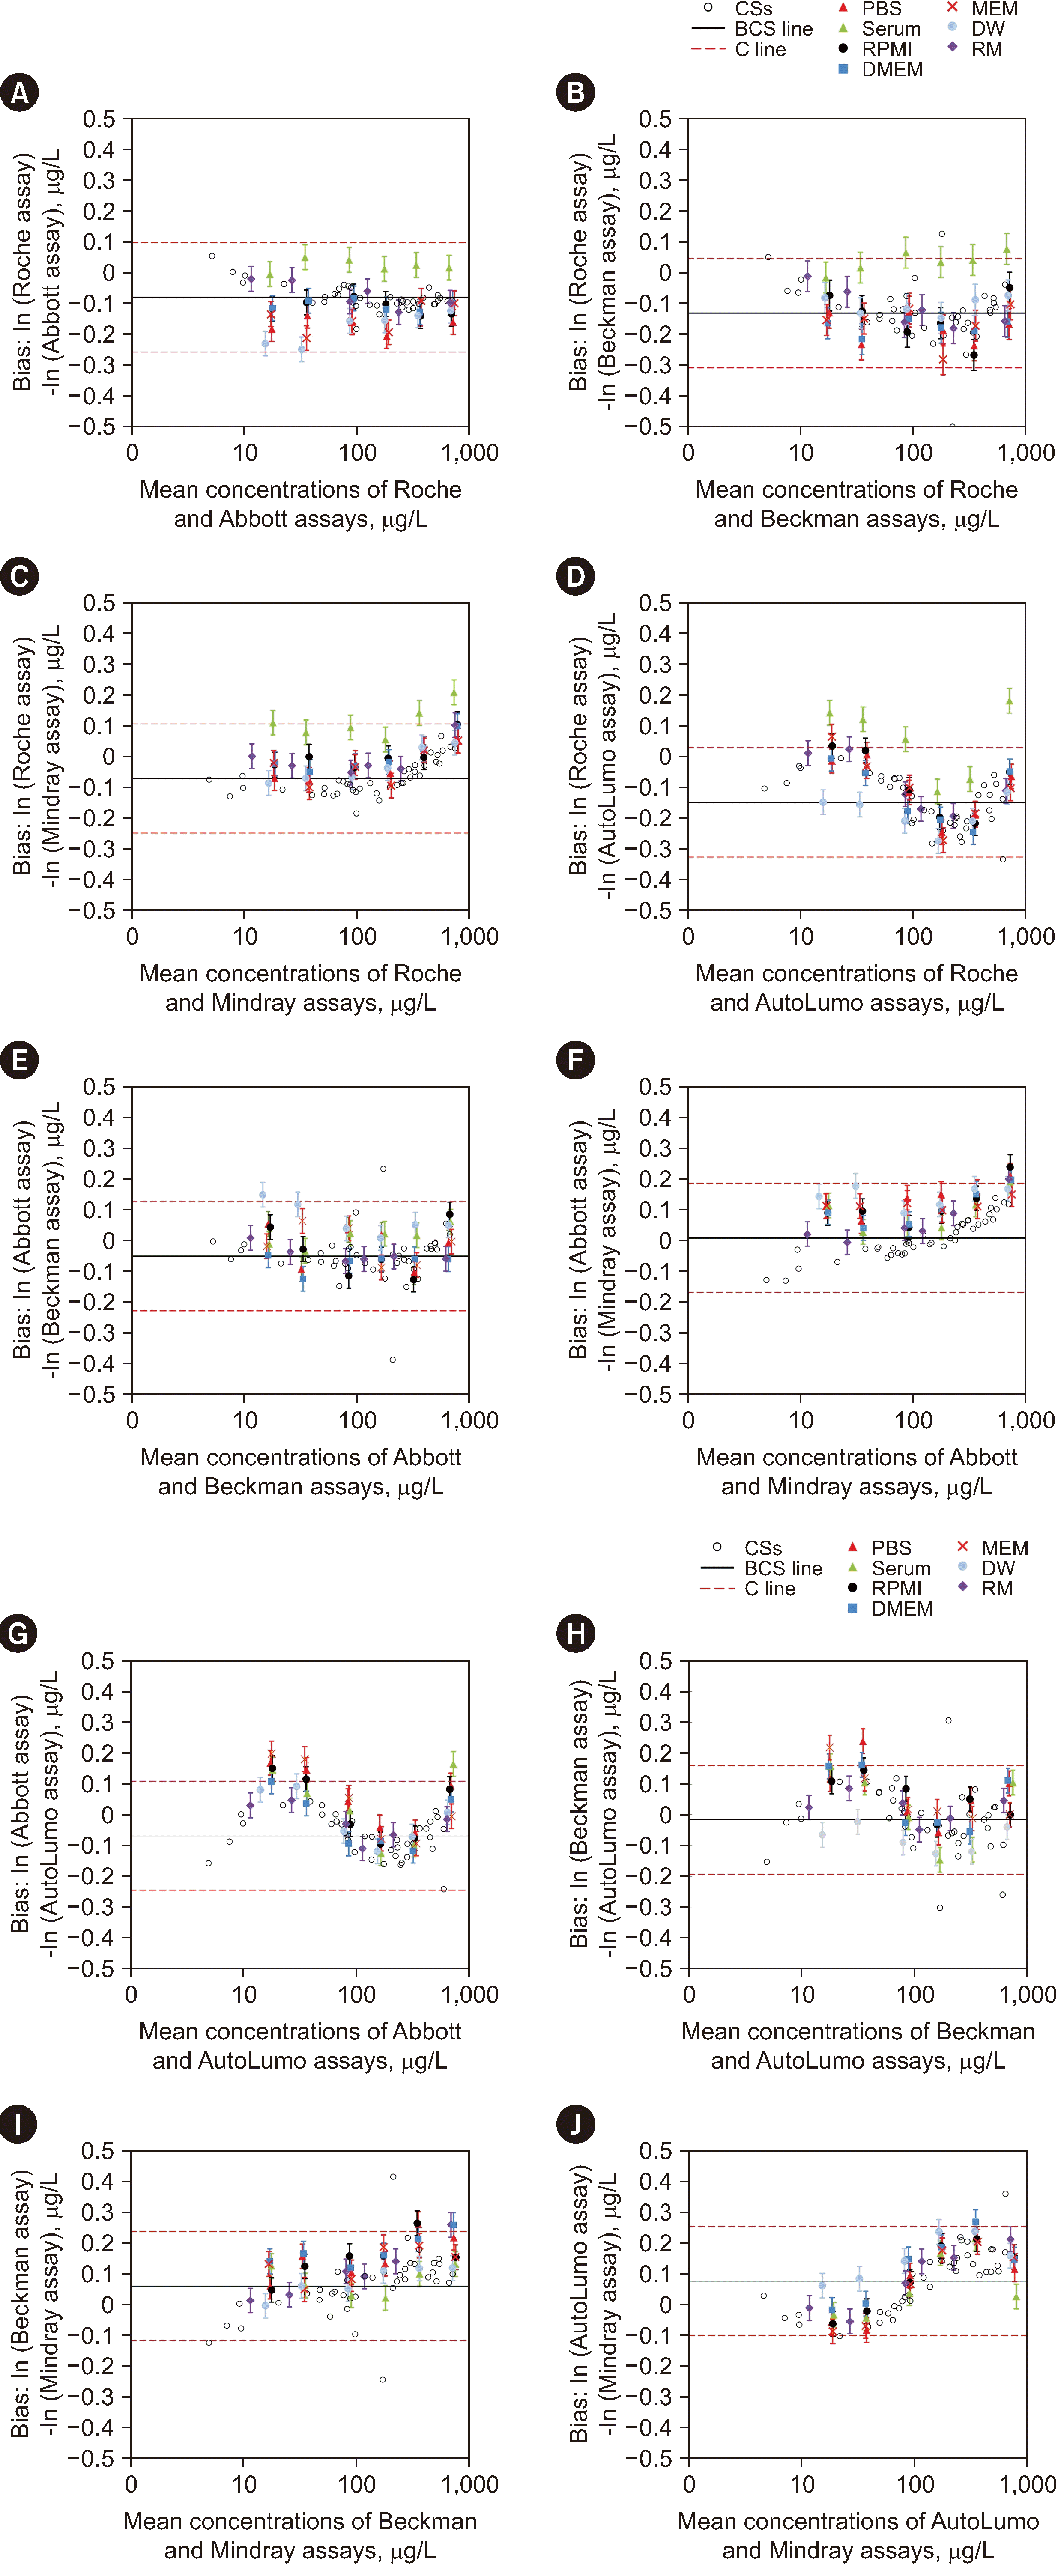
Fig. 3
Assessing the commutability of reference materials (RMs) across five analytical systems for determining alpha-fetoprotein (AFP) concentrations, based on the International Federation of Clinical Chemistry and Laboratory Medicine [16] (IFCC) method. (A) Roche assay results – Abbott assay results. (B) Roche assay – Beckman assay. (C) Roche assay – Mindray assay. (D) Roche assay – Autolumo assay. (E) Abbott assay – Beckman assay. (F) Abbott assay – Mindray assay. (G) Abbott assay – Autolumo assay. (H) Beckman assay – Autolumo assay. (I) Beckman assay – Mindray assay. (J) Autolumo assay – Mindray assay. The bias of the logarithm ln (loge) of the concentrations measured with two measuring systems is shown in each case. The purple diamonds represent the six Beijing Center for Clinical Laboratories (BCCL) Can-RMs. The black circles represent the clinical samples (CSs). The error bars indicate the uncertainty of the difference in bias between each BCCL Can-RM and diluted WHO standard and the average bias for the CSs. The solid gray line is the bias-for-the-clinical sample (BCS) line, which represents the mean bias for all CSs. The red dashed lines (C lines) indicate the maximum allowable commutability-related bias (i.e., the commutability criterion [C]).

Table 1
Commutability assessments for the Can-RMs and diluted WHO standard for AFP measurements, according to the CLSI EP30A and IFCC approaches
Abbreviations: Can-RM, candidate reference material; AFP, alpha-fetoprotein; IFCC, International Federation of Clinical Chemistry and Laboratory Medicine [16]; PBS, phosphate-buffered saline; RPMI, Roswell Park Memorial Institute 1640; MEM, minimal essential medium; DW, distilled water; C, I, and NC: commutable, inconclusive, and non-commutable results for Can-RMs L1–L6 and diluted WHO standards at six diluted concentrations, respectively.
Table 2
The assigned concentrations and uncertainties for human serum AFP concentrations in the BCCL Can-RMs
Abbreviations: AFP, alpha-fetoprotein; BCCL, Beijing Center for Clinical Laboratories; Can-RM, candidate reference material; uchar, uncertainty of the measurement; ubb, uncertainty from homogeneity of the material; ults, uncertainty due to the long-term stability; uWHO, uncertainty of WHO standard materials; uc, combined standard uncertainty.
Table 3
AFP EQA pass rates of the BCCL Can-RMs according to bias, CV, and TE criteria
| Instrument | N* | BCCL Can-RM L2 | BCCL Can-RM L4 | |||||||
|---|---|---|---|---|---|---|---|---|---|---|
| Acceptable rate, % |
Mean bias, % (minimum to maximum) |
Acceptable rate, % |
Mean bias, % (minimum to maximum) |
|||||||
| Bias | CV | TE | Bias | CV | TE | |||||
| All instruments | 45 | 74 | 96 | 85 | 1.2 (−17.5 to 19.7) | 87 | 93 | 96 | −1.5 (−18.5 to 13.1) | |
| Abbott Architect i2000SR/i2000/i1000SR | 6 | 100 | 100 | 100 | −3.9 (−5.2 to 0.5) | 100 | 100 | 100 | −5.3 (−12.6 to −0.2) | |
| Abbott AxSym | 3 | 100 | 100 | 100 | −4.0 (−4.4 to −3.6) | 100 | 100 | 100 | −4.6 (−4.3 to −5.0) | |
| Beckman Access, Access2 | 3 | 33 | 67 | 33 | −0.01 (−1.5 to 18.2) | 33 | 67 | 33 | −4.5 (−18.4 to 13.1) | |
| Beckman DxI600, DxI800 | 6 | 67 | 100 | 100 | −8.9 (−3.1 to −14.3) | 67 | 100 | 100 | −10.2 (−15.1 to −3.6) | |
| Roche Cobas E601/E602 | 13 | 77 | 92 | 85 | 6.8 (−17.5 to 15.4) | 92 | 100 | 100 | 3.9 (−18.5 to 10.7) | |
| Roche Elecsys 1010/2010, Cobas E411 | 6 | 83 | 100 | 100 | 3.1 (−1.9 to 12.1) | 100 | 100 | 100 | 1.0 (−3.8 to 8.9) | |
| Roche ES 300/600 | 2 | 100 | 100 | 100 | 0.9 (−8.3 to 10.1) | 100 | 100 | 100 | −0.5 (−10.1 to 9.2) | |
| Siemens ADVIA Centaur CP/XP | 4 | 25 | 100 | 25 | 11.9 (−3.2 to 19.7) | 100 | 50 | 100 | 2.7 (−2.4 to 5.4) | |
| Bioscience Peteck 96-I | 1 | 100 | 100 | 100 | −3.1 | 100 | 100 | 100 | −5.8 | |
| SNIBE Maglumi | 1 | 100 | 100 | 100 | −11.6 | 100 | 100 | 100 | −7.5 | |
*The total number of participating institutions and the number of institutions utilizing the indicated analytical platform are indicated.
The difference between the tested and target values was defined as the bias. The CV was calculated from nine replicate results, and the TE was calculated as the bias±2CV. The mean bias was calculated from the mean bias results of the participating institutions utilizing each indicated platform. The evaluation criteria for CV, bias, and TE were 6.1%, 11.8%, and 21.9%, respectively.


 PDF
PDF Citation
 Print
Print


 XML Download