Abstract
Objectives
Methods
Results
Conclusions
Notes
Conflict of Interest
There are no financial or other issues that might lead to conflict of interest.
REFERENCES
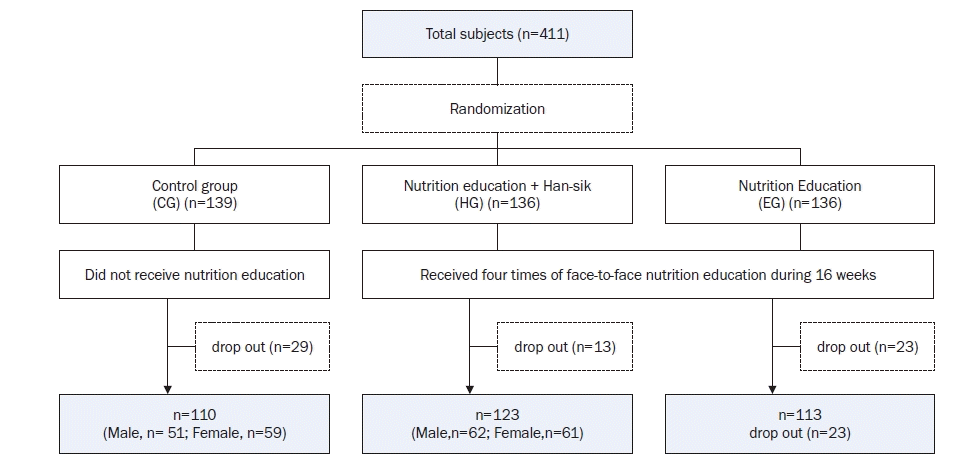
Fig. 1.

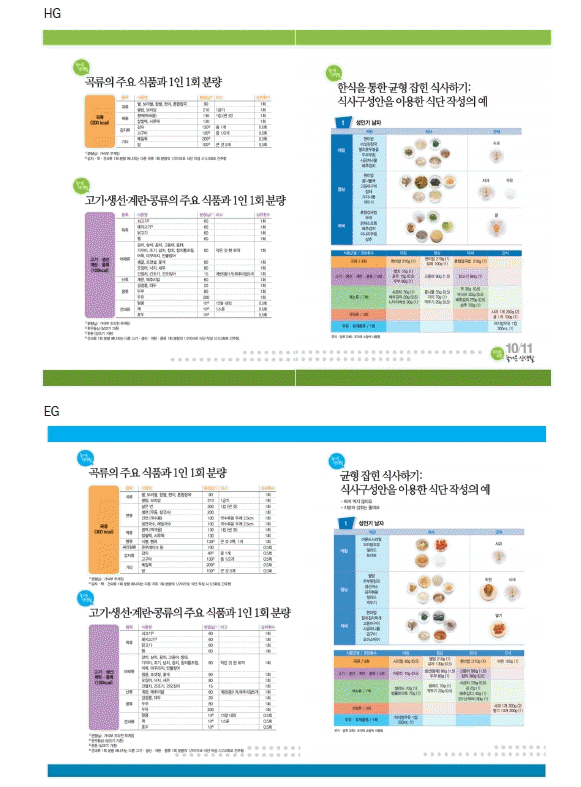
Fig. 2.

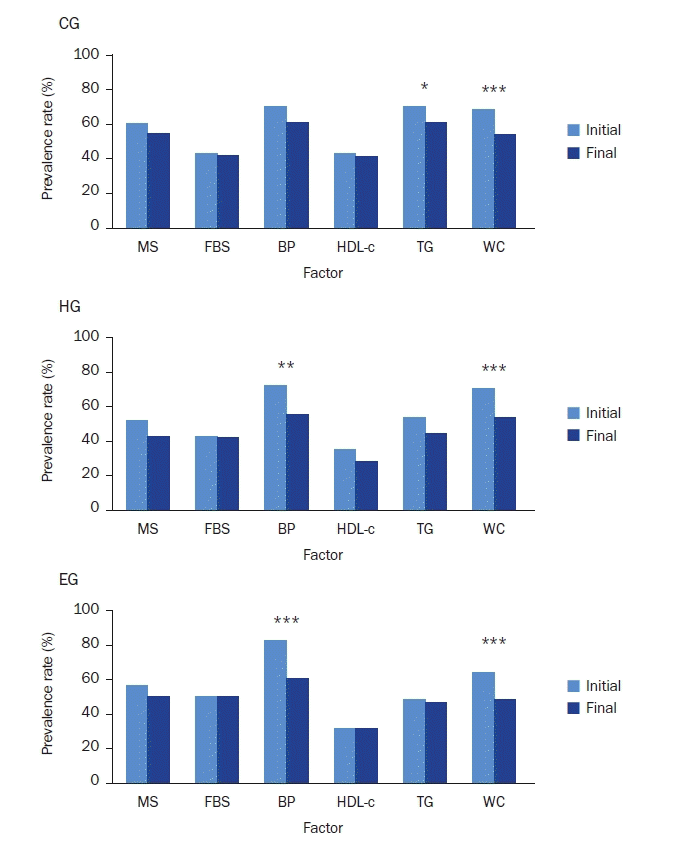
Fig. 3.

Table 1.
| CG (n = 110) | HG (n = 123) | EG (n = 113) | P-value1) | |
|---|---|---|---|---|
| Age (year) | 46.2 ± 7.9 | 45.6 ± 7.7 | 47.8 ± 7.3 | 0.083 |
| Sex | ||||
| Men | 51 (46.4) | 62 (50.4) | 55 (48.7) | 0.827 |
| Women | 59 (53.6) | 61 (49.6) | 58 (51.3) | |
| Smoking status | ||||
| Never smoked | 62 (56.4) | 67 (54.5) | 61 (54.0) | 0.832 |
| Former smoking | 25 (22.7) | 33 (26.8) | 25 (22.1) | |
| Currently smoking | 23 (20.9) | 23 (18.7) | 27 (23.9) | |
| Alcohol intake at one time | ||||
| Do not drink | 8 (7.3) | 12 (9.8) | 8 (7.1) | 0.927 |
| 1–2 glasses | 38 (34.5) | 37 (30.1) | 38 (33.6) | |
| 3–6 glasses | 31 (28.2) | 41 (33.3) | 33 (29.2) | |
| 7 glasses and more | 33 (30.0) | 33 (26.8) | 34 (30.1) | |
| Physical activity | ||||
| Regular2) | 23 (20.9) | 23 (18.7) | 22 (19.5) | 0.913 |
| Dietary supplement use | ||||
| User | 50 (45.5) | 53 (43.1) | 48 (42.5) | 0.894 |
| Metabolic syndrome3) | 66 (60.0) | 64 (52.0) | 63 (55.8) | 0.474 |
| Metabolic syndrome components4) | ||||
| Impaired blood glucose | 47 (42.7) | 53 (43.1) | 56 (49.6) | 0.507 |
| Elevated blood pressure | 77 (70.0) | 89 (72.4) | 93 (82.3) | 0.078 |
| Low HDL-cholesterol | 47 (42.7) | 43 (35.0) | 35 (31.0) | 0.178 |
| Hypertriglyceridemia | 77 (70.0) | 66 (53.7) | 54 (47.8) | 0.002 |
| Abdominal obesity | 75 (68.2) | 87 (70.7) | 72 (63.7) | 0.510 |
Mean ± SD or n (%).
CG, control group with no intervention; HG, the nutrition education group for promoting the Han-sik consumption; EG, the nutrition education group for balanced diet; HDL, high-density lipoprotein.
1) P from chi-square test in categorical variables and ANOVA in continuous variables (duncan’s grouping).
Table 2.
|
CG (n = 110) |
HG (n = 123) |
EG (n = 113) |
P3) | ||||||||||
|---|---|---|---|---|---|---|---|---|---|---|---|---|---|
| Before | After | Difference | P2) | Before | After | Difference | P2) | Before | After | Difference | P2) | ||
| Adequate intake of various whole grains | 3.2 ± 0.9 | 3.4 ± 0.9 | 0.2 ± 1.0 | 0.107 | 3.1 ± 1.0 | 3.2 ± 0.8 | 0.1 ± 1.0 | 0.129 | 3.2 ± 1.0 | 3.4 ± 0.9 | 0.2 ± 0.9 | 0.010 | 0.749 |
| Adequate intake of green/orange vegetables | 3.0 ± 0.8 | 3.0 ± 0.9 | 0.1 ± 0.9 | 0.460 | 2.6 ± 0.8 | 2.9 ± 0.7 | 0.3 ± 0.8 | 0.001 | 2.8 ± 0.9 | 3.0 ± 0.7 | 0.2 ± 0.9 | 0.019 | 0.242 |
| Adequate intake of fruits | 2.9 ± 0.9 | 3.0 ± 0.9 | 0.1 ± 0.9 | 0.534 | 3.0 ± 0.8 | 3.1 ± 0.8 | 0.1 ± 0.9 | 0.289 | 3.1 ± 0.9 | 3.1 ± 0.8 | 0.0 ± 1.0 | 0.844 | 0.672 |
| Adequate intake of milk and dairy products | 2.6 ± 1.0 | 2.7 ± 1.0 | 0.1 ± 1.1 | 0.335 | 2.6 ± 1.2 | 3.1 ± 0.9 | 0.5 ± 1.2 | < 0.0001 | 2.6 ± 1.0 | 3.1 ± 0.9 | 0.5 ± 1.0 | < 0.0001 | 0.005 |
| Regular intake of three meals a day | 3.0 ± 1.1 | 3.2 ± 1.0 | 0.2 ± 0.8 | 0.008 | 3.0 ± 1.2 | 3.3 ± 1.0 | 0.3 ± 0.9 | 0.001 | 3.0 ± 1.0 | 3.5 ± 1.0 | 0.5 ± 0.8 | < 0.0001 | 0.042 |
| Meals are composed of variety of side-dishes | 3.0 ± 0.8 | 3.0 ± 0.8 | 0.1 ± 0.8 | 0.247 | 3.0 ± 0.9 | 3.0 ± 0.8 | 0.1 ± 0.9 | 0.412 | 2.9 ± 0.8 | 3.2 ± 0.7 | 0.3 ± 0.8 | 0.0002 | 0.082 |
| Appropriate caloric intake needed for energy balance | 3.0 ± 0.9 | 3.2 ± 0.9 | 0.2 ± 1.0 | 0.044 | 3.2 ± 1.0 | 3.2 ± 0.8 | 0.1 ± 1.0 | 0.441 | 3.0 ± 0.9 | 3.2 ± 0.8 | 0.2 ± 1.1 | 0.082 | 0.633 |
| Do not add extra salt or soy sauce | 3.5 ± 0.9 | 3.5 ± 1.0 | 0.1 ± 1.0 | 0.516 | 3.4 ± 1.0 | 3.6 ± 0.9 | 0.2 ± 1.1 | 0.023 | 3.3 ± 1.0 | 3.6 ± 0.9 | 0.3 ± 1.1 | 0.012 | 0.317 |
| Make Kimchi as low salty | 2.9 ± 0.8 | 3.1 ± 0.8 | 0.1 ± 0.9 | 0.085 | 2.9 ± 0.8 | 3.1 ± 0.8 | 0.2 ± 0.7 | 0.003 | 3.0 ± 1.0 | 3.3 ± 0.7 | 0.3 ± 0.9 | 0.0002 | 0.324 |
| Eat less fatty meat | 3.1 ± 1.1 | 3.3 ± 1.1 | 0.2 ± 0.9 | 0.043 | 3.0 ± 1.1 | 3.3 ± 1.0 | 0.3 ± 0.9 | < 0.0001 | 3.2 ± 1.0 | 3.5 ± 0.9 | 0.4 ± 0.9 | < 0.0001 | 0.286 |
| Eat less fried foods | 3.4 ± 1.0 | 3.5 ± 0.9 | 0.1 ± 0.9 | 0.326 | 3.2 ± 1.0 | 3.6 ± 0.9 | 0.4 ± 0.9 | < 0.0001 | 3.2 ± 1.0 | 3.6 ± 0.8 | 0.4 ± 0.9 | < 0.0001 | 0.009 |
| Reduce the amount of oil when cooking | 3.3 ± 0.8 | 3.4 ± 0.8 | 0.1 ± 0.8 | 0.181 | 3.1 ± 0.9 | 3.5 ± 0.7 | 0.4 ± 0.7 | < 0.0001 | 3.2 ± 0.8 | 3.6 ± 0.7 | 0.4 ± 0.8 | < 0.0001 | 0.011 |
Table 3.
| CG (n = 110) | HG (n = 123) | EG (n = 113) | P2) | ||||||||||
|---|---|---|---|---|---|---|---|---|---|---|---|---|---|
| Before | After | Difference | P1) | Before | After | Difference | P1) | Before | After | Difference | P1) | ||
| Nutrient intakes | |||||||||||||
| Energy (kcal) | 1,789.1 ± 569.5 | 1,683.3 ± 555.0 | –105.8 ± 575.4 | 0.164 | 1,802.0 ± 605.1 | 1,686.9 ± 475.6 | –115.1 ± 608.8 | 0.099 | 1,752.7 ± 516.1 | 1,582.7 ± 356.3 | –170.0 ± 471.5 | 0.004 | 0.644 |
| Carbohydrate (g) | 258.5 ± 91.3 | 239.0 ± 71.0 | –19.5 ± 83.7 | 0.079 | 260.4 ± 83.6 | 249.7 ± 68.7 | –10.7 ± 84.5 | 0.276 | 255.8 ± 67.4 | 238.6 ± 54.2 | –17.2 ± 62.6 | 0.035 | 0.662 |
| Protein (g) | 68.2 ± 25.7 | 63.5 ± 26.1 | –4.7 ± 26.4 | 0.182 | 69.6 ± 27.3 | 68.1 ± 26.4 | –1.5 ± 32.3 | 0.656 | 66.5 ± 27.0 | 61.8 ± 18.5 | –4.7 ± 28.3 | 0.124 | 0.625 |
| Fat (g) | 41.8 ± 18.6 | 40.0 ± 21.5 | –1.8 ± 25.1 | 0.515 | 44.0 ± 20.8 | 40.0 ± 17.4 | –4.0 ± 22.4 | 0.104 | 43.0 ± 19.7 | 35.8 ± 14.3 | –7.2 ± 22.0 | 0.002 | 0.218 |
| % CHO | 61.9 ± 8.2 | 61.7 ± 9.1 | –0.1 ± 10.3 | 0.914 | 61.2 ± 8.6 | 61.7 ± 7.5 | 0.5 ± 10.5 | 0.613 | 61.8 ± 7.9 | 62.8 ± 7.3 | 0.9 ± 9.9 | 0.350 | 0.733 |
| % protein | 16.2 ± 3.5 | 16.1 ± 3.7 | –0.1 ± 4.3 | 0.796 | 16.2 ± 4.2 | 16.6 ± 3.6 | 0.3 ± 5.2 | 0.508 | 15.7 ± 3.4 | 16.3 ± 3.7 | 0.6 ± 4.6 | 0.204 | 0.509 |
| % lipid | 21.9 ± 6.4 | 22.2 ± 7.4 | 0.3 ± 8.9 | 0.788 | 22.6 ± 6.4 | 21.7 ± 6.3 | –0.8 ± 7.8 | 0.292 | 22.5 ± 6.4 | 21.0 ± 6.1 | –1.6 ± 8.1 | 0.064 | 0.260 |
| Dietary fiber (g) | 22.8 ± 8.4 | 22.3 ± 9.2 | –0.5 ± 7.8 | 0.645 | 23.9 ± 9.8 | 22.6 ± 8.7 | –1.4 ± 11.5 | 0.253 | 23.9 ± 9.2 | 23.3 ± 8.4 | –0.6 ± 9.2 | 0.590 | 0.780 |
| Sodium (g) | 3.5 ± 1.4 | 3.2 ± 1.3 | –0.3 ± 1.4 | 0.158 | 3.5 ± 1.5 | 3.2 ± 1.0 | –0.3 ± 1.6 | 0.094 | 3.6 ± 1.7 | 3.1 ± 1.0 | –0.5 ± 1.5 | 0.011 | 0.505 |
| Cholesterol (mg) | 160.9 ± 96.0 | 155.0 ± 108.3 | –5.9 ± 130.3 | 0.670 | 171.1 ± 106.2 | 160.9 ± 95.4 | –10.1 ± 137.9 | 0.432 | 166.8 ± 104.8 | 143.8 ± 93.3 | –22.9 ± 145.8 | 0.084 | 0.630 |
| % Han-sik intake3) | 77.5 ± 13.1 | 77.9 ± 12.7 | 0.3 ± 11.8 | 0.762 | 76.1 ± 12.0 | 77.2 ± 11.3 | 1.1 ± 12.4 | 0.311 | 76.0 ± 11.0 | 76.4 ± 13.5 | 0.4 ± 12.2 | 0.743 | 0.850 |
| Adherence score to the Korean Food Guidance System4) | |||||||||||||
| Grains (%) | 82.3 ± 35.9 | 73.6 ± 27.5 | –8.8 ± 33.1 | 0.007 | 80.3 ± 28.4 | 78.6 ± 24.5 | –1.7 ± 28.0 | 0.507 | 77.8 ± 24.7 | 73.3 ± 21.0 | –4.5 ± 23.3 | 0.044 | 0.162 |
| Meat·fish·eggs·beans (%) | 93.8 ± 43.4 | 83.1 ± 44.7 | –10.7 ± 52.7 | 0.035 | 93.4 ± 50.6 | 84.0 ± 45.1 | –9.4 ± 60.0 | 0.085 | 88.9 ± 47.2 | 82.7 ± 37.0 | –6.2 ± 55.6 | 0.238 | 0.827 |
| Vegetables (%) | 94.3 ± 45.1 | 94.8 ± 44.7 | 0.5 ± 47.2 | 0.912 | 98.8 ± 47.1 | 106.8 ± 124.4 | 7.9 ± 135.4 | 0.517 | 100.6 ± 51.3 | 87.3 ± 33.9 | –13.2 ± 46.0 | 0.003 | 0.184 |
| Fruits (%) | 57.3 ± 53.9 | 56.9 ± 70.2 | –0.4 ± 68.7 | 0.954 | 56.9 ± 56.0 | 49.3 ± 48.2 | –7.6 ± 61.1 | 0.169 | 68.0 ± 71.7 | 62.6 ± 63.0 | –5.4 ± 74.4 | 0.442 | 0.711 |
| Milk·dairy products (%) | 44.0 ± 64.2 | 44.3 ± 54.5 | 0.3 ± 68.0 | 0.966 | 51.0 ± 74.6 | 73.6 ± 60.2 | 22.6 ± 76.1 | 0.001 | 55.2 ± 66.4 | 55.4 ± 45.9 | 0.1 ± 71.9 | 0.983 | 0.023 |
| Oils·fats·sugars (%) | 123.6 ± 71.5 | 108.3 ± 71.7 | –15.3 ± 70.8 | 0.025 | 133.6 ± 70.8 | 102.1 ± 65.6 | –31.5 ± 68.5 | < 0.0001 | 124.0 ± 64.6 | 93.7 ± 51.7 | –30.3 ± 68.3 | < 0.0001 | 0.149 |
| Overall5) | 42 (38.2) | 30 (27.3) | –12 (–10.9) | 0.0706) | 40 (32.5) | 57 (46.3) | 17 (13.8) | 0.0226) | 44 (38.9) | 57 (50.4) | 13 (11.5) | 0.0586) | 0.0017) |
Mean ± SD or n (%).
CG, control group with no intervention; HG, the nutrition education group for promoting the Han-sik consumption; EG, the nutrition education group for balanced diet; CHO, carbohydrate.
4) Adherence score to the Korean Food Guidance System (KFGS) was defined as the percentage of consumed daily servings from each food groups to the recommended servings of the KFGS for each age group by sex.
5) The number of participants whose intakes of food group meet three or more in the KFGS: 80% ≤ the adherence score of ‘grains’ and ‘meat, fish, eggs, beans’ < 120%, 80% ≤ the adherence score of ‘vegetables’, ‘fruits’, and ‘milk, dairy products’, and the adherence score of ‘oils, fats, sugars’ < 120%.
Table 4.
|
CG (n = 110) |
HG (n = 123) |
EG (n = 113) |
P2) | ||||||||||
|---|---|---|---|---|---|---|---|---|---|---|---|---|---|
| Before | After | Difference | P1) | Before | After | Difference | P1) | Before | After | Difference | P1) | ||
| Anthropometry | |||||||||||||
| Weight (kg) | 72.4 ± 12.5 | 72.0 ± 12.5 | –0.3 ± 2.6 | 0.204 | 72.7 ± 13.0 | 72.2 ± 12.7 | –0.5 ± 2.1 | 0.007 | 69.7 ± 11.6 | 69.8 ± 11.5 | 0.1 ± 1.7 | 0.592 | 0.097 |
| Body mass index (kg/m2) | 26.7 ± 3.6 | 26.6 ± 3.7 | –0.2 ± 0.9 | 0.080 | 26.3 ± 2.9 | 26.1 ± 2.7 | –0.2 ± 0.8 | 0.002 | 25.9 ± 2.8 | 25.9 ± 2.9 | 0.0 ± 0.7 | 0.929 | 0.084 |
| Waist circumference (cm) | 90.3 ± 9.0 | 89.1 ± 8.9 | –1.3 ± 2.8 | < 0.0001 | 89.4 ± 8.0 | 88.0 ± 7.7 | –1.3 ± 2.2 | < 0.0001 | 88.4 ± 7.1 | 86.8 ± 6.6 | –1.6 ± 2.8 | < 0.0001 | 0.632 |
| Lipid profile | |||||||||||||
| HDL cholesterol (mg/dL) | 48.5 ± 11.7 | 48.9 ± 11.1 | 0.4 ± 7.6 | 0.600 | 51.6 ± 12.1 | 51.3 ± 12.4 | –0.2 ± 8.5 | 0.751 | 50.9 ± 10.9 | 49.2 ± 10.4 | –1.7 ± 8.3 | 0.037 | 0.162 |
| LDL cholesterol (mg/dL) | 130.3 ± 33.7 | 131.7 ± 34.9 | 1.4 ± 22.5 | 0.515 | 134.0 ± 40.9 | 132.4 ± 32.1 | –1.6 ± 35.7 | 0.618 | 126.1 ± 33.4 | 126.9 ± 34.2 | 0.7 ± 28.6 | 0.785 | 0.715 |
| Triglycerides (mg/dL) | 219.1 ± 144.0 | 204.9 ± 152.8 | –14.2 ± 139.8 | 0.290 | 175.0 ± 95.0 | 153.4 ± 75.8 | –21.6 ± 76.2 | 0.002 | 182.6 ± 123.7 | 183.3 ± 121.9 | 0.7 ± 103.1 | 0.943 | 0.281 |
| Blood pressure | |||||||||||||
| Systolic blood pressure (mmHg) | 133.2 ± 18.1 | 132.4 ± 17.9 | –0.8 ± 14.6 | 0.553 | 132.9 ± 17.1 | 129.5 ± 17.2 | –3.4 ± 15.3 | 0.016 | 135.8 ± 16.4 | 130.8 ± 16.0 | –5.0 ± 14.3 | < 0.0001 | 0.106 |
| Diastolic blood pressure (mmHg) | 89.0 ± 12.0 | 86.9 ± 11.8 | –2.2 ± 11.1 | 0.044 | 86.6 ± 12.3 | 84.0 ± 11.7 | –2.6 ± 10.9 | 0.009 | 89.1 ± 11.3 | 84.8 ± 12.2 | –4.3 ± 10.4 | < 0.0001 | 0.277 |
| Glucose homeostasis | |||||||||||||
| Fasting blood glucose (mg/dL) | 101.4 ± 17.1 | 100.8 ± 17.6 | –0.6 ± 10.2 | 0.539 | 101.7 ± 18.6 | 100.7 ± 14.3 | –1.0 ± 10.5 | 0.289 | 102.4 ± 14.9 | 103.3 ± 19.2 | 1.0 ± 9.9 | 0.296 | 0.297 |
| Insulin (μU/mL) | 8.3 ± 7.6 | 8.5 ± 6.5 | 0.3 ± 9.1 | 0.753 | 7.5 ± 4.1 | 8.3 ± 7.3 | 0.8 ± 6.7 | 0.170 | 7.5 ± 7.0 | 8.0 ± 5.5 | 0.6 ± 8.8 | 0.488 | 0.873 |
| HbA1c (%) | 5.7 ± 0.8 | 5.6 ± 0.7 | 0.0 ± 0.3 | 0.189 | 5.6 ± 0.7 | 5.6 ± 0.6 | 0.0 ± 0.3 | 0.404 | 5.7 ± 0.6 | 5.7 ± 0.6 | 0.0 ± 0.3 | 0.403 | 0.256 |


 PDF
PDF Citation
 Print
Print


 XML Download