Abstract
Background
Methods
Results
Supplementary Material
Supplemental Table S1.
Supplemental Table S2.
REFERENCES
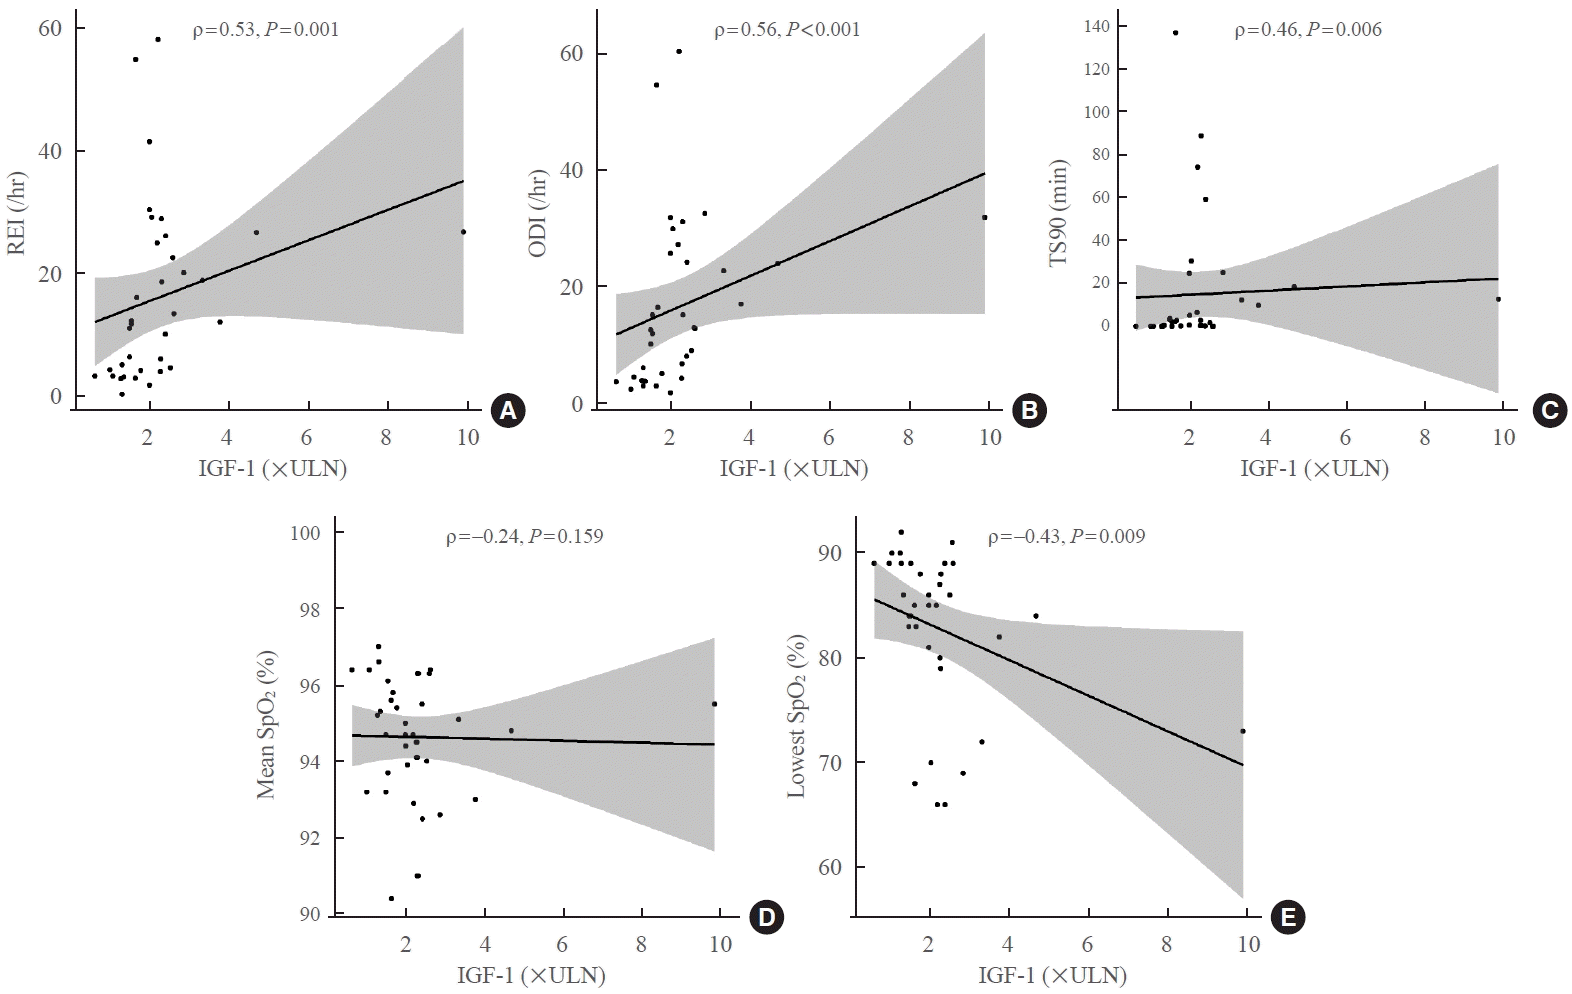
Fig. 1.

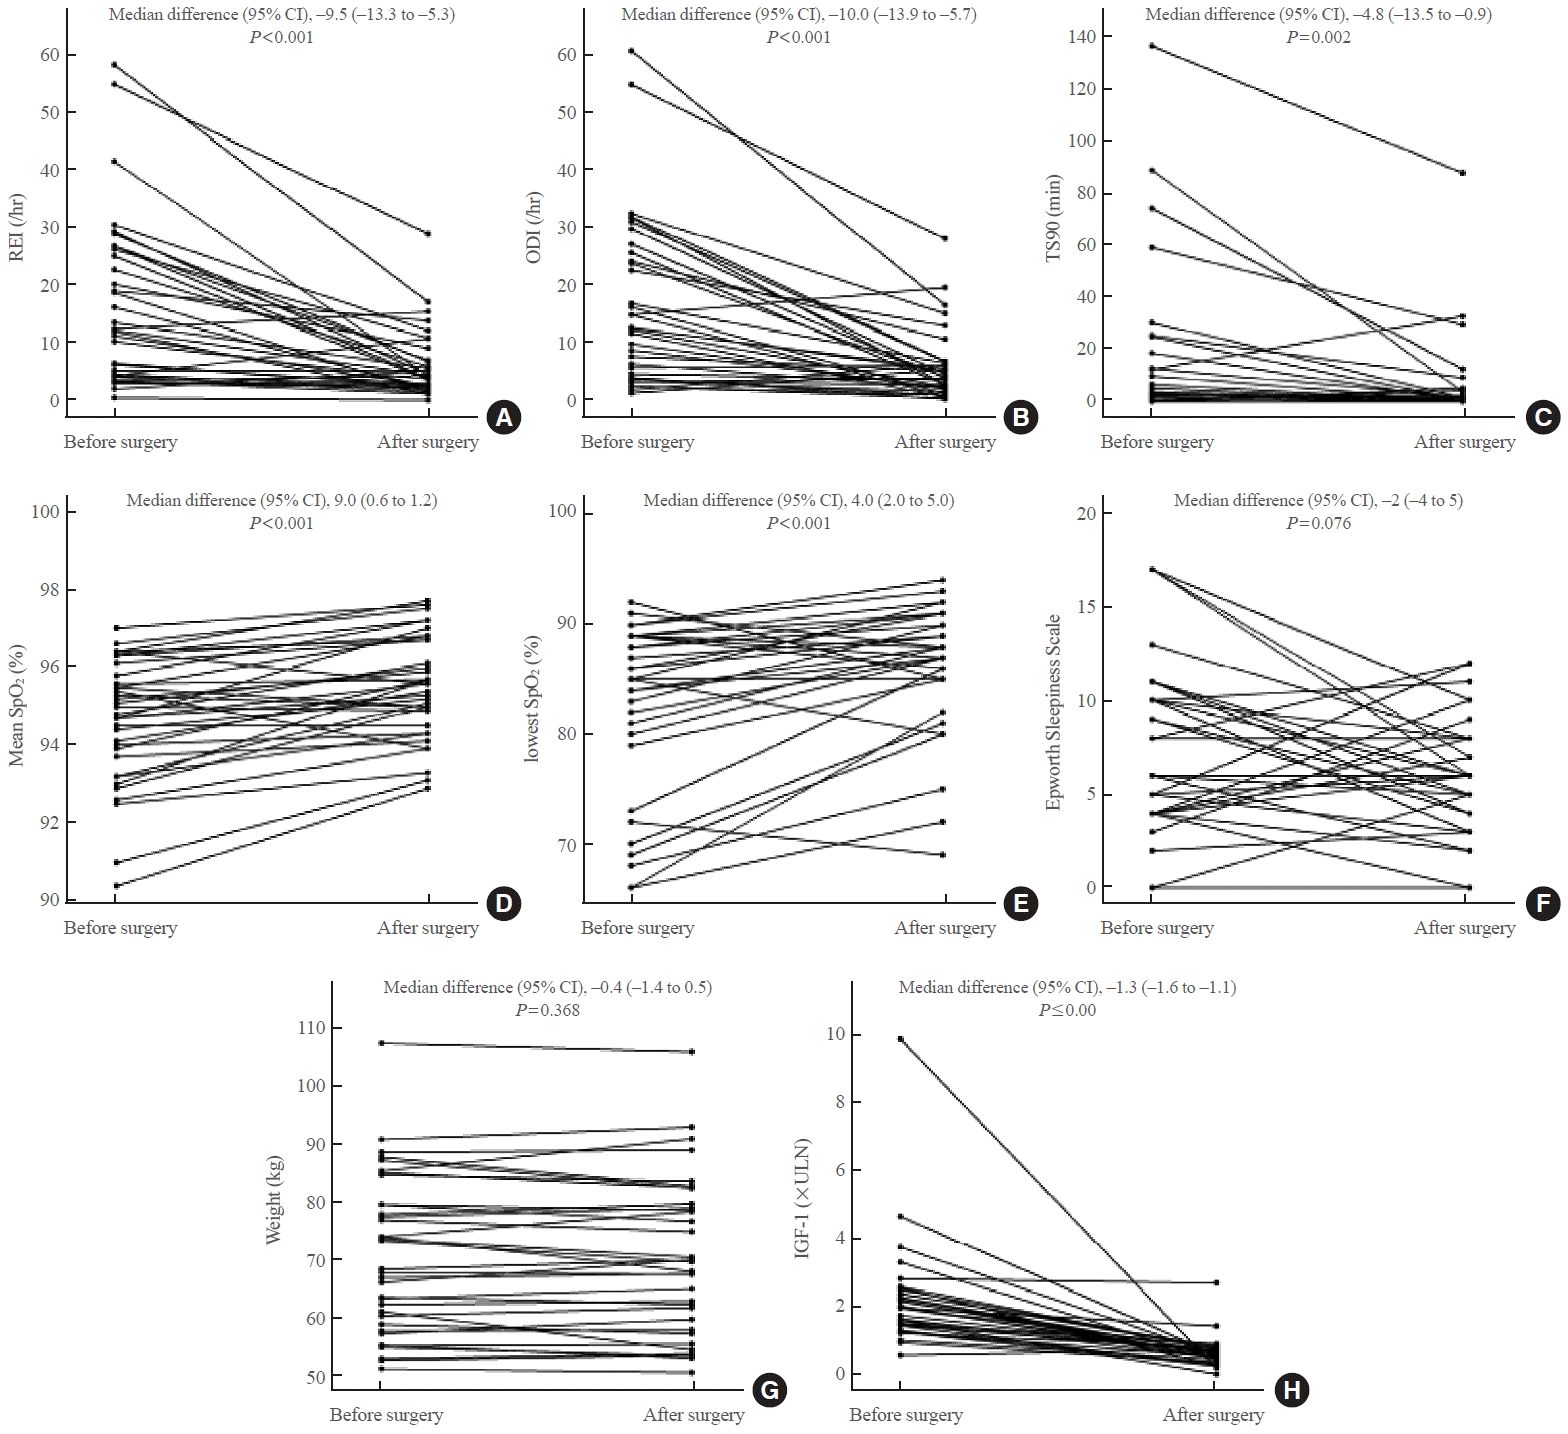
Fig. 2.

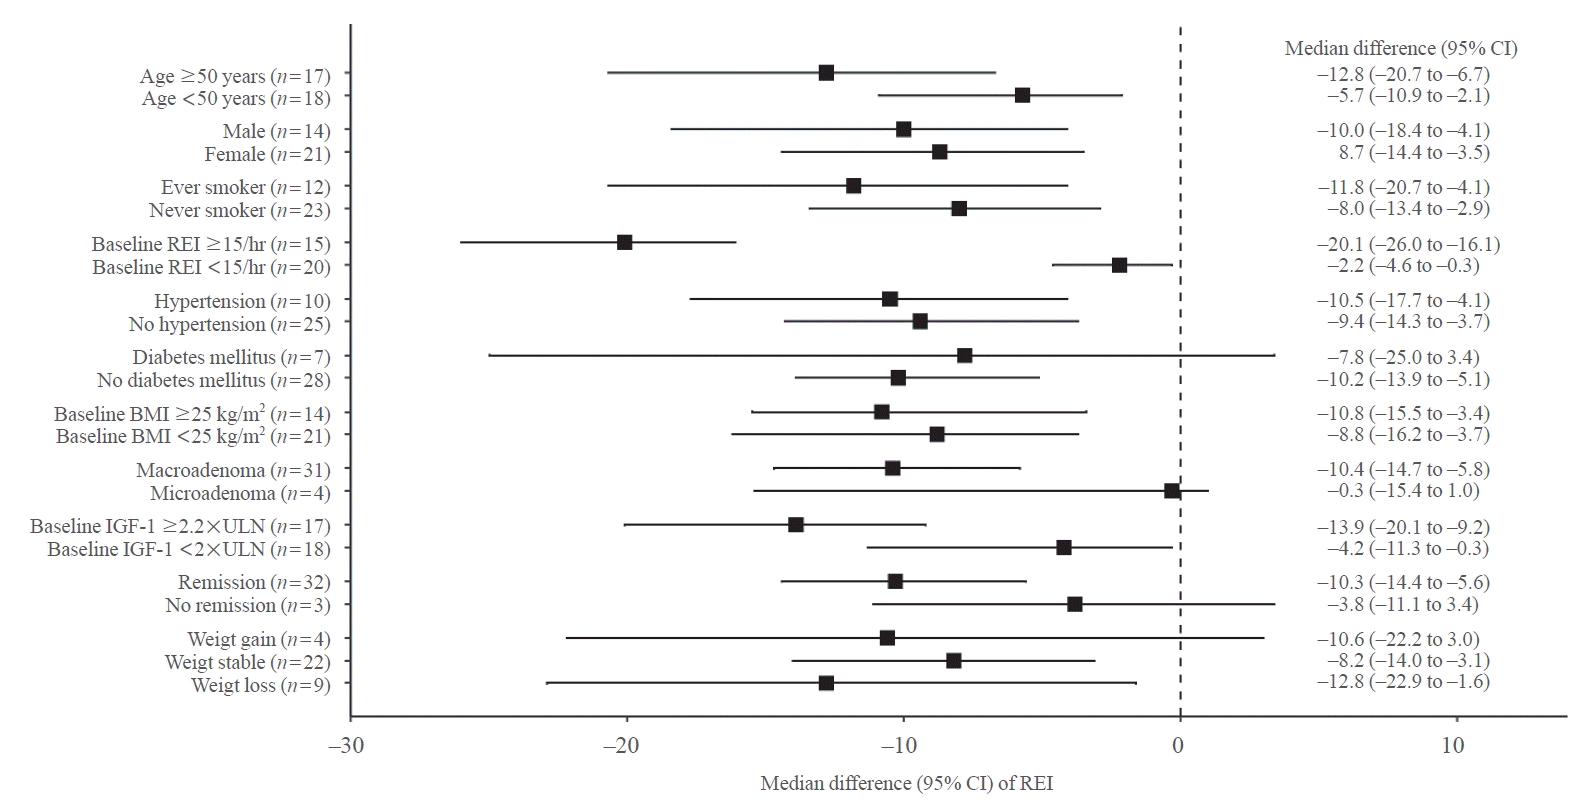
Fig. 3.

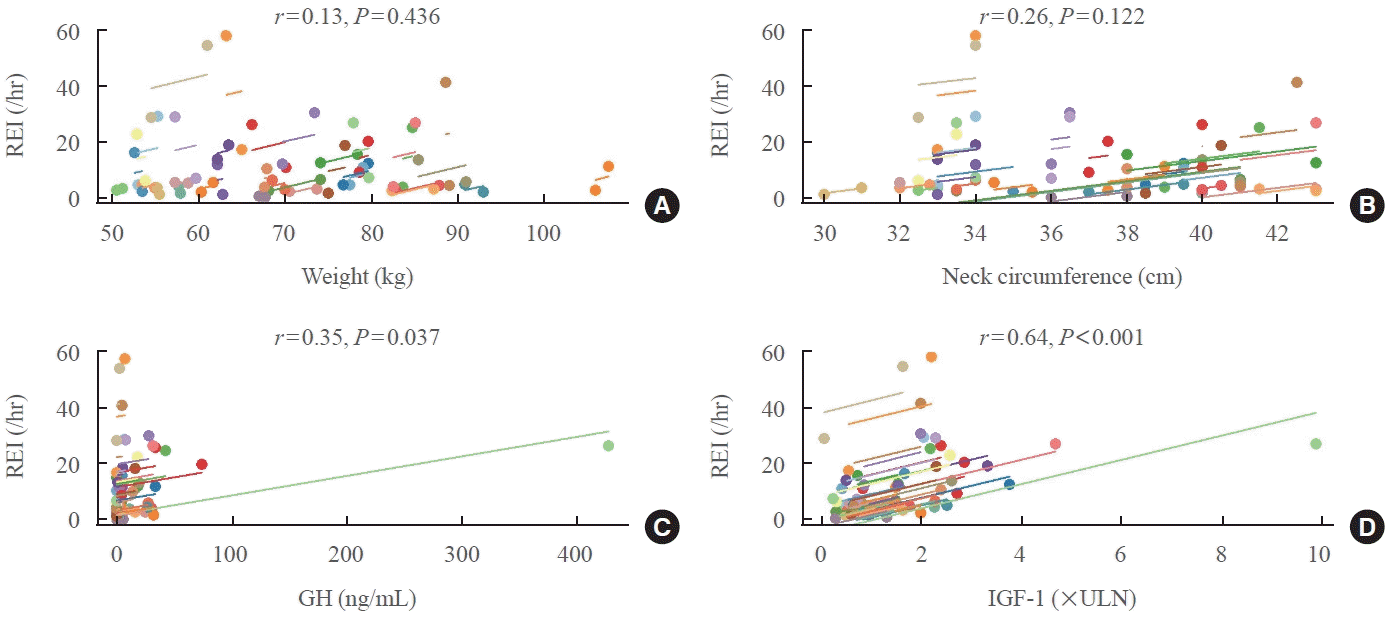
Fig. 4.

Table 1.
Values are expressed as median (interquartile range) or number (%).
OSA, obstructive sleep apnea; REI, respiratory event index; BMI, body mass index; STOP-Bang, Snoring, Tiredness, Observed apnea, high blood Pressure-Body mass index, Age, Neck circumference, and Gender; GH, growth hormone; OGTT, oral glucose tolerance test; IGF-1, insulin-like growth factor 1; ULN, upper limit of normal; ACTH, adrenocorticotropic hormone; TSH, thyroid-stimulating hormone; HbA1c, glycated hemoglobin; SpO2, oxygen saturation; TS90, sleep time spent with oxygen saturation <90%; ODI, oxygen desaturation index.
Table 2.
STOP-Bang, Snoring, Tiredness, Observed apnea, high blood Pressure-Body mass index, Age, Neck circumference, and Gender; OSA, obstructive sleep apnea; CI, confidence interval; PPV, positive predictive value; NPV, negative predictive value; REI, respiratory event index; ESS, Epworth Sleepiness Scale.
Table 3.
| Parameter | Before surgery | After surgery | Median difference (95% CI)a | P value |
|---|---|---|---|---|
| REI, /hr | 12.2 (4.3–25.6) | 4.3 (2.3–6.9) | –9.5 (–13.3 to –5.3) | <0.001 |
| Supine REI, /hr | 18.7 (9.9–36.0) | 7.4 (4.1–16.1) | –12.0 (–18.9 to –7.4) | <0.001 |
| ODI, /hr | 13.0 (4.9–25.1) | 4.5 (2.7–6.9) | –10.0 (–13.9 to –5.7) | <0.001 |
| Supine ODI, /hr | 17.2 (11.0–37.7) | 6.6 (3.5–18.2) | –13.2 (–20.0 to –7.9) | <0.001 |
| TS90, min | 2.3 (0.2–12.5) | 0.3 (0.0–2.0) | –4.8 (–13.5 to –0.9) | 0.002 |
| TS90, % | 0.5 (0.0–3.0) | 0.1 (0.0–0.4) | –1.4 (–3.2 to –0.3) | 0.002 |
| Mean SpO2, % | 94.8 (93.8–95.7) | 95.6 (94.7–96.7) | 0.9 (0.6 to 1.2) | <0.001 |
| Lowest SpO2, % | 85.0 (80.5–89.0) | 88.0 (85.0–90.0) | 4.0 (2.0 to 5.0) | <0.001 |
| Mean apnea duration, sec | 20.6 (15.4–24.5) | 21.0 (16.9–29.2) | 0.6 (–3.5 to 4.9) | 0.786 |
| Longest apnea duration, sec | 34.1 (24.3–45.7) | 27.9 (21.1–47.3) | –3.3 (–11.1 to 4.8) | 0.313 |
| Epworth Sleepiness Scale | 8 (4–10) | 6 (4–8) | –2 (–4 to 5) | 0.076 |
| Weight, kg | 68.5 (58.2–79.6) | 69.7 (58.8–79.3) | –0.4 (–1.4 to 0.5) | 0.368 |
| Neck circumference, cm | 37.5 (34.0–40.5) | 36.0 (33.0–39.2) | –1.0 (–1.5 to –0.5) | 0.002 |
| TSH, μIU/mL | 1.0 (0.7–1.6) | 1.1 (0.7–2.1) | 0.1 (–0.1 to 0.3) | 0.252 |
| Free T4, ng/dL | 1.1 (1.1–1.2) | 1.2 (1.1–1.3) | 0.1 (0.01 to 0.1) | 0.014 |
| GH, ng/mL | 14.3 (5.1–28.0) | 0.3 (0.1–1.2) | –15.9 (–20.7 to –10.4) | <0.001 |
| Nadir GH during OGTT, ng/mL | 6.0 (3.3–22.1) | 0.2 (0.1–0.5) | –11.4 (–15.3 to –5.1) | <0.001 |
| IGF-1, ng/mL | 615.0 (492.0–792.0) | 204.0 (134.0–263.5) | –404.1 (–497.0 to –323.0) | <0.001 |
| IGF-1, ×ULN | 2.0 (1.5–2.4) | 0.6 (0.5–0.8) | –1.3 (–1.6 to –1.1) | <0.001 |
Values are expressed as median (interquartile range). P value from the Wilcoxon signed-rank test.
CI, confidence interval; REI, respiratory event index; ODI, oxygen desaturation index; TS90, sleep time spent with oxygen saturation <90%; SpO2, oxygen saturation; TSH, thyroid-stimulating hormone; T4, thyroxine; GH, growth hormone; OGTT, oral glucose tolerance test; IGF-1, insulin-like growth factor 1; ULN, upper limit of normal.
Table 4.
Model 1 adjusted for age and baseline REI that were selected by the Lasso method among preoperative variables at baseline; Model 2 adjusted for baseline REI and change in IGF-1 levels that were selected by the Lasso method among preoperative and postoperative variables.
CI, confidence interval; REI, respiratory event index; IGF-1, insulin-like growth factor 1; ULN, upper limit of normal.


 PDF
PDF Citation
 Print
Print


 XML Download