INTRODUCTION
METHODS
1. Study Settings
Fig. 1.
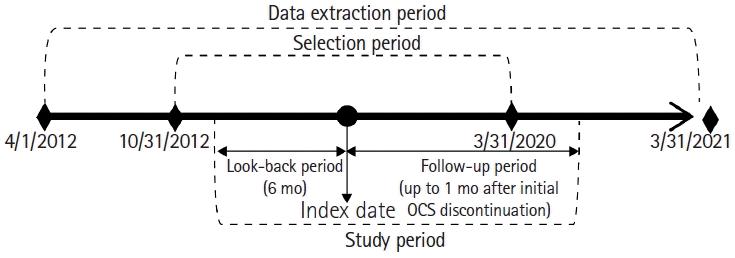
2. Data Source
3. Inclusion and Exclusion Criteria
4. Outcomes
5. Study Sample Size
6. Statistical Analysis
RESULTS
1. Patient and Treatment Characteristics
Fig. 2.
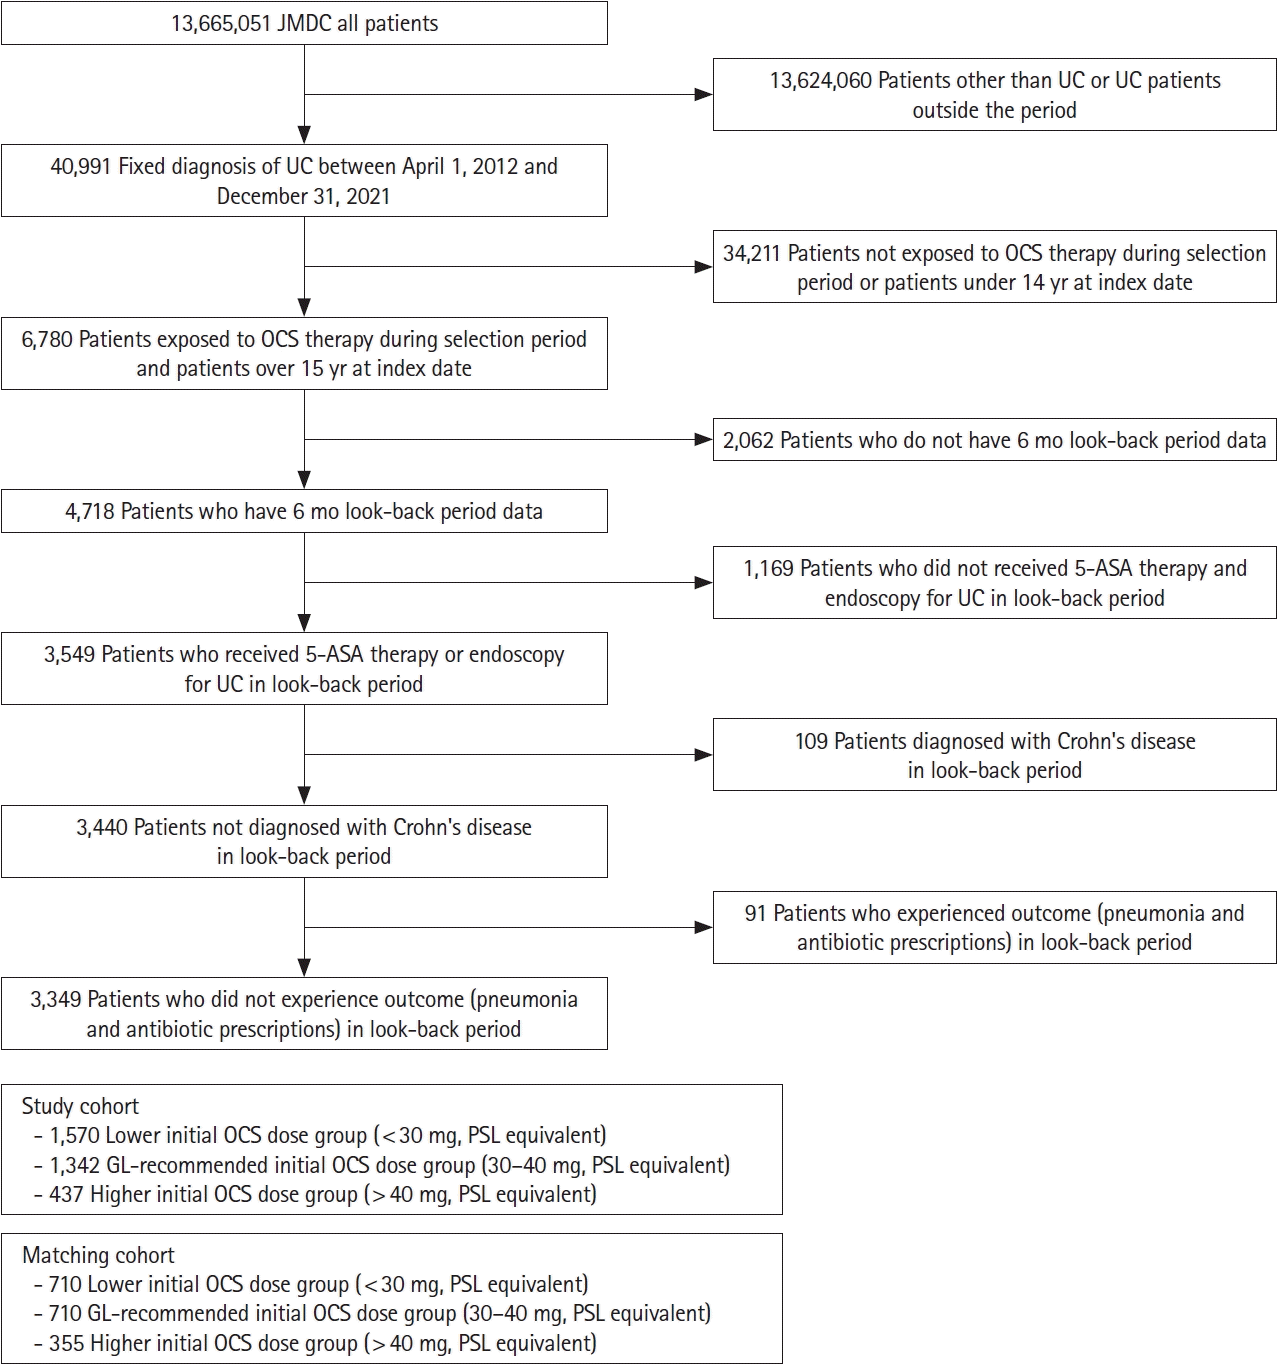
Table 1.
| Baseline characteristics |
Before PS matching |
After PS matching |
|||||||||
|---|---|---|---|---|---|---|---|---|---|---|---|
| <30 mg (n=1,570) | 30–40 mg (n=1,342) | >40 mg (n=437) | SMDa | SMDb | < 30 mg (n = 710) | 30–40 mg (n = 710) | > 40 mg (n = 355) | SMDa | SMDb | ||
| Age (yr) | Mean ± SD | 42.7 ± 12.3 | 39.5 ± 13.7 | 41.8 ± 12.2 | 0.246 | 0.178 | 41.3 ± 12.62 | 41.3 ± 13.43 | 41.6 ± 12.19 | 0.002 | 0.021 |
| Median (IQR) | 44 (34–52) | 40 (28–50) | 42 (34–50) | 42 (32–51) | 42 (31–51) | 42 (33–50) | |||||
| Age category 1 | ≤ 19 yr | 61 (3.88) | 108 (8.05) | 20 (4.58) | 0.297 | 0.289 | 44 (6.20) | 48 (6.76) | 18 (5.07) | 0.107 | 0.152 |
| 20–29 yr | 200 (12.73) | 272 (20.27) | 58 (13.27) | 101 (14.23) | 112 (15.77) | 47 (13.24) | |||||
| 30–39 yr | 347 (22.10) | 279 (20.78) | 95 (21.74) | 158 (22.25) | 146 (20.56) | 82 (23.10) | |||||
| 40–49 yr | 459 (29.23) | 318 (23.70) | 144 (33.00) | 205 (28.87) | 194 (27.3) | 111 (31.27) | |||||
| 50–59 yr | 382 (24.33) | 266 (19.82) | 86 (19.68) | 153 (21.55) | 151 (21.32) | 73 (20.56) | |||||
| 60–69 yr | 112 (7.13) | 88 (6.56) | 32 (7.32) | 46 (6.48) | 51 (7.18) | 22 (6.20) | |||||
| ≥ 70 yr | 9 (0.57) | 11 (0.82) | 2 (0.48) | 3 (0.42) | 8 (1.13) | 2 (0.56) | |||||
| Age category 2 (elderly) | 15–64 yr | 1,532 (97.58) | 1,309 (97.54) | 426 (97.48) | 0.003 | 0.004 | 699 (98.45) | 689 (97.04) | 347 (97.75) | 0.095 | 0.044 |
| ≥ 65 yr | 38 (2.42) | 33 (2.46) | 11 (2.52) | 11 (1.55) | 21 (2.96) | 8 (2.25) | |||||
| Sex | Male | 902 (57.45) | 861 (64.16) | 281 (64.30) | 0.138 | 0.003 | 443 (62.39) | 452 (63.66) | 220 (61.97) | 0.026 | 0.035 |
| Female | 668 (42.55) | 481 (35.84) | 156 (35.70) | 267 (37.61) | 258 (36.34) | 135 (38.03) | |||||
| Smoking history | No | 793 (50.51) | 590 (43.96) | 212 (48.51) | 0.087 | 0.029 | 364 (51.27) | 346 (48.73) | 179 (50.42) | 0.073 | 0.028 |
| Yes | 137 (8.73) | 129 (9.61) | 50 (11.44) | 63 (8.87) | 73 (10.28) | 35 (9.86) | |||||
| Unknown | 640 (40.76) | 623 (46.42) | 175 (40.05) | 283 (39.86) | 291 (40.99) | 141 (39.72) | |||||
| BMI (kg/m2) | Mean ± SD | 22.6 ± 3.24 | 22.9 ± 3.76 | 23.0 ± 3.55 | 0.083 | 0.029 | 22.6 ± 3.19 | 22.7 ± 3.33 | 22.8 ± 3.33 | 0.041 | 0.032 |
| Median (IQR) | 22.1 (20.3–24.5) | 22.5 (20.3–24.9) | 22.7 (20.5–25) | 22.2 (20.3–24.4) | 22.4 (20.2–24.6) | 22.6 (20.5–24.9) | |||||
| BMI categoryc | Underweight | 68 (4.33) | 59 (4.40) | 17 (3.89) | 0.100 | 0.073 | 29 (4.08) | 31 (4.37) | 15 (4.23) | 0.038 | 0.042 |
| Normal weight | 702 (44.71) | 515 (38.38) | 196 (44.85) | 311 (43.80) | 326 (45.92) | 156 (43.94) | |||||
| Obesity 1 | 181 (11.53) | 154 (11.48) | 60 (13.72) | 86 (12.11) | 83 (11.69) | 46 (13.00) | |||||
| Obesity 2 | 30 (1.91) | 34 (2.53) | 12 (2.75) | 13 (1.83) | 12 (1.69) | 8 (2.25) | |||||
| Unknown | 589 (37.52) | 580 (43.22) | 152 (34.78) | 271 (38.17) | 258 (36.33) | 130 (36.62) | |||||
| CCI | Mean (SD) | 0.74 ± 1.23 | 0.60 ± 1.06 | 0.84 ± 1.46 | 0.119 | 0.189 | 0.62 ± 0.98 | 0.63 ± 1.08 | 0.72 ± 1.22 | 0.005 | 0.079 |
| Median (IQR) | 0 (0–1) | 0 (0–1) | 0 (0–1) | 0 (0–1) | 0 (0–1) | 0 (0–1) | |||||
| CCI category | Low (0) | 884 (56.31) | 829 (61.77) | 250 (57.21) | 0.126 | 0.156 | 413 (58.17) | 427 (60.14) | 212 (59.72) | 0.079 | 0.066 |
| Medium (1–2) | 581 (37.01) | 451 (33.61) | 152 (34.78) | 269 (37.89) | 247 (34.79) | 121 (34.08) | |||||
| High (3–4) | 82 (5.22) | 48 (3.58) | 24 (5.49) | 23 (3.24) | 29 (4.08) | 16 (4.51) | |||||
| Very high (≥ 5) | 23 (1.46) | 14 (1.04) | 11 (2.52) | 5 (0.70) | 7 (0.99) | 6 (1.69) | |||||
| Comorbidity | Allergic disease | 635 (40.45) | 434 (32.34) | 146 (33.41) | 0.169 | 0.023 | 258 (36.34) | 246 (34.65) | 125 (35.21) | 0.035 | 0.012 |
| Rheumatic disease | 30 (1.91) | 9 (0.67) | 5 (1.14) | 0.110 | 0.050 | 6 (0.85) | 7 (0.99) | 5 (1.41) | 0.015 | 0.039 | |
| Concomitant drug | 5-ASA | 1,468 (93.50) | 1,284 (95.68) | 408 (93.36) | 0.096 | 0.102 | 681 (95.92) | 678 (95.49) | 339 (95.49) | 0.021 | 0.000 |
| AZA | 81 (5.16) | 75 (5.59) | 27 (6.18) | 0.019 | 0.025 | 39 (5.49) | 41 (5.77) | 22 (6.20) | 0.012 | 0.018 | |
| 6-MP | 13 (0.83) | 12 (0.89) | 7 (1.60) | 0.007 | 0.064 | 3 (0.42) | 4 (0.56) | 2 (0.56) | 0.020 | 0.000 | |
| Tacrolimus | 22 (1.40) | 4 (0.30) | 1 (0.23) | 0.120 | 0.013 | 0 | 0 | 0 | 0.000 | 0.000 | |
| Biologics | 72 (4.59) | 38 (2.83) | 20 (4.58) | 0.093 | 0.092 | 25 (3.52) | 22 (3.10) | 7 (1.97) | 0.024 | 0.072 | |
| JAK-inhibitor | 1 (0.06) | 2 (0.15) | 0 | 0.026 | 0.055 | 0 | 0 | 0 | 0.000 | 0.000 | |
| No. of beds at a medical facility | 0–19 | 924 (58.85) | 325 (24.22) | 142 (32.49) | 0.760 | 0.225 | 262 (36.90) | 264 (37.18) | 132 (37.18) | 0.031 | 0.092 |
| 20–99 | 83 (5.29) | 107 (7.97) | 25 (5.72) | 50 (7.04) | 51 (5.77) | 22 (6.20) | |||||
| 100–199 | 73 (4.65) | 105 (7.82) | 29 (6.64) | 53 (7.46) | 48 (6.76) | 26 (7.32) | |||||
| 200–299 | 58 (3.69) | 71 (5.29) | 16 (3.66) | 36 (5.07) | 35 (4.93) | 13 (3.66) | |||||
| 300–499 | 156 (9.94) | 303 (22.58) | 79 (18.08) | 118 (16.62) | 122 (17.18) | 58 (16.34) | |||||
| ≥ 500 | 276 (17.58) | 431 (32.12) | 146 (33.41) | 191 (26.90) | 190 (26.76) | 104 (29.30) | |||||
| Prophylactic TMP-SMX | No | 1,518 (96.69) | 1,119 (83.38) | 385 (88.10) | 0.455 | 0.135 | 695 (97.89) | 693 (97.61) | 346 (97.46) | 0.019 | 0.009 |
| Yes | 52 (3.31) | 223 (16.62) | 52 (11.90) | 15 (2.11) | 17 (2.39) | 9 (2.54) | |||||
| Hospitalization at index date | No | 1,307 (83.25) | 845 (62.97) | 343 (78.49) | 0.470 | 0.346 | 574 (80.85) | 581 (81.83) | 289 (81.41) | 0.025 | 0.011 |
| Yes | 263 (16.75) | 497 (37.03) | 94 (21.51) | 136 (19.15) | 129 (18.17) | 66 (18.59) | |||||
c Underweight (<18.5 kg/m2), normal weight (≥18.5 and <25.0 kg/m2), obesity 1 (≥25.0 and <30.0 kg/m2), obesity 2 (≥30.0 kg/m2).
PS, propensity score; SMD, standardized mean difference; SD, standard deviation; IQR, interqurtile range; BMI, body mass index; CCI, Charlson Comorbidity Index; 5-ASA, 5-aminosalicylic acid; AZA, azathioprine; 6-MP, 6-mercaptopurine; JAK, Janus kinase inhibitor; TMP-SMX, trimethoprim/sulfamethoxazole.
2. OCS Treatment
Fig. 3.
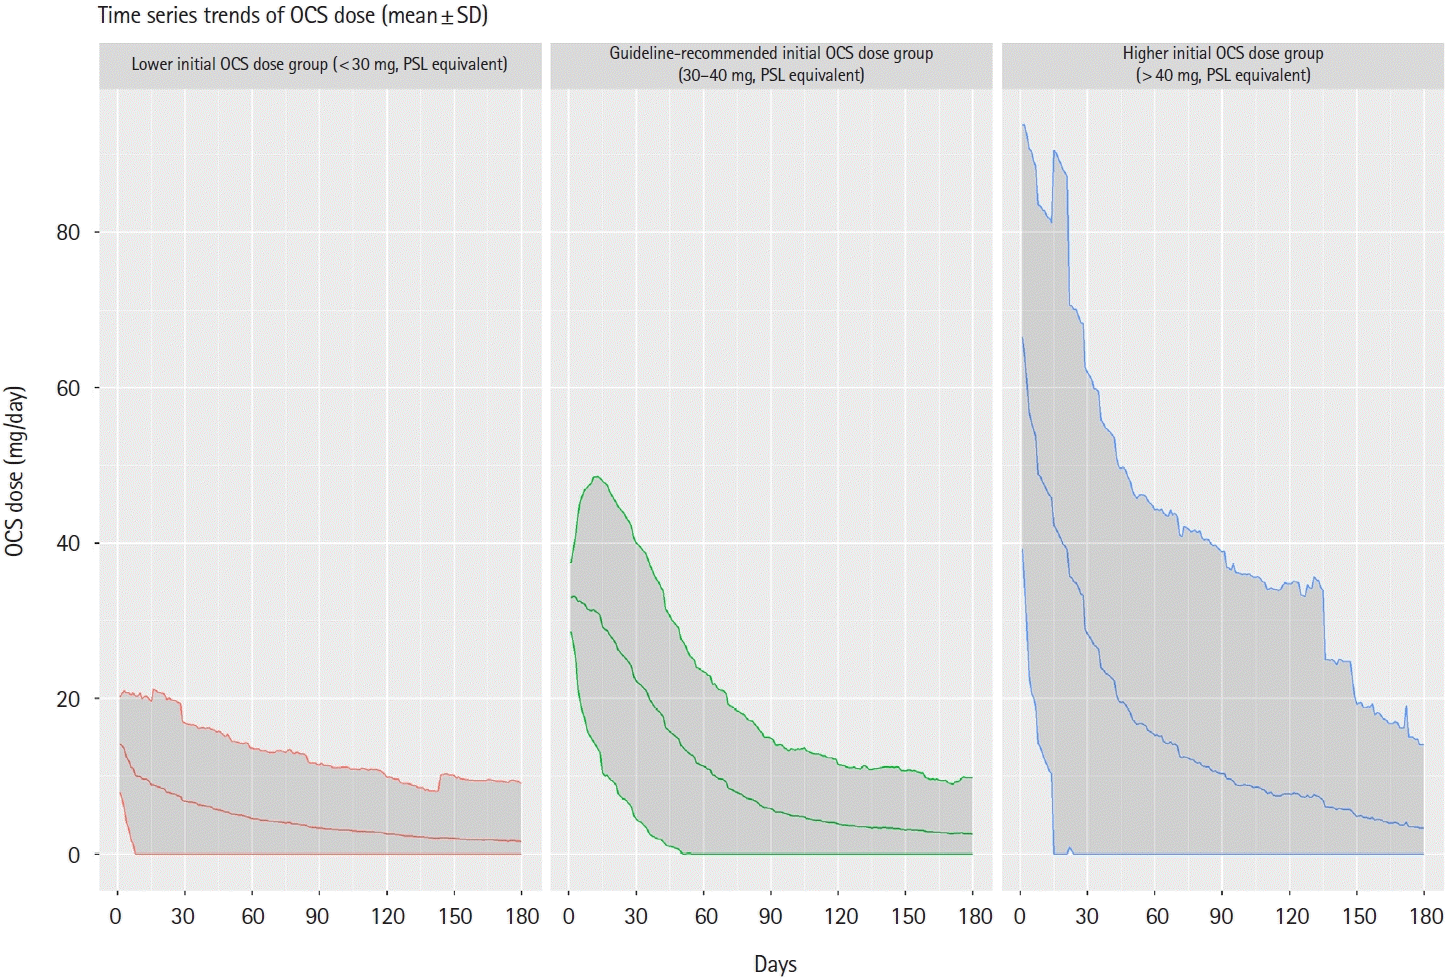
Table 2.
3. Incidence and Risk of Pneumonia
Fig. 4.
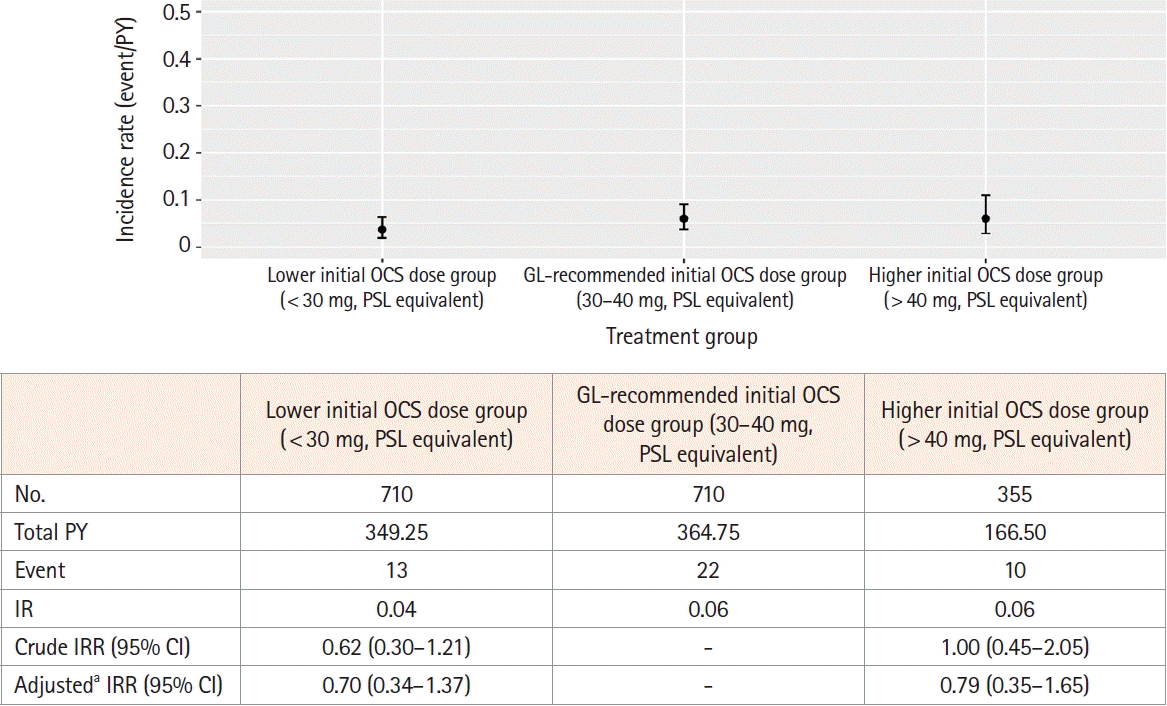
Fig. 5.
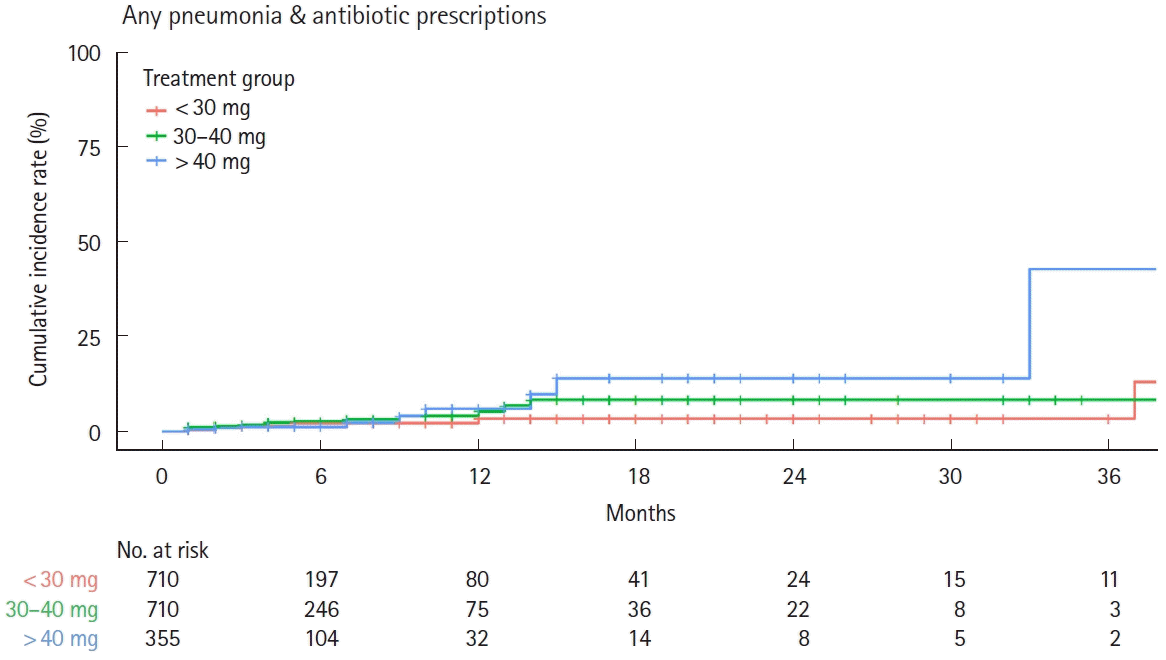
Fig. 6.
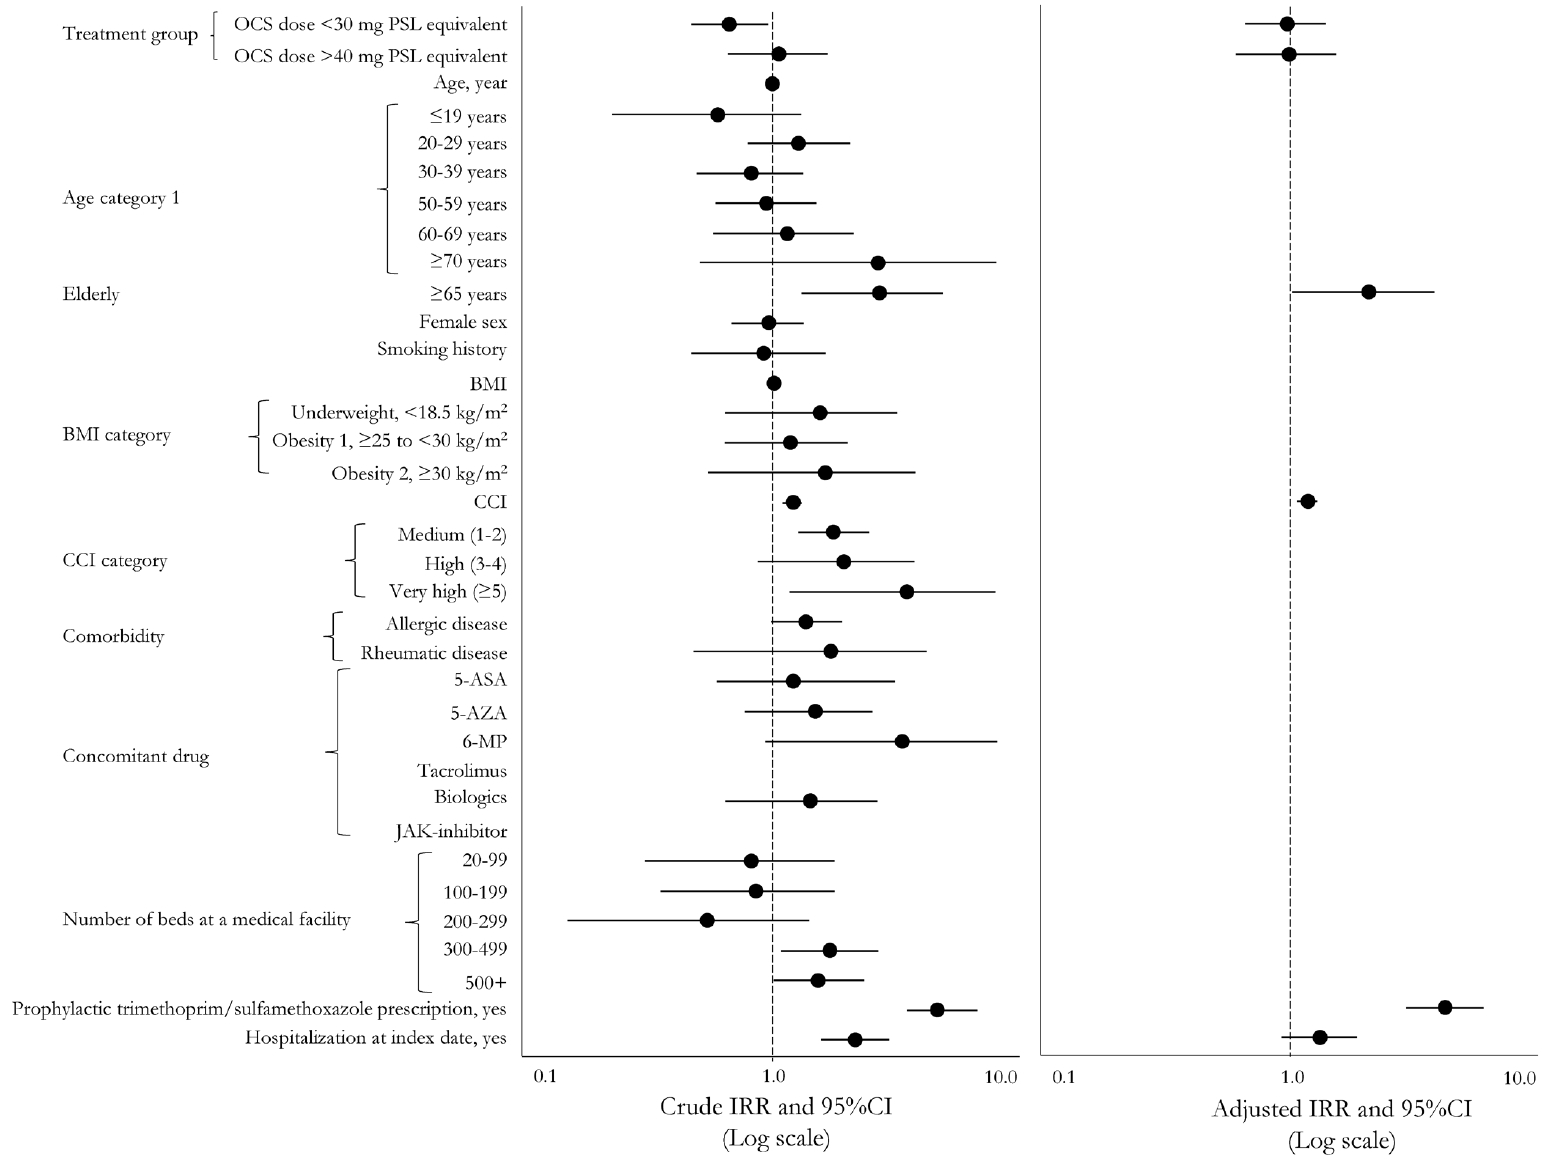
Table 3.
PY, patient year; IR, incidence rate; IRR, incidence rate ratio; CI, confidence interval; OCS, oral corticosteroids; GL, guideline; PSL, prednisolone; BMI, body mass index; CCI, Charlson Comorbidity Index; 5-ASA, 5-aminosalicylic acid; AZA, azathioprine; 6-MP, 6-mercaptopurine; JAK, Janus kinase inhibitor; TMP-SMX, trimethoprim/sulfamethoxazole.


 PDF
PDF Citation
 Print
Print


 XML Download