Abstract
Background
Methods
Results
SUPPLEMENTARY MATERIALS
Supplementary Table 1.
Supplementary Table 2.
Supplementary Table 3.
Supplementary Table 4.
Supplementary Table 5.
Supplementary Table 6.
Notes
CONFLICTS OF INTEREST
Dae Ho Lee has been international editorial board Members of the Diabetes & Metabolism Journal since 2023. He was not involved in the review process of this article. Otherwise, there was no conflict of interest.
AUTHOR CONTRIBUTIONS
Conception or design: D.H.L.
Acquisition, analysis, or interpretation of data: all authors.
Drafting the work or revising: S.J.C., S.Y., D.H.L.
Final approval of the manuscript: all authors.
FUNDING
This study was supported by grants from the Korea Health Technology R&D Project through the Korea Health Industry Development Institute (KHIDI), which is funded by the Ministry of Health & Welfare, Korea (HI14C1135); the Basic Science Research Program through the National Research Foundation of Korea (NRF) funded by the Ministry of Education (NFR-2019 R1I1A2A02062305), the National Research Foundation of Korea (NRF) grant funded by the Korean government (MSIT) (No. NRF-2021R1A5A2030333), and the Gachon University Gil Medical Center (FRD2021-03). The funders had no role in the study design, data collection and analysis, decision to publish, or preparation of the manuscript.
REFERENCES
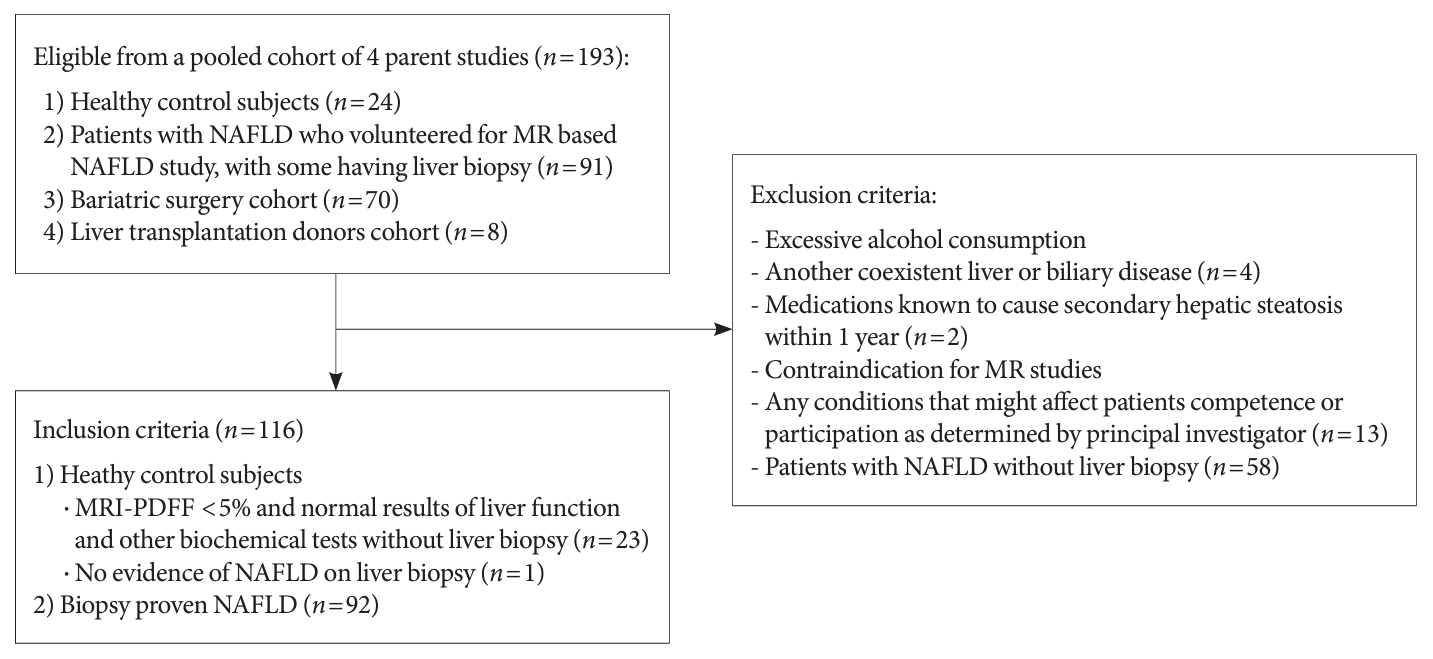
Fig. 1.

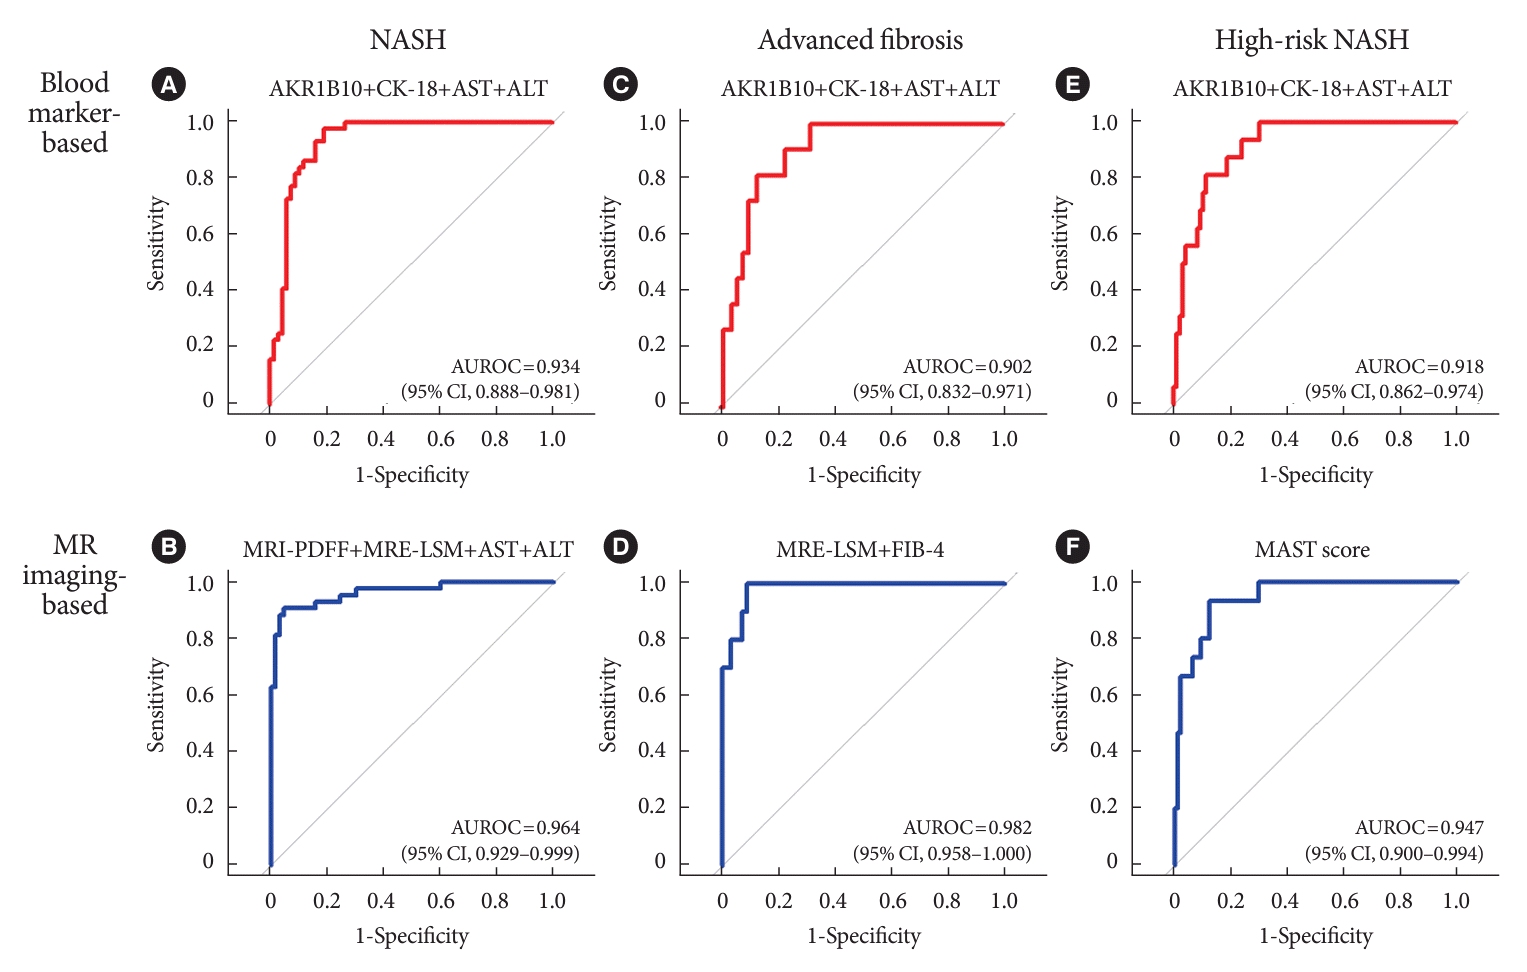
Fig. 2.

Table 1.
| Characteristic | Control (n=24) | NAFL (n=48) | NASH/cirrhosis (n=44) | P value |
|---|---|---|---|---|
| Age, yr | 36.0±15.7 | 34.2±9.0 | 35.4±12.4 | 0.813 |
| Sex, male/female | 17/7 | 10/38b | 11/33d | <0.001 |
| Weight, kg | 66.7±11.4 | 93.3±19.8b | 101.9±20.7d,e | <0.001 |
| BMI, kg/m2 | 23.0±3.1 | 34.8±6.7b | 37.3±6.7d | <0.001 |
| SBP, mm Hg | 130.2±16.9 | 121.2±14.9a | 127.5±12.7e | 0.026 |
| DBP, mm Hg | 83.4±11.9 | 82.9±10.3 | 86.8±10.1 | 0.177 |
| AST, U/L | 20.8±5.6 | 36.5±43.2a | 76.8±45.7d,f | <0.001 |
| ALT, U/L | 18.4±7.1 | 49.7±73.2a | 108.5±76.1d,f | <0.001 |
| FIB-4 | 0.82±0.45 | 0.59±0.37a | 1.35±2.27c | 0.039 |
| NFS | –2.727±1.035 | –2.899±1.265 | –2.141±2.154e | 0.079 |
| WBC, ×109/L | 5.2±1.7 | 7.5±2.1b | 8.1±1.9d | <0.001 |
| Platelets, ×109/L | 229.0±52.4 | 317.2±72.8b | 308.7±104.2d | <0.001 |
| hs-CRP, mg/dL | 0.13±0.21 | 0.62±0.73 | 0.70±0.52 | 0.093 |
| Hemoglobin A1c, % | 5.4±0.4 | 6.1±1.8a | 6.6±1.6d | 0.008 |
| Glucose, mg/dL | 89.3±6.9 | 114.2±54.3a | 120.1±49.3d | 0.032 |
| Insulin, μU/mL | 6.7±3.9 | 23.9±34.3a | 28.0±23.5d | 0.002 |
| HOMA-IR | 1.5±1.0 | 7.1±12.0a | 9.1±8.2d | 0.006 |
| C3, mg/dL | 104.7±16.3 | 149.8±30.4b | 170.3±34.5d,e | <0.001 |
| C4, mg/dL | 26.5±5.6 | 34.9±10.5a | 38.2±13.1d | 0.009 |
| AKR1B10, pg/mL | 549.8±235.2 | 1,771.7±4,006.9a | 8,058.3±6,574.5d,f | <0.001 |
| CK-18, U/L | 72.2±37.3 | 218.7±252.9b | 637.0±467.8d,f | <0.001 |
| ELF | 8.2±0.8 | 8.4±0.8 | 8.8±1.1c | 0.039 |
| MRI-PDFF, % | 3.4±0.8 | 13.2±6.9b | 23.4±9.4d,f | <0.001 |
| MRE-LSM, kPa | 3.1±0.5 | 2.8±0.5 | 3.9±1.5c,f | <0.001 |
| TE-CAP, dB/m | 216.5±37.9 | 314.1±51.2b | 344.7±45.6d,e | <0.001 |
| TE-LSM, kPa | 3.8±0.9 | 7.1±6.6a | 12.6±9.4d,e | <0.001 |
| FAST score | 0.05±0.05 | 0.27±0.23b | 0.65±0.24d,f | <0.001 |
| MAST score | 0.02±0.01 | 0.05±0.09a | 0.36±0.27d,f | <0.001 |
Values are presented as mean±standard deviation.
NAFL, nonalcoholic fatty liver; NASH, nonalcoholic steatohepatitis; BMI, body mass index; SBP, systolic blood pressure; DBP, diastolic blood pressure; AST, aspartate aminotransferase; ALT, alanine aminotransferase; FIB-4, fibrosis-4 index; NFS, nonalcoholic fatty liver disease (NAFLD) fibrosis score; WBC, white blood cell; hs-CRP, high-sensitivity C-reactive protein; HOMA-IR, homeostasis model assessment of insulin resistance; AKR1B10, aldo-keto reductase family 1 member B10; CK-18, cytokeratin 18; ELF, enhanced liver fibrosis; MRI, magnetic resonance imaging; PDFF, proton density fat fraction; MRE, magnetic resonance elastography; LSM, liver stiffness measurement; TE, transient elastography; CAP, controlled attenuation parameter; FAST, FibroScan-AST; MAST, MRI-AST.
Table 2.
NASH, nonalcoholic steatohepatitis; AUROC, area under the receiver operating characteristic curve; CI, confidence interval; PPV, positive predictive value; NPV, negative predictive value; AKR1B10, aldo-keto reductase family 1 member B10; CK-18, cytokeratin 18; FIB-4, fibrosis-4 index; NFS, nonalcoholic fatty liver disease (NAFLD) fibrosis score; ELF, enhanced liver fibrosis; AST, aspartate aminotransferase; ALT, alanine aminotransferase; MRI, magnetic resonance imaging; PDFF, proton density fat fraction; MRE, magnetic resonance elastography; LSM, liver stiffness measurement; FAST, FibroScan-AST; MAST, MRI-AST.
Table 3.
AUROC, area under the receiver operating characteristic curve; CI, confidence interval; PPV, positive predictive value; NPV, negative predictive value; AKR1B10, aldo-keto reductase family 1 member B10; CK-18, cytokeratin 18; FIB-4, fibrosis-4 index; NFS, nonalcoholic fatty liver disease (NAFLD) fibrosis score; ELF, enhanced liver fibrosis; AST, aspartate aminotransferase; ALT, alanine aminotransferase; MRE, magnetic resonance elastography; LSM, liver stiffness measurement; FAST, FibroScan-AST; MAST, magnetic resonance imaging-AST.
Table 4.
NASH, nonalcoholic steatohepatitis; NAS, nonalcoholic fatty liver disease (NAFLD) activity score; AUROC, area under the receiver operating characteristic curve; CI, confidence interval; PPV, positive predictive value; NPV, negative predictive value; AKR1B10, aldo-keto reductase family 1 member B10; CK-18, cytokeratin 18; FIB-4, fibrosis-4 index; NFS, NAFLD fibrosis score; ELF, enhanced liver fibrosis; AST, aspartate aminotransferase; ALT, alanine aminotransferase; MRI, magnetic resonance imaging; PDFF, proton density fat fraction; MRE, magnetic resonance elastography; LSM, liver stiffness measurement; FAST, FibroScan-AST; MAST, MRI-AST.


 PDF
PDF Citation
 Print
Print


 XML Download