Abstract
Background
Methods
Results
Notes
AUTHOR CONTRIBUTIONS
Conception or design: D.T.W.L., C.H.L., Y.C.W., K.C.B.T.
Acquisition, analysis, or interpretation of data: D.T.W.L., Y.W., C.H.Y.F.
Drafting the work or revising: D.T.W.L., K.H.T., K.C.B.T.
Final approval of the manuscript: all authors.
FUNDING
The study received funding support from the Diabetes Hongkong Diabetes Care Research Fund (RF202201). David Tak Wai Lui is a recipient of Li Ka Shing Medical Fellowship for Internal Medicine (2023). The funders had no role in study design, data collection and analysis, decision to publish, or preparation of the manuscript.
REFERENCES
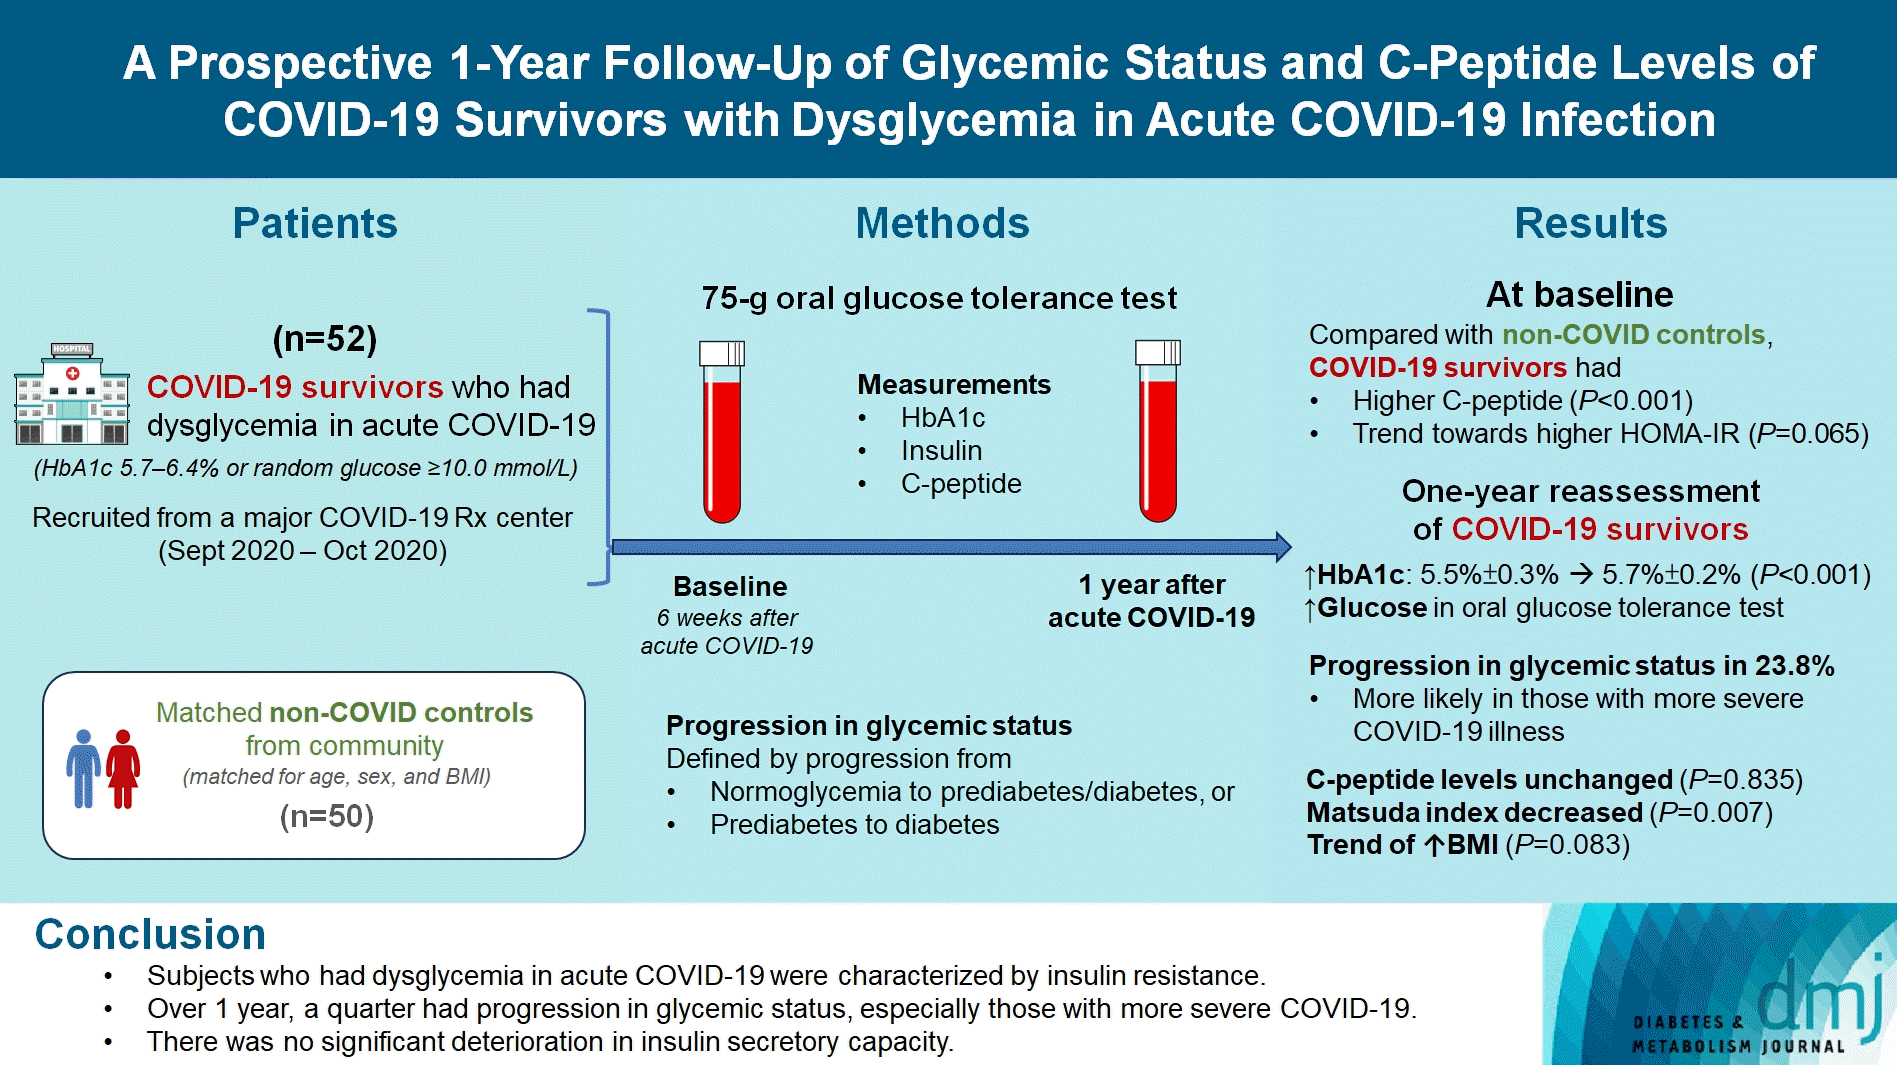
Table 1.
| Characteristic | COVID-19 survivors | Non-COVID controls | P value |
|---|---|---|---|
| Number | 52 | 50 | |
| Age, yr | 61.2±8.8 | 59.8±3.5 | 0.304 |
| Male sex | 26 (50.0) | 23 (46.0) | 0.686 |
| BMI, kg/m2 | 24.6±3.1 | 23.9±2.9 | 0.236 |
| Fasting glucose, mmol/L | 5.1±0.5 | 5.1±0.4 | 0.997 |
| HbA1c, % | 5.5±0.3 | 5.6±0.3 | 0.894 |
| HOMA-IRa | 1.40 (0.94–2.32) | 1.18 (0.90–1.80) | 0.065 |
| HOMA-βa | 89.6 (61.8–122.0) | 65.1 (48.4–101.8) | 0.047 |
| C-peptidea, nmol/L | 0.66 (0.56–0.83) | 0.52 (0.45–0.66) | 0.001 |
Values are presented as mean±standard deviation, number (%), or median (interquartile range).
COVID-19, coronavirus disease 2019; BMI, body mass index; HbA1c, glycosylated hemoglobin; HOMA-IR, homeostasis model assessment of insulin resistance; HOMA-β, homeostasis model assessment of β-cell function.
Table 2.
| Variable | Baseline | One-year reassessment | P value |
|---|---|---|---|
| BMI, kg/m2 | 24.4±2.7 | 25.6±5.2 | 0.083 |
| HbA1c, % | 5.5±0.3 | 5.7±0.2 | <0.001 |
| Fasting glucose, mmol/L | 5.06±0.44 | 5.17±0.45 | 0.089 |
| 30-minute glucose, mmol/L | 8.81±1.64 | 9.13±1.75 | 0.126 |
| 1-hour glucose, mmol/L | 8.65±2.25 | 9.47±2.60 | 0.014 |
| 2-hour glucose, mmol/L | 6.52±1.91 | 6.86±1.83 | 0.165 |
| C-peptidea, nmol/L | 0.67 (0.54–0.84) | 0.67 (0.54–0.92) | 0.835 |
| HOMA-IRa | 1.39 (0.91–2.21) | 1.47 (1.14–2.22) | 0.235 |
| HOMA-βa | 89.5 (64.2–122.2) | 89.4 (53.8–106.2) | 0.679 |
| Matsuda indexa | 5.40 (3.51–9.64) | 4.94 (2.81–6.32) | 0.007 |
Table 3.
| Characteristic | Progressors | Non-progressors | P value |
|---|---|---|---|
| Number | 10 | 32 | |
| Age, yr | 62.0±7.5 | 61.3±8.9 | 0.811 |
| Male sex | 4 (40.0) | 17 (53.1) | 0.469 |
| BMI, kg/m2 | 24.0±3.1 | 24.4±2.6 | 0.681 |
| Fasting glucose, mmol/L | 5.01±0.34 | 5.06±0.47 | 0.746 |
| HbA1c, % | 5.36±0.21 | 5.54±0.21 | 0.074 |
| C-peptidea, nmol/L | 0.83 (0.61–0.98) | 0.64 (0.50–0.80) | 0.119 |
| HOMA-IRa | 1.52 (1.19–1.97) | 1.28 (0.90–2.19) | 0.706 |
| HOMA-βa | 88.6 (64.5–137.2) | 89.3 (60.7–121.2) | 0.588 |
| Matsuda indexa | 4.33 (3.55–7.17) | 6.65 (3.62–10.1) | 0.344 |
| COVID-19 severity | 0.030 | ||
| Mild | 4 (40.0) | 23 (71.9) | |
| Moderate | 3 (30.0) | 7 (21.9) | |
| Severe | 3 (30.0) | 2 (6.3) |
Values are presented as mean±standard deviation, number (%), or median (interquartile range).
COVID-19, coronavirus disease 2019; BMI, body mass index; HbA1c, glycosylated hemoglobin; HOMA-IR, homeostasis model assessment of insulin resistance; HOMA-β, homeostasis model assessment of β-cell function.


 PDF
PDF Citation
 Print
Print


 XML Download