Journal List > Obstet Gynecol Sci > v.67(4) > 1516087831

You, Kang, Sung, Park, Cho, Choi, Oh, and Roh: The influence of advanced maternal age on congenital malformations, short- and long-term outcomes in offspring of nulligravida: a Korean National Cohort Study over 15 years

Abstract

Objective

To assess the influence of advanced maternal age on congenital malformations, short- and long-term outcomes in offspring of nulligravida.

Methods

A retrospective study was conducted using the Korean National Health Insurance Service database spanning from January 2005 to December 2019. All live-born offspring of nulligravida (n=3,685,817) were included. The maternal age was subdivided into the following subgroups: <25 years (n=153,818), 25-29 years (n=845,355), 30-34 years (n=1,738,299), 35-39 years (n=787,530), 40-44 years (n=151,519), and >44 years (n=9,296). Outcomes were assessed based on International Classification of Diseases-10 codes. Adjusted odds ratios (aOR) were calculated with the group of 25-29 years as a reference.

Result

Most congenital malformations showed an age dependent increase, but cleft lip and abdominal wall defect exhibited a U-shape curve, indicating an increase even in those <25 years old. Similarly, various disorders included in the neonatal composite outcomes from short-term outcomes showed aged dependent escalation. However, the preterm birth from the short-term outcome and most of the long-term developmental outcomes, except for motor developmental delay and Tics, showed a U-shaped pattern. The aOR of autism and cerebral palsy, showing the most obvious U-shaped curved in the long-term outcomes, was 1.50 (95% confidence interval [CI], 1.24-1.82) and 1.54 (95% CI, 1.17-2.03), respectively in the group >44 years old and 1.18 (95% CI, 1.11-1.25) and 1.19 (95% CI, 1.09-1.30) in <25 years old group.

Conclusion

Overall, an advanced maternal age has an age-dependent correlation with most congenital malformations and shortand long-term outcomes of neonates.

Introduction

The inverse correlation between decreasing total birth rate and increasing age at the first pregnancy is a well-established global phenomenon. According to the 2021 data from the Centers for Disease Control and Prevention in the United States, nearly 19% of all pregnancies occurred in women aged 35 years and older [1]. Similarly, the Statistics Korea announced the percentage of women giving birth for the first time at age 35 and older tripled from 10.6% to 33.4% between 2005 and 2019 [2,3]. Additionally, in 2020, 7.3% of total births were delivered by mothers aged 40 years and older [2,3]. This trend could be attributed to various factors, including delayed marriage, enhanced access to reproductive technology and medical services, and improved socioeconomic status of women.
The increasing prevalence of pregnancies in women of advanced maternal age, defined as 35 years and older, is a major concern, because advanced maternal age is known to be a risk factor of pregnancy-related complications, such as gestational diabetes, small for gestational age, and preeclampsia [4-6]. Moreover, studies have consistently shown that advanced maternal age is associated with adverse outcomes for the offspring as well, such as congenital malformations and chromosomal abnormalities [7]. In addition, there is an increased likelihood of preterm birth requiring neonatal intensive care unit (NICU) care, low birth weight, and intrauterine fetal death [1,7,8]. Given these risks, there is a compelling need to systematically investigate the effect of advanced maternal age on both mothers and their offspring. While reviewing published articles, we found that most previous studies on maternal age and pregnancy outcomes included both nulliparous and multiparous women together, which may underestimate the realistic impact of maternal age on pregnancy outcomes. Another point to consider is that the existing studies were more focused on short-term pregnancy outcomes rather than the long-term outcomes of infants [8].
Considering this, we evaluated multifactorial perinatal and infantile pregnancy outcomes in relation to increasing maternal age, examining both short- and long-term outcomes in nulliparous women using Korean National Cohort data over 15 years. We analyzed these outcomes by subdividing maternal age into 5-year intervals (under 25, 25-29, 30-34, 35-39, 40-44, and over 44 years) and performed multivariable analysis after adjusting for confounders. If the trend of increasing maternal age is an inevitable social phenomenon, it seems crucial for obstetricians to assess and predict possible adverse effects in advanced aged nulligravida to provide appropriate counseling and management or, where possible, prevent such events altogether.

Materials and methods

1. Data source and study cohort

We conducted a nationwide retrospective cohort study using the Korean National Health Insurance Service (K-NHIS) database, which covers 50 million people (approximately 99% of the South Korean population), from 2004 to 2020 [9]. The K-NHIS database represents the entire population of South Korea and contains national records of all covered inpatient and outpatient visits, procedures, and prescriptions. The K-NHIS also includes data from annual or biennial health screening exams for adults and health examinations based on age group for infants provided free of charge by the Ministry of Health and Welfare.
Because we used 2004 as the washout period and 2020 as the follow-up period, our cohort included all pregnancies resulting in live births from January 1, 2005 to December 31, 2019, identified with procedure codes of obstetric delivery. We included all liveborn infants who were linked with their mothers and restricted the pregnancy cohort to women at delivery. We included first-delivery women in the dataset (n=3,685,817). Furthermore, for the sensitivity analysis, we restricted patients who had infant health screening exam 4 years prior to the baseline, and we used the weight of baby from the health screening exam.
The need for informed consent was waived as this study was conducted using anonymized claims data. This study was approved by the Institutional Review Board of our institution (SMC 2021-08-107).

2. Measurement

The K-NHIS data comprise individual-level demographics and all records of diagnosis and healthcare utilization (e.g., drug prescription and medical procedure), provided through inpatient, outpatient, and emergency department visits. The NHIS claims for inpatient and outpatient visits, procedures, and prescriptions were coded using the International Classification of Diseases (ICD), 10th revision [10]. The exposed group was age at initial birth. The study endpoints were chromosomal abnormalities, major congenital malformations, adverse short-term neonatal outcomes, and long-term developmental infant outcomes for the offspring. Chromosomal abnormalities and major congenital malformations were identified by diagnostic records, according to the ICD-10 codes defined by the European surveillance of congenital anomalies classification [11]. Chromosomal abnormalities were categorized into autosomal trisomy and others. Major congenital malformations were further categorized into 12 types of organ-specific malformations (Supplementary Table 1): 1) nervous system; 2) eye; 3) ear, face, and neck; 4) heart; 5) respiratory system; 6) oral cleft; 7) digestive system; 8) abdominal wall; 9) urinary system; 10) genital organs; 11) limb; and 12) other malformations [12]. Outcomes, including preterm birth (O60.1 and O60.3), placenta previa (O44 and O69.4), preeclampsia (O15), small for gestational age (O36.5), and large for gestational age (O36.6) were also investigated according to the ICD-10 codes. The short-term neonatal outcome was NICU admission and composite morbidity, which included any of the following: sepsis, transient tachypnea, respiratory distress syndrome, necrotizing enterocolitis, intraventricular hemorrhage, and bronchopulmonary dysplasia (Supplementary Table 1). The long-term outcome was defined according to pre-specified neurological and neurodevelopmental diagnoses as any one or more of the following: autism, attention-deficit/hyperactivity syndrome (ADHD), cerebral palsy, any developmental delay including motor or cognitive delay, epileptic and febrile seizures, and tics and stereotypic behavior as identified by diagnostic records according to the ICD-10 codes (Supplementary Table 1). As the NHIS routinely audits the claims, such data are considered reliable and used in numerous peer-reviewed publications [13,14]. In a validation study comparing our database and electronic medical records, the overall positive predictive value of diagnosis records was 82% [15].
We considered a broad range of covariates as potential confounders or proxies of potential confounders. Maternal comorbidities, including history of congestive heart failure, diabetes mellitus, renal disease, and cancer within the past year prior to birth were summarized using the Charlson’s index [16,17]. We also assessed hypertension (ICD-10 code: I10-I13, and I15), hypertensive disorders during pregnancy (ICD-10 code: O14, O11, O15, O13, O16, I10, and O10), gestational diabetes (ICD-10 code: O244 and O249), and overt diabetes (ICD-10 code: O240, O241, O242, O243, E10, E11, E12, E13, and E14). To control the confounding factors, we adjusted for Charlson’s index, chronic hypertension, hypertensive disorders during pregnancy, gestational diabetes, overt diabetes, cesarean delivery, income, neonatal sex, birth year, and multifetal pregnancies.
In addition, we obtained the birth weight for infants from the infant health screenings exam, which was provided by the K-NHIS and based on age group.

3. Statistical analysis

For major congenital malformations and short-term outcomes, odds ratios (ORs) with 95% confidence intervals (CIs) were calculated using logistic regression. For long-term outcomes, infants were followed from birth to event, death, or end of the study period (December 2020), whichever came first. Person-time was calculated from the date of birth to the date of the incidence of event, death, or last follow-up. We used the Cox proportional hazards regression models to estimate the hazard ratio (HR) with 95% CI to compare the control groups. We examined the proportional hazards assumption using plots of the log (-log) survival function and Schoenfeld residuals. Considering multifetal pregnancies, including twins, triplets, and higher-order pregnancies, could be correlated within a mother, and we performed a mixed model analysis to adjust for this correlation in all the analyses. We also modeled maternal age as a continuous variable using restricted cubic splines with knots at the 5th, 35th, 65th, and 95th percentiles of the sample distribution to visualize maternal age-dependent change in long-term infant outcomes.
Furthermore, we conducted a quantitative bias analysis based on the probabilistic method among unexposed pregnancies without malformation where (P00) was defined as 80% [18]. Following this, the probability of live birth among unexposed pregnancies with malformations where (P10) was considered to be 60%, based on a previous study [19]. In addition, a five-time-higher frequency of stillbirth was considered in the older group compared with that in the general population based on previous literature [20]. Considering a difference in probability of live births between the older and younger groups, the corrected relative risks were calculated as follows: corrected OR and observed OR× (P10×P01/P11×P00).
All analyses were two-sided and P-values <0.05 were considered statistically significant. Statistical analyses were performed using SAS version 9.2 (SAS Institute Inc, Cary, NC, USA) and R software version 3.3.2 (R Foundation for Statistical Computing, Vienna, Austria).

Results

1. Study population

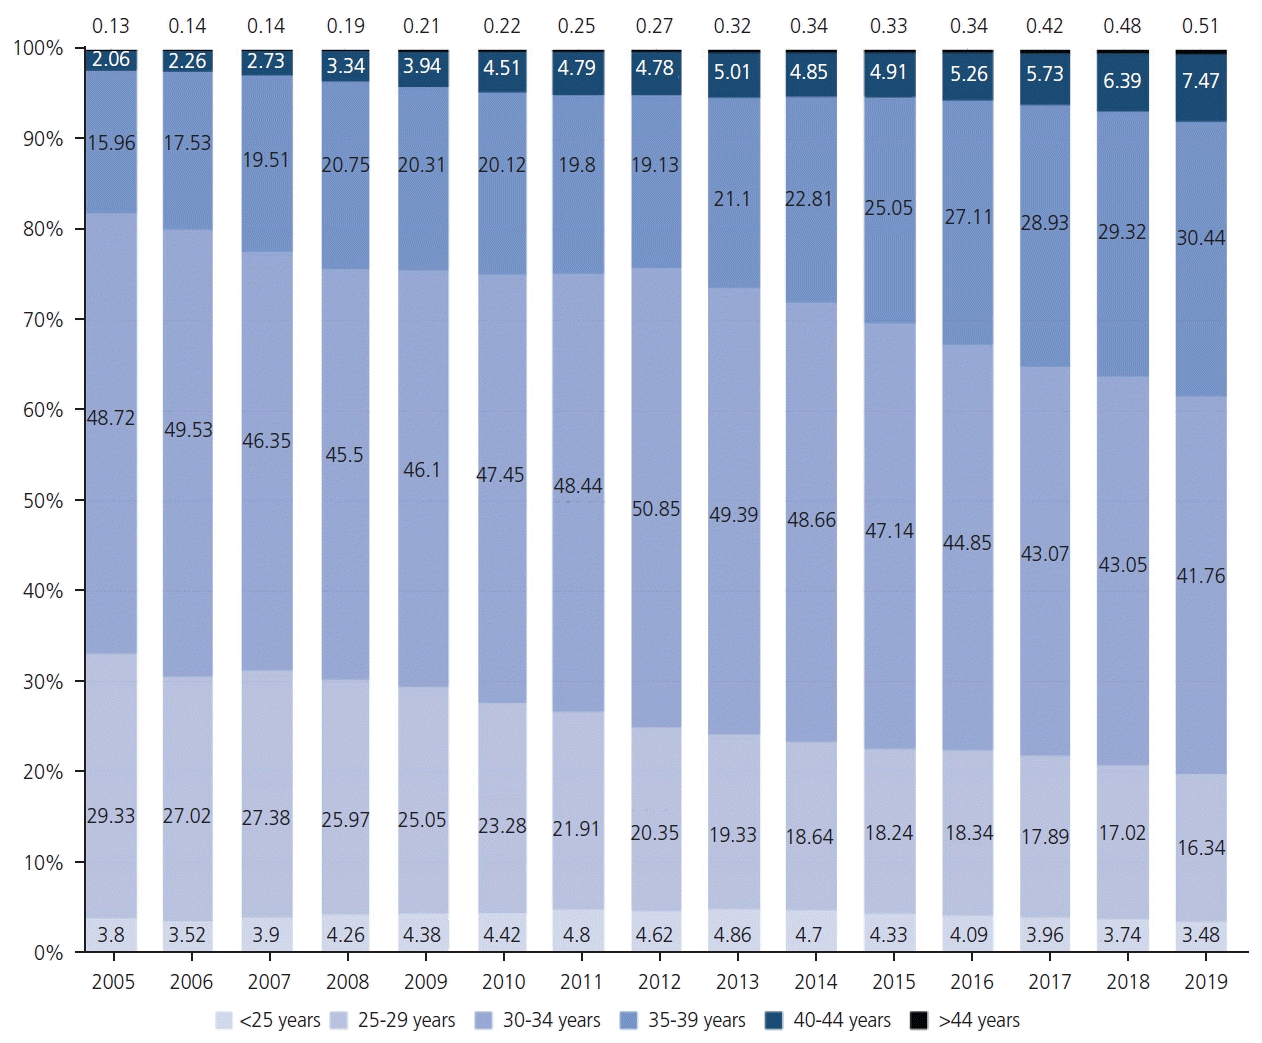
The median (inter-quartile) age of study participants was 32 years (29-35). Of all participants, 4.2%, 22.9%, 47.1%, 21.4%, 4.1%, and 0.3% were the first birth at age <25 years, 25-29 years, 30-34 years, 35-39 years, 40-44 years, and >44 years, respectively, during the total study period. The changes in maternal age over the study period are depicted in Fig. 1. In detail, 15.96% of pregnant women in 2005 and 30.44% in 2019 were between the ages of 35 and 39. Only 2.06% of pregnant women were between the ages of 40 and 45 in 2005; however, this proportion increased to 7.47% in 2019.

2. Characteristics of study population

Table 1 summarizes the characteristics of study population, including maternal and neonatal outcomes according to the maternal age group. Advanced maternal age, defined as 35 years old and older, was associated with higher family income, decreased residency in rural areas, and increased Charlson index. As for pregnancy outcomes, there was a correspondingly higher prevalence of hypertension and diabetes during pregnancy according to advanced maternal age. The rate of cesarean delivery was also significantly increased as follows: 29.5%, 34.7%, 40.5%, 52.5%, 65.3%, and 74.0% in ages <25 years, 25-29 years, 30-34 years, 35-39 years, 40-44 years, and >44 years, respectively. Of note, the rate of multifetal pregnancies peaked in the group with mothers aged 35-39 years (6.0%), whereas preterm delivery rate showed a stepwise increase with advancing maternal age, peaking at 8.3% in nulligravida women above 44 years. Supplementary Table 2 shows additional analyses on some perinatal complications, including placenta previa, preeclampsia, and small and large for gestational age based on maternal age groups. Placenta previa exhibited an age-dependent increase, whereas preeclampsia and small for gestational age showed a U-shaped curve. Of note, the adjusted odds ratios (aOR) placenta previa also showed a stepwise increase, with the highest risk in women aged over 44 years (OR, 3.74; 95% CI, 3.28-4.27).

3. Chromosomal abnormalities and congenital malformations

The absolute risks of offspring with a chromosomal abnormality were 0.06%, 0.04%, 0.06%, 0.09%, 0.21%, and 0.86% in ages <25 years, 25-29 years, 30-34 years, 35-39 years, 40-44 years, and >44 years, respectively. The aORs for chromosomal abnormalities increased in the advanced maternal age group, with a particularly significant increase in autosomal trisomy (Table 2). Of note, the group <25 years also had a higher risk for autosomal trisomy compared with that of the reference group (age, 25-29 years).
The absolute risks for major congenital malformations were 2.9%, 3.0%, 3.4%, 4.1%, 4.8%, and 6.0% in ages <25 years, 25-29 years, 30-34 years, 35-39 years, 40-44 years, and >44 years, respectively. Overall, the aORs of most congenital malformations tended to increase in the advanced maternal age group after adjusting for potential confounders. The most significant dose-response relationship between maternal age and congenital malformations was observed in infant heart defects with the highest risk in women aged over 44 years (OR, 1.46; 95% CI, 1.31-1.62). The highest risk among congenital malformations was found in oral cleft in women aged over 44 years (OR, 2.66; 95% CI, 1.81-3.91). Although maternal age and the risk of oral cleft also showed a dose-response relationship, the youngest age group (<25 years) also exhibited a higher risk (OR, 1.24; 95% CI, 1.05-1.46) compared with that of the reference group (age, 25-29 years), resulting in a U-shaped prevalence. Similarly, the OR of abdominal wall defects was also elevated in the youngest age group (under <25 years) (OR, 1.59; 95% CI, 1.22-2.07) compared with that of the reference group (Table 2).

4. Short-term outcomes

The aOR of preterm birth was elevated with increasing maternal age, with the highest risk observed in women aged over 44 years (OR, 1.85; 95% CI, 1.71-2.01) as shown in Table 3. Women aged <25 years also had a slightly increased risk for preterm birth (OR, 1.16; 95% CI, 1.13-1.20). As expected, the proportion of admittance to the NICU within a year showed similar trends with preterm birth. The composite outcome of infants showed a stepwise increase according to advanced maternal age. Among them, transient tachypnea, respiratory distress syndrome, and bronchopulmonary dysplasia were remarkable (Table 3).

5. Long-term outcomes

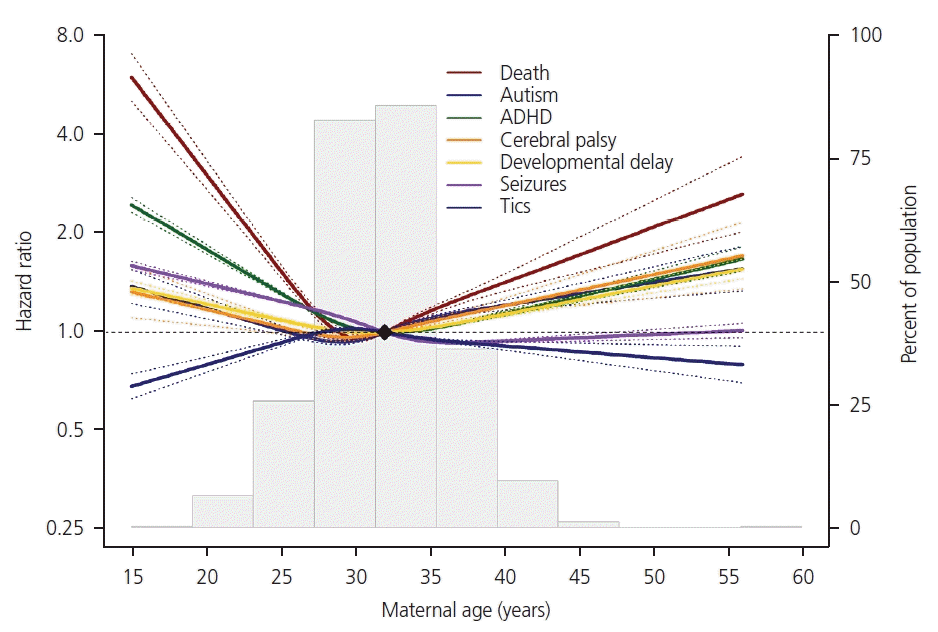
During the follow-up period (median, 10.4 years), 0.49, 0.24, 0.24, 0.32, 0.43, and 0.73 infants per 1,000 person-years passed away in age groups <25 years, 25-29 years, 30-34 years, 35-39 years, 40-44 years, and >44 years, respectively, manifesting a U-shape curve as shown in Table 4. For long-term developmental problems, the risk of autism, ADHD, cerebral palsy, and cognitive developmental delay increased with advancing maternal age, while offspring of women aged less than 25 years also had a relatively higher risk, and demonstrating a U-shaped prevalence (Table 4). Notably, the risk of epileptic and febrile seizures in offspring increased in the group aged <25 years; this group also showed the lowest adjusted risk for motor developmental delay and tic and stereotypic behavior (Table 4). When the result was represented as a restricted cubic spline curve (Fig. 2), death, ADHD, cerebral palsy, developmental delay, and seizures showed a non-linear association (P for non-linearity <0.05). As neonatal birth weight alone can influence long-term outcomes, a further regression model analysis was performed by adding neonatal weight as a confounding variable. However, not all infants have their birth weights recorded; therefore, the analysis was conducted based on the weights that were registered in the health screening exam. Consequently, the effect of maternal age on the overall developmental problems of offsprings were similar but attenuated as presented in Supplementary Table 3.

Discussion

Our study revealed significant age-related correlations with the risk of chromosomal abnormalities, major congenital malformations, and short and long-term neonatal outcomes in nulligravida women. Specifically, autosomal trisomy showed the strongest age-association with maternal age, and nearly all types of congenital malformations showed a stepwise trend, except for oral cleft and abdominal wall defects. The prevalence of preterm birth rate manifested as a U-shaped curve according to maternal age, being the lowest in the 25-30-year-old group. In addition, a U-shaped curve was noted in the relationship between maternal age and autism and cerebral palsy. Interestingly, in contrast to other long-term outcomes, we noticed that epileptic and febrile seizure events were more common among younger mothers.
Moreover, the older age groups showed a higher risk of congenital chromosomal abnormalities and phenotypic malformations, mothers younger than 25 years showed a higher risk of having oral cleft and abdominal wall defects. Such findings are consistent with those of many other previous studies and indicate that various environmental factors, such as low socioeconomic status, higher tobacco and alcohol abuse, and early unprotected sexual intercourse may contribute to the observed major phenotypic abnormalities [21,22]. Our data support this rationale, as the income level of young mothers was mostly distributed at the Q2-3 level whereas elderly mothers tended to be affiliated with the Q3-4 level.
In addition, we confirmed that preterm birth and NICU admission and other morbidities were higher in both young and aged mothers but the increase in aged mothers was more significant. The adjusted risk of preterm birth increased by 1.6-fold and 1.9-fold in patients aged 40-44 years and ≥45 years, respectively. According to the previous studies using United States and Turkish population data, the preterm birth risk for older mother varied from 1.35-fold to 1.8-fold, indicating that, while maternal age surely has an impact on the occurrence of preterm birth, ethnicity and other factors such as multifetal pregnancy should also be accounted for [1,5]. In addition, it was suggested that structural, molecular, and cellular changes may occur as the uterus ages with advancing maternal age, leading to effects on uterine vascular dysfunction and myometrial contractility [23]. Additionally, a recent study using animal models indicated that aging alters the properties of the uterine artery, influencing the outcomes of pregnancy [24].
In our study, we were able to achieve insightful and consistent observations because of our robust data. Although the trend of increasing maternal age at the first birth is a global phenomenon, a noticeable difference exists between countries. For instance, a comparison of data between the UK and South Korea revealed a much steeper increase in the mean maternal age in South Korea during the same period of 2017 to 2021 [2,25]. During that period, the mean age of mothers who gave birth in the UK increased from 30.5 to 30.9 according to the country’s 2021 consensus, while the mean age in South Korea rose from 31.62 to 32.62 as reported by Statistics Korean [2,25]. This profound change in the mean maternal age in a short period, coupled with 15 years of cumulative data on long-term infant development, allowed for nearly zero selection bias and intact data. Moreover, the population was divided into six different cohorts, narrowing the ranges of maternal age to clarify its influence on outcome variables.
Another notable feature of our study was the decision to only include results from nulligravida in order to minimize confounding factors related to second or subsequent births. The influence of parity on pregnancy outcomes is still a subject of controversy in the literature. While a few studies, such as the one conducted by Bai et al. [26], concluded that parity influences pregnancy outcomes, others, like Yimer et al. [27], suggested no difference. According to one study, women who experienced adverse pregnancy outcomes, including miscarriage, termination, and preterm birth showed higher levels of anxiety and depression and poorer quality of life during the subsequent pregnancy period [28], which may negatively affect the subsquent pregnancy outcome. Moreover, some adverse pregnancy outcomes, such as preterm delivery, low birth weight, and placenta previa are known predictors for subsequent adverse pregnancy outcomes [29,30]. Therefore, by excluding following pregnancies, which were proven to be influenced by prior outcomes, we could solely focus on the effect of maternal age.
An additional strength of our study was that we assessed cumulative long-term developmental outcomes of offsprings spanning a relatively long study period (median, 10.4 years) included in a national cohort and compared them according to the subdivided maternal age groups. While a few studies have examined short-term outcomes in neonates or focused on single-specific developmental disorders, such as autism or ADHD, follow-up studies with a long study period on multiple developmental disorders correlated with maternal age are scarce. In our study, we found that the risk of autism and cerebral palsy exhibited a U-shaped curve, reaching its lowest in the maternal age group of 25-30 years. Of note, this ratio was not lowered; conversely, it was elevated by adding neonatal weight as a confounder. This observation is in line with those of previous studies indicating that older maternal age itself increases the risk of autism [31-33]. On the contrary, the hard ratio for some developmental problems were substantially attenuated by adjusting neonatal birth weight. For example, the adjusted HR for cerebral palsy in the maternal age group of 40-44 years was lowered to a non-significant level, suggesting that preterm birth or low birth weight rather than maternal age itself mainly attributed to the development of cerebral palsy.
The last distinctive observation of our study was that epileptic and febrile seizures were more prominent in the younger group in terms of long-term outcomes. This observation matches with established research, which identifies preterm birth and low household income, not parental age, as major risk factors for epileptic and febrile seizures [34]. In essence, our results suggested that environmental factors of the mother also play a role in long-term developmental outcomes, along with maternal age.
Our study also had some limitations that need to be mentioned. First, there was a lack of information on paternal age. In many developed countries, both paternal and maternal age is increasing [8,25,35]. Multiple studies have indicated advanced paternal age as a risk factor for preterm birth, cleft palate, stillbirths, and neurodevelopmental disorders, such as autism [8,25]. Conversely, young paternal age has been suggested as a risk factor for abdominal wall defects in other studies [8,25]. Similarly, many investigators reported that the risk of cleft lip and palate increased with advancing paternal age, while the risk of abdominal wall defects increased with decreasing paternal age [36]. Therefore, paternal age could be an important confounding factor that was not considered in our study. Another limitation is that since we only included live-born neonates, demised or selectively aborted fetuses were not included when analyzing congenital abnormalities and malformations. Therefore, there is a chance that the absolute risk and number of the incidence might be underestimated in this study. Lastly, a particularly high prevalence of gestational diabetes milletus (GDM) in the study population can be pointed out. We assume that this is attributed to the inevitable obstetric practice, which requires to register code for unspecified GDM (e.g., O24.9) for proceeding with the 100-g oral glucose tolerance test under the national health insurance system in South Korea. While an abnormal 50-g glucose screen is widely acknowledged as a risk factor for adverse maternal and neonatal morbidity [37], the relatively high prevalence of GDM in our database is unlikely to significantly impact our regression analysis.
Collectively, our study results support that the importance of maternal age cannot be overemphasized. With the rising trend in first-time mothers giving birth at the age of 35 years or older (especially in South Korea), it is essential to understand the impact of maternal age on both short-term and long-term health of offsprings. For pregnancy outcomes, our data clearly demonstrated that preterm birth and placenta previa start to rise significantly in mothers older than 30 years old even after adjusting for multiple confounders, including multifetal pregnancies. Similar to our study, the study by Kim et al. [38] also reported an increased rate of fetal chromosomal abnormalities in advanced-aged women in South Korea. They particularly highlighted the characteristic increase in trisomy 18 and 21 [38]. Based on these findings, a combination of diagnostic tools should be considered for more accurate anticipation of potential outcomes, along with counseling. For example, while sonographic soft markers in the second trimester can provide clues about preterm birth and low birth weight, but less likely about an aneuploidy [39]. Additionally, tailored antenatal counseling should be considered for the individual needs of elderly gravidas. In conclusion, our study highlights the importance of regular follow-up and screening tests to detect possible long-term developmental issues in offspring born to elderly gravidas, followed by timely intervention.

Notes

Conflict of interest

The authors declare no competing interests.

Ethical approval

Not applicable.

Patient consent

Not applicable.

Funding information

This research was supported by a grant from the Patient-Centered Clinical Research Coordinating Center (PACEN) funded by the Ministry of Health & Welfare, Republic of Korea (grant number: HC21C0123) and from Samsung Medical Center Grant (#SMO1230361).

References

1. Gantt A, Metz TD, Kuller JA, Louis JM, Cahill AG, Turrentine MA. Obstetric care consensus #11, pregnancy at age 35 years or older. Am J Obstet Gynecol. 2023; 228:B25–40.
crossref
2. Statistics Korea. Birth statistics in 2021 [Internet]. Daejeon: Statistics Korea;c2022. [cited 2023 Dec 15]. Available from: https://kostat.go.kr/board.es?mid=a20108100000&bid=11773&act=view&list_no=420358.
3. Lee KS, Han DH, Bae CW. Changes in statistical birth data related to maternity and newborn over the past 15 years in Korea. Korean J Perinatol. 2011; 3:229–36.
4. Kahveci B, Melekoglu R, Evruke IC, Cetin C. The effect of advanced maternal age on perinatal outcomes in nulliparous singleton pregnancies. BMC Pregnancy Childbirth. 2018; 18:343.
crossref
5. Kim J, Nam JY, Park EC. Advanced maternal age and severe maternal morbidity in South Korea: a population-based cohort study. Sci Rep. 2022; 12:21358.
crossref
6. Statistics Korea. 2022 movements of population [Internet]. Daejeon: Statistics Korea;c2023. [cited 2023 Dec 15]. Available from: https://kosis.kr/upsHtml/online.do?isOnline=Y&PART=G&pubcode=CC&isNew=Y&dev=Y#gongDiv_CC.
7. Koo YJ, Ryu HM, Yang JH, Lim JH, Lee JE, Kim MY, et al. Pregnancy outcomes according to increasing maternal age. Taiwan J Obstet Gynecol. 2012; 51:60–5.
crossref
8. Machado-Gédéon A, Badeghiesh A, Baghlaf H, Dahan MH. Adverse pregnancy, delivery and neonatal outcomes across different advanced maternal ages: a population-based retrospective cohort study. Eur J Obstet Gynecol Reprod Biol X. 2023; 17:100180.
crossref
9. Kim D, Yang PS, You SC, Sung JH, Jang E, Yu HT, et al. Treatment timing and the effects of rhythm control strategy in patients with atrial fibrillation: nationwide cohort study. BMJ. 2021; 373:n991.
10. Chun CB, Kim SY, Lee JY, Lee SY. Republic of Korea: health system review. Health Systems in Transition. 2009; 11:7.
11. EUROCAT. EUROCAT guide 1.4: instruction for the registration of congenital anomalies [Internet]. Coleraine: University of Ulster; c2013 [cited 2024 Apr 30]. Available from: https://eu-rd-platform.jrc.ec.europa.eu/sites/default/files/Full_Guide_1_4_version_28_DEC2018.pdf.
12. Noh Y, Lee H, Choi A, Kwon JS, Choe SA, Chae J, et al. First-trimester exposure to benzodiazepines and risk of congenital malformations in offspring: a population-based cohort study in South Korea. PLoS Med. 2022; 19:e1003945.
crossref
13. Lee J, Lee JS, Park SH, Shin SA, Kim K. Cohort profile: The National Health Insurance Service-National Sample Cohort (NHIS-NSC), South Korea. Int J Epidemiol. 2017; 46:e15.
crossref
14. Shin DW, Cho B, Guallar E. Korean National Health Insurance database. JAMA Intern Med. 2016; 176:138.
crossref
15. Kimm H, Yun JE, Lee SH, Jang Y, Jee SH. Validity of the diagnosis of acute myocardial infarction in korean national medical health insurance claims data: the korean heart study (1). Korean Circ J. 2012; 42:10–5.
16. Charlson ME, Pompei P, Ales KL, MacKenzie CR. A new method of classifying prognostic comorbidity in longitudinal studies: development and validation. J Chronic Dis. 1987; 40:373–83.
crossref
17. Kim KH. Comparative study on three algorithms of the ICD-10 Charlson comorbidity index with myocardial infarction patients. J Prev Med Public Health. 2010; 43:42–9.
crossref
18. Lee SY. The 2018 national survey on fertility and family health and welfare [Internet]. Sejong: Korea Institute for Health and Social Affairs;c2019. [cited 2023 Dec 15]. Available from: https://www.kihasa.re.kr/en/publish/paper/research/view?seq=30703.
19. Svensson E, Ehrenstein V, Nørgaard M, Bakketeig LS, Rothman KJ, Sørensen HT, et al. Estimating the proportion of all observed birth defects occurring in pregnancies terminated by a second-trimester abortion. Epidemiology. 2014; 25:866–71.
crossref
20. Khalife D, Nassar A, Khalil A, Awwad J, Abu Musa A, Hannoun A, et al. Cumulative live-birth rates by maternal age after one or multiple in vitro fertilization cycles: an institutional experience. Int J Fertil Steril. 2020; 14:34–40.
21. Belcher RH, Patel SA, Kynes M, Carlucci JG, Hodson E, Zhao S, et al. Demographics and trends of cleft lip and palate patients born in Tennessee from 2000 to 2017. Int J Pediatr Otorhinolaryngol. 2022; 163:111312.
crossref
22. Martelli DR, Cruz KW, Barros LM, Silveira MF, Swerts MS, Martelli Júnior H. Maternal and paternal age, birth order and interpregnancy interval evaluation for cleft lip-palate. Braz J Otorhinolaryngol. 2010; 76:107–12.
23. Wu Y, Li M, Zhang J, Wang S. Unveiling uterine aging: much more to learn. Ageing Res Rev. 2023; 86:101879.
crossref
24. Wooldridge AL, Pasha M, Chitrakar P, Kirschenman R, Quon A, Spaans F, et al. Advanced maternal age impairs uterine artery adaptations to pregnancy in rats.  Int J Mol Sci. 2022; 23:9191.
crossref
25. Office for National Statistics. Birth characteristics in England and Wales: 2021 [Internet]. London: Office for National Statistics;c2023. [cited 2024 Apr 31]. Available from: https://www.ons.gov.uk/peoplepopulationandcommunity/birthsdeathsandmarriages/livebirths/bulletins/birthcharacteristicsinenglandandwales/2021.
26. Bai J, Wong FW, Bauman A, Mohsin M. Parity and pregnancy outcomes. Am J Obstet Gynecol. 2002; 186:274–8.
crossref
27. Yimer NB, Gedefaw A, Tenaw Z, Liben ML, Meikena HK, Amano A, et al. Adverse obstetric outcomes in public hospitals of southern Ethiopia: the role of parity. J Matern Fetal Neonatal Med. 2022; 35:1915–22.
crossref
28. McCarthy FP, Moss-Morris R, Khashan AS, North RA, Baker PN, Dekker G, et al. Previous pregnancy loss has an adverse impact on distress and behaviour in subsequent pregnancy. BJOG. 2015; 122:1757–64.
crossref
29. van Oppenraaij RH, Jauniaux E, Christiansen OB, Horcajadas JA, Farquharson RG, Exalto N. Predicting adverse obstetric outcome after early pregnancy events and complications: a review. Hum Reprod Update. 2009; 15:409–21.
crossref
30. Couto ER, Couto E, Vian B, Gregório Z,   Nomura ML, Zaccaria R, et al. Quality of life, depression and anxiety among pregnant women with previous adverse pregnancy outcomes. Sao Paulo Med J. 2009; 127:185–9.
31. Chang Z, Lichtenstein P, D’Onofrio BM, Almqvist C, Kuja-Halkola R, Sjölander A,  et al. Maternal age at childbirth and risk for ADHD in offspring: a population-based cohort study. Int J Epidemiol. 2014; 43:1815–24.
crossref
32. Croen LA, Najjar DV, Fireman B, Grether JK. Maternal and paternal age and risk of autism spectrum disorders. Arch Pediatr Adolesc Med. 2007; 161:334–40.
crossref
33. Sandin S, Hultman CM, Kolevzon A, Gross R, Mac-Cabe JH, Reichenberg A. Advancing maternal age is associated with increasing risk for autism: a review and meta-analysis. J Am Acad Child Adolesc Psychiatry. 2012; 51:477–86.e1.
crossref
34. Choi YJ, Jung JY, Kim JH, Kwon H, Park JW, Kwak YH, et al. Febrile seizures: are they truly benign? Longitudinal analysis of risk factors and future risk of afebrile epileptic seizure based on the national sample cohort in South Korea, 2002-2013. Seizure. 2019; 64:77–83.
crossref
35. Green RF, Devine O, Crider KS, Olney RS, Archer N, Olshan AF, et al. Association of paternal age and risk for major congenital anomalies from the National Birth Defects Prevention Study, 1997 to 2004. Ann Epidemiol. 2010; 20:241–9.
36. Mac Bird T, Robbins JM, Druschel C, Cleves MA, Yang S, Hobbs CA. Demographic and environmental risk factors for gastroschisis and omphalocele in the National Birth Defects Prevention Study. J Pediatr Surg. 2009; 44:1546–51.
crossref
37. Roeckner JT, Bennett S, Mitta M, Sanchez-Ramos L, Kaunitz AM. Pregnancy outcomes associated with an abnormal 50-g glucose screen during pregnancy: a systematic review and Meta-analysis. J Matern Fetal Neonatal Med. 2021; 34:4132–40.
crossref
38. Kim YJ, Lee JE, Kim SH, Shim SS, Cha DH. Maternal age-specific rates of fetal chromosomal abnormalities in Korean pregnant women of advanced maternal age. Obstet Gynecol Sci. 2013; 56:160–6.
crossref
39. Ko HS, Kwak DW, Oh SY, Choi SK, Hong JS, Hwang HS, et al. Clinical significance of soft markers in second trimester ultrasonography for pregnant Korean women: a multicenter study and literature review. Obstet Gynecol Sci. 2022; 65:145–55.
crossref

Fig. 1.
Changes in the proportions of the maternal age groups over the study period (2005-2019).
ogs-24005f1.tif
Fig. 2.
Restricted cubic spline curve for long-term outcomes of infants based on the maternal age with histogram. ADHD, attentiondeficit/ hyperactivity syndrome.
ogs-24005f2.tif
Table 1.
Characteristics of study population
Maternal age
P-value
<25 years (n=153,818) 25-29 years (n=845,355) 30-34 years (n=1,738,299) 35-39 years (n=787,530) 40-44 years (n=151,519) >44 years (n=9,296)
Maternal
 Age (yr) 22.57±1.42 27.66±1.3 31.94±1.37 36.48±1.34 41.2±1.24 45.79±1.25 <0.001
 Income level <0.001
  Q1 (lowest) 5,613 (3.6) 3,898 (0.5) 4,292 (0.2) 4,329 (0.5) 2,239 (1.5) 255 (2.7)
  Q2 51,978 (33.8) 245,008 (29.0) 335,866 (19.3) 141,058 (17.9) 30,478 (20.1) 2,019 (21.7)
  Q3 67,697 (44.0) 429,775 (50.8) 923,021 (53.1) 360,886 (45.8) 61,748 (40.8) 3,669 (39.5)
  Q4 (highest) 25,842 (16.8) 142,025 (16.8) 431,084 (24.8) 264,344 (33.6) 54,070 (35.7) 3,171 (34.1)
  Unknown 2,688 (1.7) 24,649 (2.9) 44,036 (2.5) 16,913 (2.1) 2,984 (2.0) 182 (2.0)
 Rural areas 101,403 (65.9) 497,222 (58.8) 904,814 (52.1) 399,450 (50.7) 80,475 (53.1) 5,210 (56.0) <0.001
 Charlson’s index 0.37±0.68 0.42±0.72 0.45±0.76 0.53±0.86 0.61±0.95 0.71±1.05 <0.001
  History of congestive heart failure 207 (0.1) 1,079 (0.1) 2,458 (0.1) 1,701 (0.2) 557 (0.4) 55 (0.6) <0.001
  History of diabetes mellitus 1,940 (1.3) 13,243 (1.6) 40,143 (2.3) 30,915 (3.9) 9,307 (6.1) 786 (8.5) <0.001
  History of renal disease 118 (0.1) 779 (0.1) 2,264 (0.1) 1,335 (0.2) 373 (0.2) 19 (0.2) <0.001
  History of cancer 533 (0.3) 5,125 (0.6) 17,406 (1.0) 12,454 (1.6) 3,016 (2.0) 228 (2.5) <0.001
  History of hypertension 576 (0.4) 4,710 (0.6) 13,721 (0.8) 11,799 (1.5) 4,561 (3.0) 503 (5.4) <0.001
 Hypertensive disorder during pregnancy 3,784 (2.5) 22,806 (2.7) 54,090 (3.1) 35,100 (4.5) 10,106 (6.7) 952 (10.2) <0.001
 Diabetes
  Gestational diabetes 19,253 (12.5) 122,310 (14.5) 416,452 (24.0) 250,227 (31.8) 56,074 (37.0) 3,702 (39.8) <0.001
  Overt diabetes 437 (0.3) 4,092 (0.5) 15,254 (0.9) 14,077 (1.8) 4,701 (3.1) 408 (4.4) <0.001
 Cesarean delivery 45,437 (29.5) 292,977 (34.7) 704,186 (40.5) 413,452 (52.5) 99,005 (65.3) 6,878 (74.0) <0.001
Neonatal
 Sex, male 78,777 (51.2) 434,531 (51.4) 893,691 (51.4) 406,663 (51.6) 78,041 (51.5) 4,839 (52.1) 0.003
 Multi-fetal pregnancy 2,123 (1.4) 16,910 (2.0) 61,634 (3.6) 46,953 (6.0) 7,743 (5.1) 324 (3.5) <0.001
 Preterm birth 4,938 (3.2) 23,900 (2.8) 63,617 (3.7) 43,611 (5.5) 10,537 (7.0) 774 (8.3) <0.001
 Birth weight (kg) (n=3,275,142) 3.15 (0.46) 3.19 (0.46) 3.18 (0.48) 3.14 (0.52) 3.12 (0.54) 3.09 (0.54) <0.001

Values are presented as mean±standard deviation or number (%).

Table 2.
Congenital malformations by maternal age
Short-term outcome Maternal age
<25 years 25-29 years 30-34 years 35-39 years 40-44 years >44 years
Chromosomal abnormality
 Autosomal trisomy 1.90 (1.39-2.60) Reference 1.33 (1.10-1.60) 2.57 (2.12-3.11) 8.67 (7.03-10.69) 40.98 (30.45-55.14)
 Others 0.86 (0.61-1.22) Reference 1.08 (0.92-1.26) 1.30 (1.09-1.54) 1.72 (1.35-2.19) 3.91 (2.31-6.63)
Major congenital malformations 0.93 (0.90-0.96) Reference 1.05 (1.03-1.07) 1.09 (1.07-1.11) 1.16 (1.13-1.20) 1.38 (1.26-1.50)
 Nervous system 0.82 (0.71-0.94) Reference 1.14 (1.07-1.22) 1.13 (1.05-1.22) 1.09 (0.98-1.23) 0.94 (0.62-1.42)
 Eye 0.91 (0.71-1.16) Reference 1.04 (0.93-1.17) 1.04 (0.91-1.18) 1.05 (0.84-1.30) 0.49 (0.16-1.52)
 Ear, face, and neck 0.63 (0.43-0.91) Reference 0.91 (0.79-1.06) 1.00 (0.84-1.19) 1.05 (0.79-1.41) 1.41 (0.58-3.43)
 Heart defects 0.93 (0.90-0.97) Reference 1.04 (1.02-1.06) 1.09 (1.06-1.11) 1.22 (1.18-1.26) 1.46 (1.31-1.62)
 Respiratory system 0.72 (0.53-0.98) Reference 1.03 (0.91-1.17) 1.09 (0.95-1.27) 0.77 (0.58-1.02) 2.16 (1.15-4.06)
 Oral clefts 1.24 (1.05-1.46) Reference 1.05 (0.96-1.14) 1.30 (1.19-1.43) 1.62 (1.41-1.87) 2.66 (1.81-3.91)
 Digestive system 1.06 (0.95-1.18) Reference 1.02 (0.97-1.08) 1.10 (1.04-1.17) 1.12 (1.01-1.23) 1.15 (0.81-1.64)
 Abdominal wall defects 1.59 (1.22-2.07) Reference 1.06 (0.92-1.24) 1.21 (1.02-1.43) 1.37 (1.06-1.77) 1.06 (0.39-2.84)
 Urinary system 0.88 (0.80-0.96) Reference 1.12 (1.07-1.17) 1.08 (1.03-1.14) 1.09 (1.00-1.18) 1.23 (0.94-1.60)
 Genital organs 0.71 (0.57-0.89) Reference 1.06 (0.97-1.16) 1.17 (1.05-1.29) 1.13 (0.96-1.34) 1.06 (0.60-1.88)
 Limb 0.97 (0.85-1.12) Reference 0.94 (0.88-1.01) 0.96 (0.89-1.04) 0.84 (0.73-0.98) 0.76 (0.44-1.32)
 Other malformations 0.99 (0.83-1.18) Reference 1.18 (1.09-1.29) 1.12 (1.02-1.23) 1.12 (0.96-1.30) 1.44 (0.91-2.27)

Values are presented as adjusted OR (95% CI).

Model adjusted for Charlson’s index, chronic hypertension, hypertensive disorders during pregnancy, gestational diabetes, overt diabetes, cesarean delivery, income, neonatal sex, birth year, and multifetal pregnancies.

OR, odds ratio; CI, confidence interval.

Table 3.
Short-term neonatal outcomes by maternal age
Short-term neonatal outcome Maternal age
<25 years 25-29 years 30-34 years 35-39 years 40-44 years >44 years
Preterm birth 1.23 (1.19-1.27) Reference 1.07 (1.05-1.09) 1.26 (1.24-1.28) 1.55 (1.51-1.59) 1.85 (1.71-2.01)
Outcomes during a year
 Neonate intensive care units 1.16 (1.13-1.20) Reference 1.09 (1.08-1.11) 1.25 (1.23-1.27) 1.45 (1.41-1.48) 1.72 (1.60-1.85)
 Composite outcome 1.00 (0.98-1.03) Reference 1.07 (1.06-1.09) 1.15 (1.13-1.16) 1.17 (1.14-1.20) 1.19 (1.09-1.30)
  Sepsis 1.03 (1.00-1.06) Reference 1.01 (1.00-1.03) 0.97 (0.95-0.99) 0.88 (0.85-0.91) 0.86 (0.76-0.98)
  Transient tachypnea 0.92 (0.86-0.99) Reference 1.28 (1.24-1.32) 1.54 (1.49-1.59) 1.67 (1.59-1.76) 1.48 (1.25-1.76)
  Respiratory distress syndrome 1.02 (0.95-1.09) Reference 1.17 (1.14-1.21) 1.38 (1.34-1.43) 1.55 (1.48-1.62) 1.79 (1.56-2.05)
  Necrotizing enterocolitis 1.13 (0.80-1.61) Reference 1.01 (0.85-1.20) 1.35 (1.12-1.63) 1.43 (1.06-1.91) 0.69 (0.17-2.80)
  Intraventricular hemorrhage 1.01 (0.74-1.38) Reference 0.96 (0.83-1.12) 1.03 (0.87-1.21) 1.33 (1.06-1.68) 1.30 (0.61-2.76)
  Bronchopulmonary dysplasia 0.95 (0.79-1.15) Reference 1.40 (1.29-1.52) 1.76 (1.61-1.92) 2.06 (1.83-2.32) 1.54 (1.03-2.30)

Values are presented as adjusted OR (95% CI).

Model adjusted for Charlson’s index, chronic hypertension, hypertensive disorders during pregnancy, gestational diabetes, overt diabetes, cesarean delivery, income, neonatal sex, birth year, and multifetal pregnancies.

OR, odds ratio; CI, confidence interval.

Table 4.
Long-term infant outcomes by maternal age
Long-term infant outcome Maternal age
<25 years 25-29 years 30-34 years 35-39 years 40-44 years >44 years
All-cause death 2.04 (1.87-2.22) Reference 0.93 (0.89-0.98) 1.09 (1.03-1.16) 1.34 (1.22-1.48) 2.08 (1.58-2.73)
Development problem
 Autism 1.18 (1.11-1.25) Reference 1.06 (1.03-1.10) 1.20 (1.16-1.24) 1.29 (1.22-1.37) 1.50 (1.24-1.82)
 ADHD 1.37 (1.33-1.41) Reference 0.90 (0.89-0.91) 0.94 (0.92-0.95) 1.04 (1.01-1.08) 1.25 (1.13-1.39)
 Cerebral palsy 1.19 (1.09-1.30) Reference 1.05 (1.00-1.09) 1.15 (1.09-1.21) 1.29 (1.18-1.40) 1.54 (1.17-2.03)
 Developmental delay 1.11 (1.08-1.14) Reference 0.94 (0.93-0.95) 0.95 (0.93-0.96) 0.98 (0.95-1.00) 1.12 (1.03-1.23)
  Motor developmental delay 0.77 (0.74-0.80) Reference 1.01 (0.99-1.03) 0.93 (0.92-0.95) 0.86 (0.83-0.90) 0.90 (0.79-1.04)
  Cognitive developmental delay 1.43 (1.39-1.47) Reference 0.88 (0.87-0.90) 0.96 (0.94-0.98) 1.09 (1.05-1.13) 1.39 (1.24-1.54)
 Epileptic and febrile seizures 1.14 (1.13-1.16) Reference 0.87 (0.86-0.88) 0.80 (0.79-0.81) 0.82 (0.81-0.84) 0.84 (0.78-0.89)
 Tics and stereotypic behavior 0.90 (0.86-0.94) Reference 1.03 (1.01-1.05) 0.96 (0.94-0.98) 0.92 (0.88-0.97) 0.98 (0.82-1.16)

Values are presented as adjusted HR (95% CI).

Model adjusted for Charlson’s index, chronic hypertension, hypertensive disorders during pregnancy, gestational diabetes, overt diabetes, cesarean delivery, income, neonatal sex, birth year, and multifetal pregnancies.

HR, hazard ratio; CI, confidence interval; ADHD, attention-deficit/hyperactivity disorder.

TOOLS
Similar articles