Abstract
BACKGROUND/OBJECTIVES
There are concerns about the adverse health effects of behavioral changes linked to coronavirus disease 2019 (COVID-19). We conducted a survey to investigate changes in lifestyle habits, including exercise and eating, during the COVID-19 pandemic and their association with changes in weight.
SUBJECTS/METHODS
We conducted a survey of 5,000 people in Hakui City, Japan, to assess their lifestyles and diets during the COVID-19 pandemic. A total of 3,992 complete responses were received. We also obtained pre- and post-pandemic health check-up data for 704 of the respondents. These health data were combined with the results of the questionnaire survey to identify factors associated with weight changes. Data were analyzed for 704 individuals.
RESULTS
The mean body mass index was 22.5 ± 3.1 kg/m2 for respondents whose weight did not change and 25.1 ± 2.7 kg/m2 for respondents whose weight increased. The pre-pandemic mean values for abdominal circumference in females and for gamma-glutamyl transferase in males tended to be higher in those whose weight increased. Those with decreased weight tended to be older. Respondents who were already overweight were more likely to gain weight because of COVID-19-related changes in their lifestyle. In males, alcohol consumption was directly associated with weight, and in females, abdominal circumference was more important.
The first case of coronavirus disease 2019 (COVID-19) was reported in Japan in mid-January 2020 [1]. The World Health Organization declared COVID-19 a pandemic in March 2020 [2], and the Japanese government declared a state of emergency in April 2020 [3]. This led to major lifestyle changes, including the closure of public and recreational facilities, and people voluntarily staying at home, including working from home. By March 25, 2022, the cumulative number of positive COVID-19 cases in Japan was 6,273,753, with 27,593 deaths [4].
Lockdowns have taken place in many countries to prevent the spread of COVID-19 [5]. There were no legally binding restrictions on behavior in Japan, but the government tried to curb economic activity and limit human interaction [6]. Many Japanese people therefore reduced their activity [7], in line with the pattern worldwide [8]. There are concerns about the adverse health effects of these behavioral changes. A study from California reported a worldwide sharp decrease in daily steps taken during the COVID-19 pandemic [9]. A study in Japan found an increased risk of falls and obesity in younger children [10].
In Japan, the incidence of lifestyle-related diseases, including cancer, ischemic heart disease, cerebrovascular disease, and diabetes has been increasing for some time. To address this, a medical check-up called Tokutei Kenshin was implemented in April of 2007 [11] with the aim of reducing the visceral fat that causes metabolic syndrome. It is available to insurance subscribers aged 40 yrs and over who live in Japan. Japan has a universal health insurance system, with all citizens enrolled into a public insurance scheme depending on their employment type and/or age. Almost all residents aged ≥ 40 yrs therefore have access to these check-ups, which are managed by medical insurers, including municipalities for certain schemes.
A previous study conducted before the COVID-19 pandemic found that people reporting a weight gain of ≥ 3 kg per year were more likely to develop arteriosclerotic cardiovascular disease than those who did not report a weight gain [12]. The total physical activity time of elderly Japanese people decreased significantly during the COVID-19 pandemic [7]. Behavioral changes prompted by COVID-19 may therefore increase obesity and lead to lifestyle-related diseases. This study used a questionnaire survey conducted in Hakui City, Japan, to investigate changes in lifestyle habits during the pandemic. The questionnaire results and data from the health check-ups were combined to investigate factors associated with weight changes. We established a collaboration agreement with Hakui City; within the framework of that agreement, we obtained permission to use health check-up data. The availability of these data was the main reason we selected Hakui City as the study area.
Hakui City is located in the central part of the Japanese archipelago, on the west side of the Noto Peninsula in Ishikawa Prefecture. As of April 1, 2021, the population of Hakui City was 20,763, with 40.2% aged 65 yrs or more [13].
We designed a questionnaire based on a survey about health education previously conducted by the Japanese government [14]. We asked respondents about changes to their dietary habits and lifestyle during the pandemic, using a five-point scale with responses ranging from “increased” to “decreased.” “not applicable” was also an option for items that did not apply, such as, for example, respondents who did not drink alcohol. Limiting the response options for the weight change items to “increase” or “decrease” would have meant that respondents had to record weight changes of as little as 1 g. To address this issue, we used a standard weight change of ≥ 3 kg. Therefore, a response of “slightly increased” indicated a change of > 3 kg but close to 3 kg. A response of “increased” indicated a clear change of ≥ 3 kg.
The survey was sent by mail to 5,000 randomly selected people over 40 yrs old living in Hakui City, to arrive on November 1, 2021. There is no upper age limit set for respondents. The questionnaire was self-administered, and participants were asked to return it by mail by November 30, 2021, in an enclosed pre-addressed envelope. An explanation of the survey’s purpose was published on the city’s website in advance and included in the survey form.
The data from health check-ups included height, weight, waist circumference, and blood pressure; blood sugar and cholesterol levels as blood sample data; and information about lifestyle habits such as drinking and smoking. The Tokutei Kenshin data in this study are from before the pandemic because data from afterwards were not yet available. It was considered most appropriate to use Tokutei Kenshin data from 2019, the last year before any COVID-19-related restrictions. However, limiting the data to 2019 might have limited the number of potential participants. We therefore used the 2019 data as the base, and supplemented them with data from 2018 and 2017 for participants who did not receive a check-up in 2019.
Japan has several types of public insurance systems. Tokutei Kenshin data stored by the city include the National Health Insurance and the medical care system for older people. National Health Insurance is mainly for self-employed people who do not work for a company, retirees, or their families. The medical care system for older people is for citizens aged 75 and over [15]. In Japan, 26.8% of the population is enrolled in the National Health Insurance system, and 12.8% in the medical care system for older people [16].
The results of the questionnaire and data from Tokutei Kenshin were combined before analysis. Questionnaires were coded with a unique cryptographic key linked to the individual. This was used to combine individual-level data from questionnaires and check-ups. The encryption keys were set in City Hall, and the researchers could not identify any individuals. Data were only combined when participants checked the consent box for this on the questionnaire. This study authors obtained approval from the ethical review committee at the researchers’ institution (approval No. 2018-129 [053]). The study procedures were in accordance with the Helsinki Declaration of 1975, as revised in 2013.
Data were checked for normality using histograms and the Shapiro–Wilk test. For biometric data, population normality was assumed. The groups with combined data and questionnaire data only were compared to check for any significant differences. Welch’s t-test was used for age, and Pearson’s χ2 test for all other variables, with Yates’ continuity correction added for sex.
Other data analyses focused mainly on lifestyle changes due to COVID-19, particularly changes in body weight, and associated diet and exercise changes. Cross-tabulations were performed between the weight change responses from the questionnaire and the weight and blood data obtained from the medical examination data. Respondents were also divided into 2 groups based on whether they reported a weight increase (“increased” or “slightly increased”) or decrease (“decreased” or “slightly decreased”), and these two groups were cross-tabulated with lifestyle habits to explore any habits associated with weight changes using one-way analysis of variance and χ2 tests or, for non-normally distributed data, the Kruskal–Wallis rank sum test. Normal data were reported as means and standard deviations, and non-normal data as medians and upper and lower quartile.
In total, 3,992 questionnaires were collected, with a response rate of 79.8%. Among the respondents, 54.7% were female, and the median age was 70 yrs. The age range of respondents was 40 yrs old for the youngest and 101 yrs old for the oldest (Table 1). A total of 704 questionnaires could be combined with Tokutei Kenshin data. The median age of this combined group was 72 yrs, and 58.7% were female. Compared with questionnaire-only respondents, those with combined data were slightly older, and this difference was statistically significant (P < 0.01). There were also slightly more females in the combined group, although this was not statistically significant. This is probably because there are more older females than males in Japan [17]. There were no other significant differences between the 2 groups.
Data are presented as number (%).
COVID-19, coronavirus disease 2019.
1)Age (yrs): Median (interquartile range), 70 (60–77), Range, 41–101; Sex: n (%), 1,792 (44.9) for male, 2,185 (54.8) for female, 8 (0.2) for Others (People whose gender identity is neither male nor female).
2)Age (yrs): Median (interquartile range), 72 (68–75), Range, 42-95; Sex: n (%), 290 (41.2) for male, 413 (58.7) for female, 0 (0.0) for Others (People whose gender identity is neither male nor female).
3)The combined data show respondents for whom data from health check-ups were available.
4)Weight change as answered by respondents. “Slightly increased” indicates a change of > 3 kg but close to 3 kg. “Increased” indicates a clear change of ≥ 3 kg. The same applies to the “decrease” response categories.
5)Not applicable includes no weight data, a diet that could not be assessed by the question (i.e., lacking snacks, vegetables, protein or alcohol), or no physical activity.
The histograms suggested that the data were normally distributed. However, the Shapiro–Wilk test suggested that the age data were non-normal. These data are therefore reported as medians with IQR. Some of the other data were also non-normal, and the comparisons were therefore performed using both parametric and non-parametric tests as a check.
The most common response for all lifestyle items was “no change.” There were more changes in weight than in other items. Overall, 67.9% of the respondents reported that they had seen “no change” in their weight, and 8.2% reported that this question was “not applicable.” However, 14.9% reported an increase (“increased” or “slightly increased”) and 9.1% reported a decrease (“decreased” or “slightly decreased”). For the combined group, 72.8%, 7.2%, 12.8%, 7.2%, reported “no change,” “not applicable,” “increased,” and “decreased,” respectively. Overall, 42.4% of all respondents and 43.5% of the combined group answered “not applicable” for alcohol consumption, probably because they did not drink alcohol.
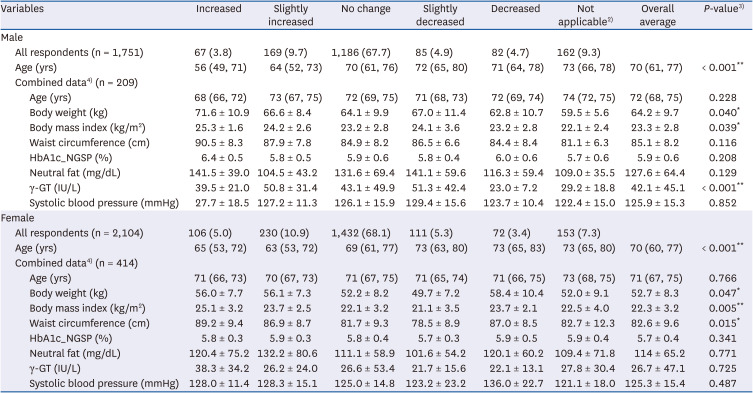
The average age and Tokutei Kenshin results based on whether the respondent reported weight gain or loss in the questionnaire are shown in Tables 2, 3, 4. The age data were obtained from the questionnaire, and weight and body mass index (BMI) from the Tokutei Kenshin results. This analysis was conducted separately for males and females.
Data for "all respondents" and "combined data" are presented as number (%). Age is presented as median (interquartile range), and other variables are presented as mean ± standard deviation.
γ-GT, gamma-glutamyl transferase; HbA1c, hemoglobin A1c; NGSP, National Glycohemoglobin Standardizations Program.
1)Weight change (≥ 3 kg) during the COVID-19 pandemic as reported by the respondent. “Slightly increased” indicates a change of > 3 kg but close to 3 kg. “Increased” indicates a clear change of ≥ 3 kg. The same applies to the “decreased” response categories.
2)Not applicable includes no weight data, a diet that could not be assessed by the question (i.e., lacking snacks, vegetables, protein, or alcohol), or no physical activity.
3)One-way ANOVA; questionnaire respondents for whom health check-up data were available. “Not applicable” was excluded from the analysis.
4)The combined data show respondents for whom data from health check-ups were available.
*Significant at the 5% level; **Significant at the 1% level.
Data for "all respondents" are presented as number (%) for categorical variables. Age is presented as median (interquartile range), and other variables are presented as mean ± standard deviation.
γ-GT, gamma-glutamyl transferase; HbA1c, hemoglobin A1c; NGSP, National Glycohaemoglobin Standardisation Program.
1)Weight change (≥ 3 kg) during the COVID-19 pandemic as reported by the respondent. “Slightly increased” indicates a change of > 3 kg but close to 3 kg. “Increased” indicates a clear change of ≥ 3 kg. The same applies to the “decreases” response categories.
2)Not applicable includes no weight data, a diet that could not be assessed by the question (i.e., lacking snacks, vegetables, protein, or alcohol), or no physical activity.
3)One-way ANOVA. “Not applicable” was excluded from the analysis.
4)The combined data show respondents for whom data from health check-ups were available.
*Significant at the 5% level; **Significant at the 1% level.
Data are presented as number (%).
COVID-19, coronavirus disease 2019.
1)Weight gain/loss as reported by the respondent. The classification of lifestyle habits as “increase” or “decrease” is based on respondents’ answers to the question.
2)Not applicable includes a diet that could not be assessed by the question (i.e., lacking snacks, vegetables, protein, or alcohol) or no physical activity.
3)χ2 test, †The sum of those responding “Increased” or “Slightly increased.” ‡The sum of those responding “Decreased” or “Slightly decreased.”
*Significant at the 5% level; **Significant at the 1% level.
The most noticeable difference was in BMI. The mean BMI of the “no change” respondents was 22.5 ± 3.1 kg/m2, which was similar to the overall average of 22.7 ± 3.1 kg/m2. However, among those reporting increased weight, the mean pre-pandemic BMI was statistically higher. The mean values for abdominal circumference and gamma-glutamyl transferase (γ-GT) also tended to be higher for those reporting a weight increase. Age was significantly different between those reporting weight increases and decreases. Additionally, males whose weight had increased tended to be heavier at their most recent check-up, and there was also a significant difference in the mean value of γ-GT by weight increase or decrease. However, none of the γ-GT values were high enough to be clinically problematic [18]. Males with lower pre-pandemic γ-GT values tended to lose weight. Females who had gained weight tended to have a larger pre-pandemic waist circumference than those who had lost weight. However, the mean waist circumference of those who said that their weight had “decreased” was 87.0 cm, larger than the overall mean of 82.6 cm.
The comparisons were repeated using the Kruskal–Wallis rank sum test, because some data were not normally distributed. The results (not shown for brevity) were very similar. Significant associations were found between BMI and waist circumference for all respondents, between BMI and γ-GT for males, and among body weight, BMI, and waist circumference for females.
Table 4 shows the cross-tabulation of lifestyle changes according weight changes. The lifestyle habits with a statistically significant difference at the 5% level were snacking, vegetable intake, protein intake, and drinking alcohol. The snack intake tended to have increased in those who gained weight. Those who lost weight tended to have increased their vegetable intake, and reduced their protein intake. Overall, 5.7% of those who gained weight and 14.3% of those who lost weight had decreased their protein intake. No statistically significant differences were found in physical activity levels.
Previous studies have shown that pandemic-related behavioral changes have increased obesity [19]. It has been suggested that the social isolation policies implemented during the COVID-19 pandemic may have contributed to obesity, which is associated with metabolic disorder [20]. Weight gain is linked to lifestyle-related diseases and should be prevented. A gain > 3 kg is a risk for developing arteriosclerotic cardiovascular disease [12]. This study therefore carried out an exploratory analysis focusing on weight changes using a questionnaire about habits during and after the pandemic, and data from pre-pandemic health check-ups. We found that those who were already prone to obesity were more likely to have gained weight during the pandemic. The increased snack intake among those gaining weight suggests that dietary habits may be more important than activity in this change. This is consistent with previous studies on the impact of exercise and nutrition on weight change [2122].
Males with increased alcohol consumption tended to report weight increases, and those with decreased alcohol consumption tended to report weight decreases. This suggests that changes in alcohol intake directly lead to weight gain and loss. Greater caution with alcohol intake may be needed in males because of their tendency to drink more than females [2324]. Females with a larger waist circumference tended to show a greater weight increase. However, this finding needs further examination because some respondents with a larger waist circumference lost weight.
Relatively younger age groups were more likely to gain weight. Similar results have been found in previous studies [19]. This may be because people tend to lose weight as they age [25]. Many older people experience difficulties in swallowing that can lead to weight loss [2627]. Age-related changes to taste and smell can also change appetite and eating habits [26]. Our study suggested that protein intake tended to decrease in those who lost weight. The isolation brought about by pandemic measures may have meant that these changes were detected later than earlier. In fact, previous studies have reported that elderly people’s tendency to rely on community services for support left them more vulnerable to isolation during the pandemic, leading to physical decline [2829]. In Japan, many nursing care facilities suspended their operations during the pandemic, negatively affecting the elderly population [30]. There is no evidence that dietary intake among elderly people declined during the COVID-19 pandemic. However, a negative correlation has been reported between loneliness levels and consumption of vegetables and fruits among elderly Japanese people [31]. We were unable to examine the relationship between weight changes and protein intake or other food intake by age group because of the small sample size in this study, but this could be explored in future research. Public health measures in Japan need to address the issue of weight loss among elderly people; a study of older adults in Japan found that males and females who met the criteria for sarcopenia were at increased risk of death and disability [32]. During the COVID-19 pandemic, the tendency to gain weight because of pandemic-related restrictions was expressed in Japan by the phrase “corona-butori.” Many people engaged in proactive measures to try to lose this extra weight. However, the present study findings suggest that, in elderly people, concern about losing weight is more likely needed than about gaining weight.
The COVID-19 pandemic led to unprecedented global social restrictions. Our study delivers crucial empirical data on weight changes during this period, underscoring the distinct impacts on younger and older males. This evidence is vital for informing future public health interventions and policy decisions, particularly in situations where social restrictions are imposed, such as during large-scale disasters. Our findings offer novel insights into managing the health effects of such crises across different population segments and underscore the necessity of tailored health recommendations.
This study had some limitations. First, the study sample was drawn from one segment of the population residing in Hakui City and does not represent a national dataset, which may affect the generalizability of the findings. Furthermore, the Tokutei Kenshin data were obtained from just 2 insurance systems, skewing towards older age groups, which may have affected the findings and limited the sample size of the combined data. Future studies might use health check-up data from other insurance systems, increase the sample size, conduct analyses by age group, and also compare check-up results from before and after the pandemic.
Second, although the weight measurements obtained during the health check-ups constitute objective and reliable data, the questionnaire responses themselves were subjective, and reflected respondents’ perceptions. Additionally, estimation of weight change is subjective and may lack accuracy. It is also unclear whether the respondents had actually weighed themselves. Furthermore, the questionnaire did not include any guidance on the use of the “not applicable” response, and thus some respondents may have used it to indicate “no change.”
Third, the statistical analysis was fairly simplistic, and we did not control for particular lifestyle factors or examine the effects of multiple changes. Therefore, this is best seen as an initial exploratory study. In future, we aim to conduct more sophisticated analyses, including controlling for various factors such as demographic information and pre-pandemic lifestyle.
Finally, in January 2024, a large-scale earthquake occurred in the Noto region, where Hakui City is located. Due to the severe damage, many residents continue to live as evacuees. Activities of evacuated residents are restricted. There is a particular concern about health damage to the elderly people. We hope that the results of this study will be useful.
In conclusion, the results of this study suggest that those who were already overweight before the pandemic were more likely to gain weight during the pandemic. The most important factor for weight change in males was alcohol consumption. Finally, weight loss may be a more important issue among older groups (those over 70 yrs of age) than weight gain.
References
1. Kuniya T. Evaluation of the effect of the state of emergency for the first wave of COVID-19 in Japan. Infect Dis Model. 2020; 5:580–587. PMID: 32844135.
2. World Health Organization (WHO). WHO Director-General’s opening remarks at the media briefing on COVID-19 - 11 March 2020 [Internet]. Geneva: World Health Organization;2023. cited 2024 March 23. Available from: https://www.who.int/director-general/speeches/detail/who-director-general-s-opening-remarks-at-the-media-briefing-on-covid-19---11-march-2020.
3. Prime Minister’s Office of Japan. Prime Minister of Japan and his cabinet declaration of a state of emergency in response to the novel coronavirus disease [Internet]. Tokyo: Prime Minister’s Office of Japan;2020. cited 2024 March 23. Available from: https://japan.kantei.go.jp/ongoingtopics/_00020.html.
4. Cabinet Secretariat. COVID-19 information and resources [Internet]. Tokyo: Cabinet Secretariat, Government of Japan;cited 2024 March 23. Available from: https://corona.go.jp/en/dashboard/.
5. Hale T, Angrist N, Goldszmidt R, Kira B, Petherick A, Phillips T, Webster S, Cameron-Blake E, Hallas L, Majumdar S, et al. A global panel database of pandemic policies (Oxford COVID-19 Government Response Tracker). Nat Hum Behav. 2021; 5:529–538. PMID: 33686204.
6. Karako K, Song P, Chen Y, Tang W, Kokudo N. Overview of the characteristics of and responses to the three waves of COVID-19 in Japan during 2020-2021. Biosci Trends. 2021; 15:1–8. PMID: 33518668.
7. Yamada M, Kimura Y, Ishiyama D, Otobe Y, Suzuki M, Koyama S, Kikuchi T, Kusumi H, Arai H. Effect of the COVID-19 epidemic on physical activity in community-dwelling older adults in Japan: a cross-sectional online survey. J Nutr Health Aging. 2020; 24:948–950. PMID: 33155619.
8. Amini H, Habibi S, Islamoglu AH, Isanejad E, Uz C, Daniyari H. COVID-19 pandemic-induced physical inactivity: the necessity of updating the Global Action Plan on Physical Activity 2018-2030. Environ Health Prev Med. 2021; 26:32. PMID: 33678154.
9. Tison GH, Avram R, Kuhar P, Abreau S, Marcus GM, Pletcher MJ, Olgin JE. Worldwide effect of COVID-19 on physical activity: a descriptive study. Ann Intern Med. 2020; 173:767–770. PMID: 32598162.
10. Ito T, Sugiura H, Ito Y, Noritake K, Ochi N. Effect of the COVID-19 emergency on physical function among school-aged children. Int J Environ Res Public Health. 2021; 18:9620. PMID: 34574545.
11. Gunma Association of Tourism Local Products & International Exchange Tokutei Kenshin. Progress and results of 10 years of nursing care prevention in Kusatsu Town, Gunma Prefecture [Internet]. Maebashi: Gunma Association of Tourism Local Products & International Exchange;2013. cited 2024 March 23. Available from: https://www.jstage.jst.go.jp/article/jph/60/9/60_12-090/_pdf.
12. Tada H, Kawashiri MA, Yasuda K, Yamagishi M. Associations between questionnaires on lifestyle and atherosclerotic cardiovascular disease in a Japanese general population: a cross-sectional study. PLoS One. 2018; 13:e0208135. PMID: 30485359.
13. Ministry of Agriculture, Forestry and Fisheries. Awareness survey on Shokuiku [Internet]. Tokyo: Ministry of Agriculture, Forestry and Fisheries;cited 2024 March 23. Available from: https://www.maff.go.jp/j/syokuiku/ishiki.html.
14. Hakui City official site [Internet]. Hakui: Hakui City;cited 2024 March 23. Available from: https://www.city.hakui.lg.jp/index.html.
15. Ministry of Health, Labour and Welfare of Japan. Medical care system for elderly in the latter stage of life [Internet]. Tokyo: Ministry of Health, Labour and Welfare of Japan;cited 2024 March 23. Available from: https://www.mhlw.go.jp/english/wp/wp-hw3/dl/2-003.pdf.
16. Ministry of Health, Labour and Welfare of Japan. Significance of Japan’s universal health insurance system [Internet]. Tokyo: Ministry of Health, Labour and Welfare of Japan;cited 2024 March 23. Available from: https://www.mhlw.go.jp/file/06-Seisakujouhou-12400000-Hokenkyoku/0000172084.pdf.
17. Statistics Bureau of Japan. Population estimates by age (5-year groups) and sex [Internet]. Tokyo: Statistics Bureau of Japan address;2023. cited 2024 March 23. Available from: https://www.stat.go.jp/english/data/jinsui/tsuki/index.html.
18. Ministry of Health, Labour and Welfare of Japan. Health checkup judgment value of health checkup items [Internet]. Tokyo: Ministry of Health, Labour and Welfare of Japan;cited 2024 March 23. Available from: https://www.mhlw.go.jp/content/12401000/000967510.pdf.
19. Alshahrani SM, Alghannam AF, Taha N, Alqahtani SS, Al-Mutairi A, Al-Saud N, Alghnam S. The impact of COVID-19 pandemic on weight and body mass index in Saudi Arabia: a longitudinal study. Front Public Health. 2022; 9:775022. PMID: 35111714.
20. Lippi G, Henry BM, Bovo C, Sanchis-Gomar F. Health risks and potential remedies during prolonged lockdowns for coronavirus disease 2019 (COVID-19). Diagnosis (Berl). 2020; 7:85–90. PMID: 32267243.
21. Cook CM, Schoeller DA. Physical activity and weight control: conflicting findings. Curr Opin Clin Nutr Metab Care. 2011; 14:419–424. PMID: 21832897.
22. Thomas DM, Bouchard C, Church T, Slentz C, Kraus WE, Redman LM, Martin CK, Silva AM, Vossen M, Westerterp K, et al. Why do individuals not lose more weight from an exercise intervention at a defined dose? An energy balance analysis. Obes Rev. 2012; 13:835–847. PMID: 22681398.
23. Ministry of Health, Labour and Welfare of Japan. 2019 National Health and Nutrition Survey Report [Internet]. Tokyo: Ministry of Health, Labour and Welfare of Japan;2020. cited 2023 September 10. Available from: https://www.mhlw.go.jp/content/000711005.pdf.
24. White AM. Gender differences in the epidemiology of alcohol use and related harms in the United States. Alcohol Res. 2020; 40:01.
25. Ministry of Health, Labour and Welfare of Japan. 2019 National Health and Nutrition Survey Report [Internet]. Tokyo: Ministry of Health, Labour and Welfare of Japan;2020. cited 2023 September 10. Available from: https://www.mhlw.go.jp/content/001066903.pdf.
26. Christmas C, Rogus-Pulia N. Swallowing disorders in the older population. J Am Geriatr Soc. 2019; 67:2643–2649. PMID: 31430395.
27. Hathaway B, Vaezi A, Egloff AM, Smith L, Wasserman-Wincko T, Johnson JT. Frailty measurements and dysphagia in the outpatient setting. Ann Otol Rhinol Laryngol. 2014; 123:629–635. PMID: 24707011.
28. Lebrasseur A, Fortin-Bédard N, Lettre J, Raymond E, Bussières EL, Lapierre N, Faieta J, Vincent C, Duchesne L, Ouellet MC, et al. Impact of the COVID-19 pandemic on older adults: rapid review. JMIR Aging. 2021; 4:e26474. PMID: 33720839.
29. Hwang TJ, Rabheru K, Peisah C, Reichman W, Ikeda M. Loneliness and social isolation during the COVID-19 pandemic. Int Psychogeriatr. 2020; 32:1217–1220. PMID: 32450943.
30. Sato K, Niimi Y, Iwatsubo T, Ishii S. Change in long-term care service usage in Japan following the COVID-19 pandemic: a survey using a nationwide statistical summary in 2018-2021. Geriatr Gerontol Int. 2022; 22:803–809. PMID: 36058628.
31. Yamaguchi Y, Yamada M, Hapsari ED, Matsuo H. The influence of social isolation on the preventive behaviors for non-communicable diseases in community-dwelling older adults in Japan. Int J Environ Res Public Health. 2020; 17:8985. PMID: 33276640.
32. Kitamura A, Seino S, Abe T, Nofuji Y, Yokoyama Y, Amano H, Nishi M, Taniguchi Y, Narita M, Fujiwara Y, et al. Sarcopenia: prevalence, associated factors, and the risk of mortality and disability in Japanese older adults. J Cachexia Sarcopenia Muscle. 2021; 12:30–38. PMID: 33241660.