Journal List > Nutr Res Pract > v.18(4) > 1516087822

Lee, Choi, Kim, Hwang, and Kim: Opuntia humifusa stems rich in quercetin and isorhamnetin alleviate insulin resistance in high-fat diet-fed rats

Abstract

BACKGROUND/OBJECTIVES

Obesity, characterized by abnormal fat accumulation and metabolic disturbances, presents a significant health challenge. Opuntia humifusa Raf., commonly known as Korean Cheonnyuncho, is rich in various beneficial compounds and has demonstrated antioxidant and anti-inflammatory effects. However, its potential impact on glucose and lipid metabolism, particularly in obese rats, remains unexplored. We aimed to investigate whether O. humifusa stems and fruits could beneficially alter glucose metabolism and lipid profiles in a rat model of high-fat diet (HFD)-induced obesity.

MATERIALS/METHODS

Thirty-two rats were allocated into 4 groups: normal diet (NF), HFD control (HF), HFD treated with 2% O. humifusa stems (HF-OS), and HFD treated with 2% O. humifusa fruits (HF-OF). Experimental diets were administered for 6 weeks. At the end of the treatment, liver and fat tissues were isolated, and serum was collected for biochemical analysis. The major flavonoid from O. humifusa stems and fruits was identified and quantified.

RESULTS

After 6 weeks of treatment, the serum fasting glucose concentration in the HF-OS group was significantly lower than that in the HF group. Serum fasting insulin concentrations in both HF-OS and HF-OF groups tended to be lower than those in the HF group, indicating a significant improvement in insulin sensitivity in the HF-OS group. Additionally, the HF-OS group exhibited a tendency towards the restoration of adiponectin levels to that of the NF group.

CONCLUSION

The 2% O. humifusa stems contain abundant quercetin and isorhamnetin, which alter fasting blood glucose levels in rats fed a HFD, leading to a favorable improvement in insulin resistance.

INTRODUCTION

Obesity has emerged as a burgeoning public health concern due to its escalating prevalence worldwide, particularly in developed countries, over the past decades. According to the 2022 report by the World Health Organization [1], the global prevalence of obesity has nearly tripled from 1975 to 2016. Notably, the American and European regions have exhibited the highest prevalence rates of obesity, with figures soaring from 6.8% in 1980 to 22.4% in 2019. In Europe, a staggering 60% of adults are either overweight or obese [1].
Defined as a chronic health condition, obesity entails abnormal or excessive accumulation and distribution of body fat, resulting from a disruption in the energy balance between energy input and output [23]. Overweight is classified as a body mass index (BMI) exceeding 25 kg/m2, while obesity is indicated by a BMI surpassing 30 kg/m2 [34]. Characterized by weight gain and metabolic disturbances, obesity significantly augments the risk of various comorbidities, including insulin resistance, metabolic syndrome, dyslipidemia, hypertension, type 2 diabetes mellitus, non-alcoholic fatty liver disease (NAFLD), cardiovascular disease, depression, cognitive impairment, and cancer [567891011121314]. Recognized as a leading cause of preventable mortality [15], obesity markedly impacts both the quality of life [1617] and healthcare costs [181920] of affected individuals.
Opuntia humifusa Raf., commonly known as the eastern prickly pear or Indian fig, is a cactus belonging to the genus Opuntia [21]. It is cultivated worldwide, particularly in the eastern United States, Mississippi, northeastern Mexico, Mediterranean regions, and the southern regions of the Republic of Korea [21]. O. humifusa Raf., also referred to as Korean Cheonnyuncho, is primarily grown in Korea and exhibits tolerance to low temperatures below −20°C during winter [22]. O. humifusa Raf. was high in dietary fiber (48.5%), total polyphenols, flavonoids, mannitol, polysaccharides, vitamins, and minerals [232425]. Compared to other cactus species, high levels of total flavonoids, phenolic compounds (ranging from 4 to 90 mg/mL), and vitamin C (approximately 260.94 mg per 100 g) are observed in the stems of O. humifusa Raf. along with the more potent antioxidant capacities against free radical diphenyl‐1‐picrylhydrazyl. Stems contain higher levels of major minerals than fruits, whereas levels of Fe, Se, vitamin C, and vitamin E are higher in fruits than in stems [2526].
Antioxidant and anti-inflammatory effects of O. humifusa Raf. have been reported in vitro [27282930]. Rats with streptozotocin-induced diabetes orally treated with powdered O. humifusa stems (150 mg/kg/d, 250 mg/kg/d, and 500 mg/kg/d) for 7 weeks showed significant reductions in fasting blood glucose, total cholesterol (TC), triglyceride (TG), and low-density lipoprotein cholesterol (LDL-C) compared to untreated diabetic rats [26]. However, no studies have demonstrated the effects of O. humifusa Raf. in glucose and lipid metabolism in insulin-resistant rats fed a high-fat diet (HFD). Given the evidence for its antioxidant and anti-inflammatory effects, we hypothesized that O. humifusa Raf. improved glucose and lipid metabolism. To assess this hypothesis, we aimed to investigate the effects of O. humifusa Raf. on blood glucose and lipid levels in HFD-fed obese rats.

MATERIALS AND METHODS

Preparation for O. humifusa Raf.

O. humifusa stems and fruits were collected in October 2022 from a field in Changnyeong County, South Gyeongsang Province, Korea. The stems and fruits were freeze-dried (Ilshin Co., Dongducheon, Korea) and refrigerated until use.

Extraction and UPLC-DAD-QToF/MS Analysis of stems and fruits of O. humifusa

Flavonoids were extracted from the stems and fruits of O. humifusa, as described by Lee et al. [31]. With reference to the method presented by Kim et al. [32], 0.5 g of the powdered sample was extracted with mixed solvents (methanol:water:formic acid = 50:45:5, v/v/v, 10 mL) using an orbital shaker (for 30 min at 200 rpm) and centrifuged for 15 min at 2016 × g and 4°C (LABOGENE 1580R; Bio-Medical Science Co., Seoul, Korea). The collected supernatant was filtered via a 0.2 µm PVDF syringe filter (Thermo Fisher Scientific Inc., Waltham, MA, USA). Each filtrate (0.5 mL) and Quercetin-3,5,7,3',4'-pentamethylester (internal standard [ISTD], 50 ppm, 0.5 mL) were further diluted with distilled water to obtain a final volume of 7 mL to offer improved recovery during solid phase extraction. First, a C18 cartridge (Hypersep C18 500 mg; Thermo Fisher Scientific Inc.) was conditioned with methanol (3 mL) and distilled water (5 mL) for the initial activation. The previously diluted filtrate and ISTD were sequentially loaded onto an activated cartridge and washed with 5 mL of distilled water. Finally, the target compounds were slowly eluted from the loaded cartridge using 1% formic acid in methanol (5 mL). The semi-purified flavonoid eluate was completely concentrated using N2 gas and redissolved in an extraction solvent (0.5 mL) prior to UPLC-DAD-QToF/MS analysis.

Identification and quantification of flavonoid derivatives

The qualitative analysis of flavonoid derivatives of O. humifusa stems and fruits was performed using a pre-established flavonoid database (‘RDA DB 1.0- Flavonoids’ completed in 2016, Korea, pp. 481-488). Among the identified flavonoid derivatives, quercetin 3-O-rutinoside, quercetin 3-O-galactoside, quercetin 3-O-glucoside, isorhamnetin 3-O-rutinoside, isorhamnetin 3-O-glucoside, quercetin, and isorhamnetin were purchased, and their contents were quantified based on the calibration curve. Isorhamnetin 3-O-galactoside-4'-O-glucoside, isorhamnetin 3,4'-di-O-glucoside, isorhamnetin 3-O-rutinoside-4'-O-glucoside, isorhamnetin 3-O-robinobioside, and isorhamnetin 3-O-galactoside contents were determined by comparing the area of the ISTD quercetin-3,5,7,3',4'-pentamethylester 50 ppm, 0.5 mL) with the area of each component in a 1:1 ratio. The contents of flavonoid derivatives were expressed as µg/g dry weight (DW).

Test animals

Five-week-old male Sprague-Dawley rats (n = 32) were purchased from Central Lab Animal Inc. (Seoul, Korea). The animals were housed individually and maintained under controlled conditions (room temperature, 22 ± 2°C; relative humidity, 55 ± 5%; dark cycle, 12 h/12 h).

Experimental diets

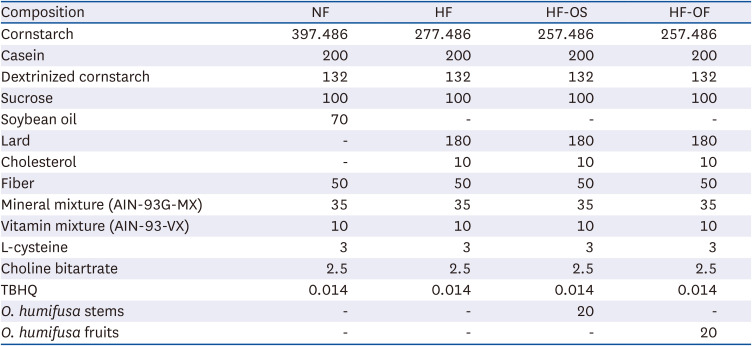
The composition of the experimental diet is shown in Table 1. Food and water were provided ad libitum throughout the experiments. To help them adapt to the breeding conditions, the rats were fed a chow diet with ad libitum access to water for one week. After a one-week adaptation period, the rats were divided into 4 groups for a 6-week study period: (1) a normal diet control (NF) group (n = 8); (2) a HFD control (HF) group (n = 8); (3) an HFD group (n = 8) treated with 2% O. humifusa stems (HF-OS) (n = 8); (4) an HFD group (n = 8) treated with 2% O. humifusa fruits (HF-OF) (n = 8). All experimental designs and procedures were approved by the Institutional Animal Care and Use Committee of Gyeongsang National University (GNU-221011-R0131-01).
Table 1

Composition of experimental diets (g/kg diet)

nrp-18-498-i001
Composition NF HF HF-OS HF-OF
Cornstarch 397.486 277.486 257.486 257.486
Casein 200 200 200 200
Dextrinized cornstarch 132 132 132 132
Sucrose 100 100 100 100
Soybean oil 70 - - -
Lard - 180 180 180
Cholesterol - 10 10 10
Fiber 50 50 50 50
Mineral mixture (AIN-93G-MX) 35 35 35 35
Vitamin mixture (AIN-93-VX) 10 10 10 10
L-cysteine 3 3 3 3
Choline bitartrate 2.5 2.5 2.5 2.5
TBHQ 0.014 0.014 0.014 0.014
O. humifusa stems - - 20 -
O. humifusa fruits - - - 20
NF, normal fat diet; HF, high-fat diet; HF-OS, high-fat diet with 2% O. humifusa stems; HF-OF, high-fat diet with 2% O. humifusa fruits; TBHQ, tert-butylhydroquinon.

Sampling procedures

At the end of the experimental period (6 weeks), the rats were fasted for 12 h, and anesthetized with CO2. Blood was drawn from the abdominal aorta vein. The serum was isolated by centrifuging the blood at 3,000 rpm for 20 min at 4°C. Small pieces of hepatic tissue excised from the dissected abdomen were immediately immersed in an RNA stabilization reagent (Qiagen, Valencia, CA, USA) for real-time quantitative reverse transcription polymerase chain reaction (RT-PCR). Harvested hepatic and adipose tissues were rinsed with cold phosphate-buffered saline and weighed. The residue was frozen immediately in liquid nitrogen and stored in a freezer at −70°C.

Biochemical analysis

Commercially available kits (Asan Pharmaceutical Co., Seoul, Korea) were used to determine the serum concentrations of high-density lipoprotein cholesterol (HDL-C), LDL-C, TC, TG, glucose, alkaline phosphatase (ALP), glutamic oxaloacetic transaminase (GOT), and glutamic pyruvic transaminase (GPT), according to the manufacturer’s instructions. The serum concentrations of insulin and adiponectin were measured using commercial assay kits (Crystal Chem, Chicago, IL, USA) according to the manufacturer’s instructions. The homeostasis assessment of insulin resistance (HOMA-IR) was performed using the following formula:
HOMA-IR = [Fasting Insulin (µU/mL) × Fasting Plasma Glucose (mg/dL)]/405

RNA isolation

The RNeasy Protect Mini Kit (Qiagen, Hilden, Germany) was used for total RNA isolation from hepatic tissues according to the manufacturer’s instructions. The quantity and purity of RNA were determined based on the absorbance at 260 and 280 nm. RNA samples were stored at −70°C until use.

Real-time RT-PCR

Real-time RT-PCR was conducted using the SYBR Green PCR Master Mix (Qiagen) and a CFX Opus 96 Real-time PCR System (Bio-Rad Laboratories, Hercules, CA, USA) according to the manufacturer’s introductions, in order to investigate the expression of glucose and lipid metabolism-related genes. The extracted RNA was used to synthesize cDNA according to the manufacturer’s instructions. A QuantiTect Reverse Transcription Kit (Qiagen) was used to synthesize cDNA from the extracted RNA.
The primer sequences for β-actin, acetyl-coenzyme A acetyltransferase 2 (ACAT2), 3-hydroxy-3-methylglutaryl-coenzyme A reductase (HMGR), sterol regulatory element binding protein 2 (SREBP-2), phosphoenolpyruvate carboxykinase (PEPCK), adiponectin receptor protein 2 (AdipoR2), peroxisome proliferator-activated receptor alpha (PPAR-α), and interleukin-1 beta (IL-1β) are as follows (forward and reverse, respectively): β-actin: 5′-AGCGTGGCTACAGCTTCACC-3′, 5′-TGCCACAGGATTCCATACCC-3′; ACAT2: 5′-CAGGACACCCAGCATCAGG-3′, 5′-AGGATGGACAGCAGCAGAGC-3′; HMGR: 5′-GGATGCAGCACAGAATGTGG-3′, 5′- ACGCCCCTTGAACACCTAGC-3′; SREBP-2: 5′-CGCAACCAGCTTTCAAGTCC-3′, 5′- AGCGACTGTCTGCACTGTGG-3′; PEPCK: 5′-GAAAGTTGAATGTGTGGGTGAT-3′, 5′- TTCTGGGTTGATGGCCCTTA-3′; AdipoR2: 5′-CATGTTTGCCACCCCTCAGTA-3′, 5′- ATGCAAGGTAGGGATGATTCCA-3′; PPAR-α: 5′-AAGGCTATGCCAGGCTTTGC-3′, 5′- GATGTCGCAGAATGGCTTCC-3, and IL-1β: 5′-CACCTTCTTTTCCTTCATCTTTG -3′, 5′- GTCGTTGCTTGTCTCTCCTTGTA -3′. The PCR cycling conditions for the 2-step RT-PCR were as follows: pre-denaturation at 95°C for 15 min, followed by 45 cycles of 94°C for 15 s, 58°C for 30 sec and 72°C for 30 s. Relative quantification values were calculated by analyzing the changes in SYBR green fluorescence during PCR, according to the manufacturer’s instructions. The Ct values obtained were the threshold cycles at which a statistically significant increase in the SYBR green emission intensity was noted. Using the 2−ΔΔCt method, the changes (in orders of magnitude) relative to the control were calculated. Ct values were normalized to those for the housekeeping gene, β-actin, and the ΔCt values of the HFD groups were normalized to the mean ΔCt values of the NF controls. Melting-curve analysis was performed at 72–95°C to confirm the specificity of the PCR assay.

Statistical analyses

Data are expressed as mean ± SD. Statistical comparisons were performed using one-way analysis of variance followed by Duncan’s multiple range test. Values were considered statistically significant at P < 0.05.

RESULTS

Identification of flavonoids from O. humifusa stems and fruits

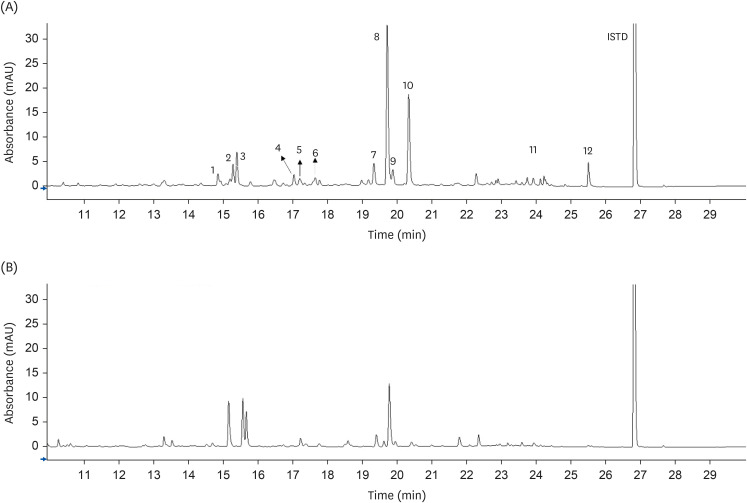
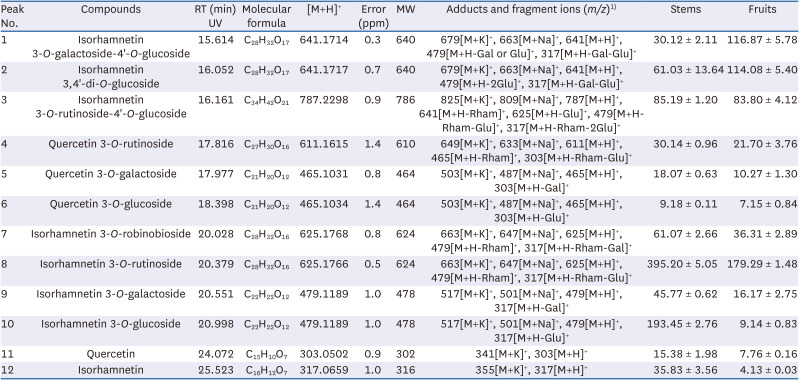
The major flavonoids from O. humifusa stems and fruits were identified (Fig. 1, Table 2). Twelve types of aglycones and their glycosides were detected in O. humifusa stems and fruits. Aglycones of quercetin and isorhamnetin were detected. Seven types of isorhamnetin glycosides and 3 types of quercetin glycosides were identified. The total flavonoid content in O. humifusa stems and fruits was 980.43 and 606.67 µg/g DW, respectively. The content of isorhamnetin derivatives was 907.66 µg/g DW (92.6%) in stems and 559.79 µg/g DW (92.3%) in fruits, while the corresponding content of quercetin derivatives for the cultivars was 72.77 µg/g DW (7.42%) and 46.88 µg/g DW (7.73%), respectively. Isorhamnetin-3-O-rutinoside was found at significantly high levels in the stems (395.20 ± 5.05 µg/g DW) and fruits (179.29 ± 1.48 µg/g DW). Isorhamnetin-3-O-glucoside was 21 times more abundant in stems (193.45 ± 2.76 µg/g DW) than in fruits (9.14 ± 0.83 µg/g DW).
Fig. 1

Ultra-high performance liquid chromatography coupled to a diode array detector (350 nm) chromatograms of flavonoids in O. humifusa stems (A) and fruits (B). 1: Isorhamnetin 3-O-galactoside-4'-O-glucoside; 2: Isorhamnetin 3,4'-di-O-glucoside; 3: Isorhamnetin 3-O-rutinoside-4'-O-glucoside; 4: Quercetin 3-O-rutinoside; 5: Quercetin 3-O-galactoside; 6: Quercetin 3-O-glucoside; 7: Isorhamnetin 3-O-robinobioside; 8: Isorhamnetin 3-O-rutinoside; 9: Isorhamnetin 3-O-galactoside; 10: Isorhamnetin 3-O-glucoside; 11: Quercetin; 12: Isorhamnetin.

ISTD, internal standard.
nrp-18-498-g001
Table 2

Mass spectrometric data and their contents (μg/g dry weight) of isolated 12 flavonoids from O. humifusa stems and fruits

nrp-18-498-i002
Peak No. Compounds RT (min) UV Molecular formula [M+H]+ Error (ppm) MW Adducts and fragment ions (m/z)1) Stems Fruits
1 Isorhamnetin 3-O-galactoside-4'-O-glucoside 15.614 C28H32O17 641.1714 0.3 640 679[M+K]+, 663[M+Na]+, 641[M+H]+, 479[M+H-Gal or Glu]+, 317[M+H-Gal-Glu]+ 30.12 ± 2.11 116.87 ± 5.78
2 Isorhamnetin 3,4'-di-O-glucoside 16.052 C28H32O17 641.1717 0.7 640 679[M+K]+, 663[M+Na]+, 641[M+H]+, 479[M+H-2Glu]+, 317[M+H-Gal-Glu]+ 61.03 ± 13.64 114.08 ± 5.40
3 Isorhamnetin 3-O-rutinoside-4'-O-glucoside 16.161 C34H42O21 787.2298 0.9 786 825[M+K]+, 809[M+Na]+, 787[M+H]+, 641[M+H-Rham]+, 625[M+H-Glu]+, 479[M+H-Rham-Glu]+, 317[M+H-Rham-2Glu]+ 85.19 ± 1.20 83.80 ± 4.12
4 Quercetin 3-O-rutinoside 17.816 C27H30O16 611.1615 1.4 610 649[M+K]+, 633[M+Na]+, 611[M+H]+, 465[M+H-Rham]+, 303[M+H-Rham-Glu]+ 30.14 ± 0.96 21.70 ± 3.76
5 Quercetin 3-O-galactoside 17.977 C21H20O12 465.1031 0.8 464 503[M+K]+, 487[M+Na]+, 465[M+H]+, 303[M+H-Gal]+ 18.07 ± 0.63 10.27 ± 1.30
6 Quercetin 3-O-glucoside 18.398 C21H20O12 465.1034 1.4 464 503[M+K]+, 487[M+Na]+, 465[M+H]+, 303[M+H-Glu]+ 9.18 ± 0.11 7.15 ± 0.84
7 Isorhamnetin 3-O-robinobioside 20.028 C28H32O16 625.1768 0.8 624 663[M+K]+, 647[M+Na]+, 625[M+H]+, 479[M+H-Rham]+, 317[M+H-Rham-Gal]+ 61.07 ± 2.66 36.31 ± 2.89
8 Isorhamnetin 3-O-rutinoside 20.379 C28H32O16 625.1766 0.5 624 663[M+K]+, 647[M+Na]+, 625[M+H]+, 479[M+H-Rham]+, 317[M+H-Rham-Glu]+ 395.20 ± 5.05 179.29 ± 1.48
9 Isorhamnetin 3-O-galactoside 20.551 C22H22O12 479.1189 1.0 478 517[M+K]+, 501[M+Na]+, 479[M+H]+, 317[M+H-Gal]+ 45.77 ± 0.62 16.17 ± 2.75
10 Isorhamnetin 3-O-glucoside 20.998 C22H22O12 479.1189 1.0 478 517[M+K]+, 501[M+Na]+, 479[M+H]+, 317[M+H-Glu]+ 193.45 ± 2.76 9.14 ± 0.83
11 Quercetin 24.072 C15H10O7 303.0502 0.9 302 341[M+K]+, 303[M+H]+ 15.38 ± 1.98 7.76 ± 0.16
12 Isorhamnetin 25.523 C16H12O7 317.0659 1.0 316 355[M+K]+, 317[M+H]+ 35.83 ± 3.56 4.13 ± 0.03
RT, retention time; UV, ultraviolet; MW, molecular weight.
1)All samples analyzed in positive ESI-ionization mode (m/z, [M+H]+) of ToF-MS; [M+Na]+ and [M+K]+ adduct ions presented.

Body weight, food intake, and organ weight

Table 3 presents the body weight, food intake, and food efficiency ratio. The experimental groups exhibited no significant differences in initial body weight, ranging between 190.4 g and 191.4 g. Following 6 weeks on the designated diets, rats in the HFD-fed groups exhibited significantly higher weights compared to the NF group. However, the HF-OS and HF-OF groups did not display significant loss in comparison to the HF group. Although intake varied significantly among the HFD groups compared to the NF group, the HF, HF-OS, and HF-OF groups demonstrated similar intakes.
Table 3

BW, weight gain, intake and FER of rats

nrp-18-498-i003
Variables NF HF HF-OS HF-OF
Initial BW (g) 190.38 ± 16.41a 190.5 ± 11.87a 191.38 ± 9.40a 191.13 ± 9.28a
Final BW (at 6 weeks; g) 427.60 ± 34.29a 460.64 ± 38.07a 455.38 ± 27.79a 457.21 ± 23.68a
Weight gain (for 6 weeks; g) 237.23 ± 21.71b 270.14 ± 28.26a 264.00 ± 23.05a 266.09 ± 18.03a
Intake (for 6 weeks; g/day) 22.56 ± 2.07b 27.02 ± 2.58a 25.22 ± 1.64a 26.01 ± 1.76a
FER1) (for 6 weeks) 0.32 ± 0.02a 0.30 ± 0.01b 0.32 ± 0.01a 0.31 ± 0.01ab
Data are expressed as mean ± SD of 8 rats per group.
BW, body weight; FER, food efficiency ratio; NF, normal fat diet; HF, high-fat diet; HF-OS, high-fat diet with 2% O. humifusa stems; HF-OF, high-fat diet with 2% O. humifusa fruits.
1)FER = Weight Gain (g/day)/Food Intake (g/day).
Values with different alphabet within the same row are significantly different at P < 0.05 by Duncan’s multiple range test.
Table 4 displays the liver and fat tissue weights of the rats. The HFD-fed groups exhibited significant increases in both liver and adipose weights when compared to the NF group. Supplementation with OS or OF did not lead to significant decreases in liver weight or fat tissue weight.
Table 4

The liver, kidney fat and abdominal fat tissue weight of rats

nrp-18-498-i004
Variables NF HF HF-OS HF-OF
Liver (g) 14.06 ± 1.75b 22.54 ± 2.01a 21.66 ± 2.34a 22.62 ± 1.89a
Retroperitoneal fat (g) 5.12 ± 0.59b 6.08 ± 1.16ab 6.68 ± 0.82a 6.46 ± 1.51a
Abdominal fat (g) 6.34 ± 2.56b 9.58 ± 2.26a 9.69 ± 1.44a 10.32 ± 2.50a
Data are expressed as mean ± SD of 8 rats per group.
NF, normal fat diet; HF, high-fat diet; HF-OS, high-fat diet with 2% O. humifusa stems; HF-OF, high-fat diet with 2% O. humifusa fruits.
Values with different alphabet within the same row are significantly different at P < 0.05 by Duncan’s multiple range test.

Serum lipid levels

Table 5 presents the serum levels of TG, TC, HDL-C, and LDL-C. TC and TG levels did not exhibit significant differences in the HFD group compared to the NF group. However, the HFD resulted in a significant reduction in HDL-C levels and an increase in LDL-C levels compared to the NF group. While supplementation with OS or OF did not impact HDL-C levels, there was a tendency for decreased LDL-C levels in the HF-OF groups.
Table 5

Serum TG, TC, HDL-C, LDL- C levels, and related ratios of experimental rats

nrp-18-498-i005
Variables NF HF HF-OS HF-OF
TG (mg/dL) 86.76 ± 26.99a 95.53 ± 38.35a 71.00 ± 36.33a 72.48 ± 14.02a
TC (mg/dL) 76.48 ± 8.61a 97.97 ± 23.17a 90.39 ± 23.62a 77.89 ± 19.59a
HDL-C (mg/dL) 38.95 ± 7.33a 29.19 ± 6.51b 27.79 ± 11.76b 26.48 ± 7.39b
LDL-C (mg/dL) 20.18 ± 10.74b 49.68 ± 25.15a 48.41 ± 9.49a 36.92 ± 19.56ab
Data are expressed as mean ± SD of 8 rats per group.
TG, triglyceride; TC, total cholesterol; HDL-C, high-density lipoprotein cholesterol; LDL-C, low-density lipoprotein cholesterol; NF, normal fat diet; HF, high-fat diet; HF-OS, high-fat diet with 2% O. humifusa stems; HF-OF, high-fat diet with 2% O. humifusa fruits.
Values with different alphabet within the same row are significantly different at P < 0.05 by Duncan’s multiple range test.

Fasting serum glucose, insulin, and adiponectin levels

Table 6 illustrates the effects of OS and OF on fasting serum glucose, insulin, and adiponectin levels. Fasting glucose levels tended to be higher in the HF group than in the NF group. However, the HF-OS group exhibited significantly lower fasting glucose levels compared to the HF group. Fasting insulin levels were significantly elevated in the HF group compared to the NF group. Both the HF-OS and HF-OF groups showed a tendency toward decreased fasting insulin levels relative to the HF group. Consequently, a significant improvement in the HOMA-IR score was observed in the HF-OS group. Adiponectin levels were notably lower in the HF group compared to the NF group. However, the HF-OS group exhibited a tendency to restore adiponectin levels to those observed in the NF group.
Table 6

Serum fasting glucose, insulin, HOMA-IR, and adiponectin levels of experimental rats

nrp-18-498-i006
Variables NF HF HF-OS HF-OF
Glucose (mg/dL) 186.32 ± 13.74ab 203.93 ± 37.04a 173.70 ± 19.48b 187.63 ± 21.01ab
Insulin (ng/mL) 7.86 ± 1.71b 12.30 ± 5.38a 8.66 ± 2.94ab 9.19 ± 3.35ab
HOMA-IR 1.35 ± 0.30b 2.30 ± 1.08a 1.41 ± 0.58b 1.60 ± 0.60ab
Adiponectin (μg/mL) 7.45 ± 1.42a 5.67 ± 0.86b 6.52 ± 1.33ab 5.94 ± 0.71b
Data are expressed as mean ± SD of 8 rats per group.
HOMA-IR, homeostatic model assessment for insulin resistance; NF, normal fat diet; HF, high-fat diet; HF-OS, high-fat diet with 2% O. humifusa stems; HF-OF, high-fat diet with 2% O. humifusa fruits.
Values with different alphabet within the same row are significantly different at P < 0.05 by Duncan’s multiple range test.

Serum ALP, GOT, GPT levels

The levels of serum ALP, GOT, and GPT are presented in Table 7. While serum GOT and GPT levels in the HF group exhibited a tendency to be higher than those in the NF group, these variances did not attain statistical significance. However, notably, the serum ALP levels were significantly elevated in the HF group compared to the NF group. Furthermore, both HF-OS and HF-OF groups demonstrated significantly lower serum ALP levels in comparison to the HF group.
Table 7

Serum ALP, GOT, and GPT levels of experimental rats

nrp-18-498-i007
Variables NF HF HF-OS HF-OF
ALP, IU/L 2.70 ± 0.32b 3.45 ± 0.35a 2.92 ± 0.62b 2.68 ± 0.26b
GOT, IU/L 88.61 ± 52.39a 109.36 ± 67.86a 94.13 ± 28.18a 110.67 ± 38.45a
GPT, IU/L 12.46 ± 3.98a 16.91 ± 10.68a 15.03 ± 3.08a 17.00 ± 8.14a
Data are expressed as mean ± SD of 8 rats per group.
ALP, alkaline phosphatase; GOT, glutamic oxaloacetic transaminase; GPT, glutamic pyruvic transaminase; NF, normal fat diet; HF, high-fat diet; HF-OS, high-fat diet with 2% O. humifusa stems; HF-OF, high-fat diet with 2% O. humifusa fruits.
Values with different alphabet within the same row are significantly different at P < 0.05 by Duncan’s multiple range test.

Real-time quantitative RT-PCR

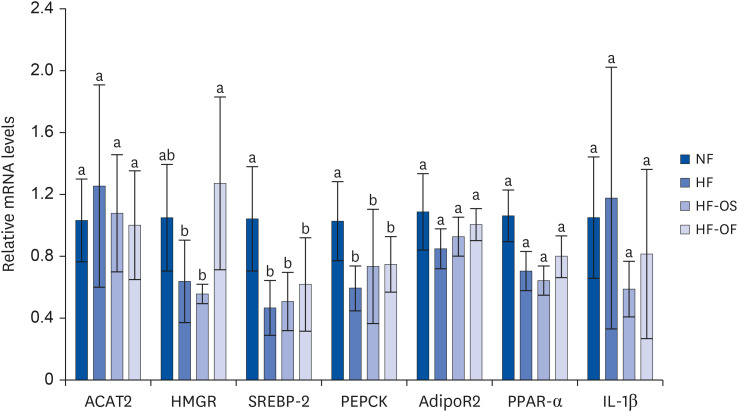
To elucidate the modulation of genes related to glucose and lipid metabolism as well as inflammation by O. humifusa stems, we conducted a comparative analysis of hepatic gene expression among the experimental groups using quantitative real-time RT-PCR. The quantitative RT-PCR experiments revealed that the expression of most genes in the HFD group remained unaltered, except for 2 genes, as depicted in Fig. 2. Specifically, genes encoding SREBP-2 and PEPCK were significantly downregulated in the HFD group compared to the NF group. Interestingly, the expression of the gene encoding HMGR was observed to increase in O. humifusa fruits when contrasted with the HF group.
Fig. 2

Quantitative reverse transcription polymerase chain reaction analysis of gene expression levels in hepatic tissues associated with glycogen metabolism. O. humifusa fruits treatment increased HMGR expression compared with a HF group. Data are expressed as mean ± SD of 5 rats per group.

NF, normal fat diet; HF, high-fat diet; HF-OS, high-fat diet with 2% O. humifusa stems; HF-OF, high-fat diet with 2% O. humifusa fruits; ACAT2, acetyl-coenzyme A acetyltransferase 2; AdipoR2, adiponectin receptor protein 2; HMGR, 3-hydroxy-3-methylglutaryl-coenzyme A reductase; IL-1β, interleukin-1 beta; PEPCK, phosphoenolpyruvate carboxykinase; PPAR-α, peroxisome proliferator-activated receptor alpha; SREBP-2, sterol regulatory element binding protein 2.
Values with different alphabet within the same row are significantly different at P < 0.05 by Duncan’s multiple range test.
nrp-18-498-g002

DISCUSSION

In this study, we aimed to investigate the effects of O. humifusa on glucose and lipid metabolism in rats with HFD-induced obesity. We induced insulin resistance in rats by feeding them an HFD based on studies that have shown an association between the consumption of an HFD and increased insulin resistance [333435]. Our data support the hypothesis that O. humifusa stems and fruits improve glucose and lipid metabolism in insulin-resistant rats. In this study, rats fed an HF-OS showed significantly reduced glucose levels compared to rats fed an HFD alone. Moreover, HOMA-IR improved significantly in the HF-OS group. Our findings indicate that 2% O. humifusa stems can enhance insulin sensitivity in obese rats fed with a HFD. O. humifusa fruits increased hepatic HMGR mRNA levels, and LDL-C tended to decrease with O. humifusa fruits supplementation in the HFD-fed groups.
Consistent with our findings, a previous study showed that the combination of O. humifusa intake and acute exercise improved insulin sensitivity via the increase in PPAR-γ, PGC-1α, and GLUT-4 protein expression in the skeletal muscles of rats fed an HFD [36]. The groups were divided as follows: (a) HFD + sedentary, (b) HFD + acute 120 min-swimming, (c) 5% O. humifusa + HFD + sedentary, and (d) 5% O. humifusa + HFD + acute 120 min-swimming. The sedentary group that consumed 5% O. humifusa plus an HFD showed decreased concentrations of serum fasting glucose and fasting insulin, as well as a decreased HOMA-IR compared to the sedentary group that consumed an HFD [36]. Hahm et al. [26] demonstrated the glucose- and lipid-lowering effects of O. humifusa stems on streptozotocin-induced diabetes in Sprague-Dawley rats.
Adiponectin is a protein hormone (an adipokine) secreted from the adipose tissue that plays a vital role in the regulation of glucose and lipid metabolism [373839]. In non-diabetic individuals, plasma adiponectin levels are positively associated with insulin sensitivity [40]. A meta-analysis indicated that the risk of type 2 diabetes is associated with lower adiponectin levels and increased pro-inflammatory cytokine levels [41]. Overexpression of adiponectin in the adipose tissue significantly decreased IL-6 levels in the circulation and reduced mRNA levels of TNF-α in the adipose tissue [42]. It is well established that adiponectin attenuates insulin resistance-related metabolic diseases by exerting anti-inflammatory effects [43]. In the present study, the adiponectin levels were significantly lower in the HF group than in the NF group. The adiponectin levels in the HF-OS group tended to be higher than those in the HF group. Although we did not measure inflammatory cytokine levels, these results suggest that O. humifusa stems may partially ameliorate insulin resistance via the anti-inflammatory properties of adiponectin in HFD-fed animals.
In the present study, we found no effect of O. humifusa on weight gain, hepatic tissue weight, or fat tissue weight. This is consistent with the findings of Jung et al. [44], which suggested that O. humifusa has a neutral effect on weight. In a previous study [44], rats were allocated to 4 groups as follows: NF, hypercholesterolemic diet (1% cholesterol [25% soybean oil]), 2% O. humifusa extract-supplemented hypercholesterolemic diet, and 4% O. humifusa extract-supplemented hypercholesterolemic diet. This study did not mention the parts (stems and/or fruits) of O. humifusa that were used. Body weight gain, food intake, and liver weight of hypercholesterolemic rats treated with O. humifusa extract did not differ from those of untreated hypercholesterolemic rats. Given these findings, O. humifusa extract did not appear to influence body weight or food intake.
An HFD increases serum ALP, GOT, and GPT, which are markers of hepatopathies such as NAFLD. These enzymes are then released into bloodstream from the liver [45]. Although we did not observe statistically significant differences in serum GOT and GPT levels, O. humifusa stems and fruits significantly suppressed the elevation of ALP levels induced by the HFD in the present study. This indicates the hepatoprotective effects of O. humifusa. Consistent with our findings, Park et al. [46] showed the hepatoprotective effects of O. humifusa stems in rats with hepatic damage treated with carbon tetrachloride (CCl4). The increase in the activities of serum AST, ALT, and ALP induced by CCl4 was suppressed by O. humifusa stems.
Quantitative RT-PCR analysis showed that O. humifusa fruits treatment increased the expression of HMGR, an enzyme involved in cholesterol synthesis and regulation, compared to that in the untreated HF group. Dietary cholesterol markedly downregulates HMGR mRNA expression via a feedback repression mechanism of cholesterol synthesis [47], suggesting that hepatic cholesterol biosynthesis is inhibited by high dietary cholesterol. In the present study, LDL-C levels tended to decrease with O. humifusa fruits supplementation in the HFD-fed groups. Our results suggest that, unlike O. humifusa stems, fruits can regulate lipid metabolism under conditions of HFD-induced insulin resistance.
A limitation of our study is that we employed direct supplementation with O. humifusa instead of O. humifusa-derived ingredients. However, to the best of our knowledge, the present study is the first to show that O. humifusa stems ameliorate insulin resistance in rats with HFD-induced obesity but not in diabetic rats. Moreover, no studies have compared O. humifusa stems with O. humifusa fruits to specify which part of O. humifusa has better hypoglycemic and/or hypolipidemic effects. We demonstrated that O. humifusa stems significantly improved insulin sensitivity in HFD-fed rats.
In the present study, the major flavonoids from O. humifusa stems and fruits were identified as quercetin and its metabolite isorhamnetin derivatives, with higher concentrations in the stems than in the fruits. These compounds are beneficial for the maintenance of glucose homeostasis by enhancing glucose uptake into skeletal muscle cells [48]. Moreover, quercetin and isorhamnetin ameliorate insulin resistance in animal models of HFD-induced obesity [49] and diabetes [50]. The most abundant flavonoids in O. humifusa stems were isorhamnetin-3-O-rutinoside and isorhamnetin-3-O-glucoside. Isorhamnetin-3-O-rutinoside was found at very high and more significant levels in the stems (395.20 ± 5.05 µg/g) than in fruits (179.29 ± 1.48 µg/g). Moreover, the O. humifusa stems (193.45 ± 2.76 µg/g) were found to contain more isorhamnetin-3-O-glucoside than O. humifusa fruits (9.14 ± 0.83 µg/g). Isorhamnetin-3-O-rutinoside and isorhamnetin-3-O-glucoside showed inhibitory effects on α-amylase activity with IC50 values of 0.129 and 0.619 mM, respectively [51]. Additional inhibitory effects of these 2 compounds have been reported for protein tyrosine phosphatase 1B activity with IC50 values of 1.20 µM and 1.16 µM, respectively [51]. The reduced insulin resistance observed in the present study may be attributable to the abundance of flavonoids in O. humifusa stems.
An HFD-fed mouse group treated with 50 or 100 mg of water-soluble polysaccharide for 4 weeks showed significantly decreased TG and insulin levels, as well as increased adiponectin levels, compared to an untreated HFD mouse group [52]. Based on the study examining polysaccharides extracted from O. humifusa [52], glucose-lowering effects leading to improved insulin sensitivity observed in the present study could be attributed to the high amount of dietary fiber in O. humifusa stems. However, supplementation with O. humifusa still improved insulin sensitivity when the experimental diet was prepared by substituting a portion of some ingredients, including fiber, from the control diet [36]. Further studies are required to isolate and characterize the active compounds of O. humifusa stems.
In conclusion, 2% O. humifusa stems improved insulin resistance by altering fasting glucose levels in rats fed an HFD. This finding suggests that the abundance of quercetin and isorhamnetin in the 2% O. humifusa stems alleviates insulin resistance.

ACKNOWLEDGMENTS

The authors would like to thank Minkyung Je, Kyeonghoon Kang, Gyeonghye Baek, and Jimin Jeong for their valuable contributions in obtaining samples after the animals were euthanized.

Notes

Funding: This work was supported by the research grant of the Gyeongsang National University in 2022 and the National Research Foundation of Korea (NRF) grant funded by the Korea government (MSIT) (No. 2021R1F1A1064414).

Conflict of Interest: The authors declare no potential conflicts of interests.

Author Contributions:

  • Conceptualization: Kim Y, Lee YM.

  • Data curation: Kim Y, Lee YM, Hwang IG.

  • Formal analysis: Kim Y, Lee YM, Hwang IG, Choi Y, Kim E.

  • Investigation: Kim Y, Lee YM, Hwang IG, Choi Y, Kim E.

  • Methodology: Lee YM, Hwang IG.

  • Supervision: Kim Y, Lee YM.

  • Validation: Kim Y, Lee YM, Hwang IG, Choi Y.

  • Visualization: Kim Y, Lee YM, Hwang IG, Choi Y.

  • Writing - original draft: Kim Y, Lee YM.

  • Writing - review & editing: Kim Y, Lee YM.

References

1. Boutari C, Mantzoros CS. A 2022 update on the epidemiology of obesity and a call to action: as its twin COVID-19 pandemic appears to be receding, the obesity and dysmetabolism pandemic continues to rage on. Metabolism. 2022; 133:155217. PMID: 35584732.
crossref
2. Hill JO, Wyatt HR, Peters JC. Energy balance and obesity. Circulation. 2012; 126:126–132. PMID: 22753534.
crossref
3. Woolcott OO, Seuring T. Prevalence trends in obesity defined by the relative fat mass (RFM) index among adults in the United States: 1999–2018. Metabolism. 2022; 128:155027.
crossref
4. Kivimäki M, Strandberg T, Pentti J, Nyberg ST, Frank P, Jokela M, Ervasti J, Suominen SB, Vahtera J, Sipilä PN, et al. Body-mass index and risk of obesity-related complex multimorbidity: an observational multicohort study. Lancet Diabetes Endocrinol. 2022; 10:253–263. PMID: 35248171.
5. Petrie JR, Guzik TJ, Touyz RM. Diabetes, hypertension, and cardiovascular disease: clinical insights and vascular mechanisms. Can J Cardiol. 2018; 34:575–584. PMID: 29459239.
crossref
6. Emerging Risk Factors Collaboration. Wormser D, Kaptoge S, Di Angelantonio E, Wood AM, Pennells L, Thompson A, Sarwar N, Kizer JR, Lawlor DA, et al. Separate and combined associations of body-mass index and abdominal adiposity with cardiovascular disease: collaborative analysis of 58 prospective studies. Lancet. 2011; 377:1085–1095. PMID: 21397319.
crossref
7. Mayor S. Being overweight may raise risk of eight more cancers, review finds. BMJ. 2016; 354:i4650. PMID: 27561683.
crossref
8. Fabbrini E, Sullivan S, Klein S. Obesity and nonalcoholic fatty liver disease: biochemical, metabolic, and clinical implications. Hepatology. 2010; 51:679–689. PMID: 20041406.
crossref
9. Francque SM, Dirinck E. NAFLD prevalence and severity in overweight and obese populations. Lancet Gastroenterol Hepatol. 2023; 8:2–3. PMID: 36400096.
10. Tyrrell J, Mulugeta A, Wood AR, Zhou A, Beaumont RN, Tuke MA, Jones SE, Ruth KS, Yaghootkar H, Sharp S, et al. Using genetics to understand the causal influence of higher BMI on depression. Int J Epidemiol. 2019; 48:834–848. PMID: 30423117.
crossref
11. Mili N, Paschou SA, Goulis DG, Dimopoulos MA, Lambrinoudaki I, Psaltopoulou T. Obesity, metabolic syndrome, and cancer: pathophysiological and therapeutic associations. Endocrine. 2021; 74:478–497. PMID: 34625915.
crossref
12. Taylor R. Pathogenesis of type 2 diabetes: tracing the reverse route from cure to cause. Diabetologia. 2008; 51:1781–1789. PMID: 18726585.
crossref
13. Larsson SC, Burgess S. Causal role of high body mass index in multiple chronic diseases: a systematic review and meta-analysis of Mendelian randomization studies. BMC Med. 2021; 19:320. PMID: 34906131.
crossref
14. Kotsis V, Jordan J, Micic D, Finer N, Leitner DR, Toplak H, Tokgozoglu L, Athyros V, Elisaf M, Filippatos TD, et al. Obesity and cardiovascular risk: a call for action from the European Society of Hypertension Working Group of Obesity, Diabetes and the High-risk Patient and European Association for the Study of Obesity: part A: mechanisms of obesity induced hypertension, diabetes and dyslipidemia and practice guidelines for treatment. J Hypertens. 2018; 36:1427–1440. PMID: 29634663.
15. Flegal KM, Kit BK, Orpana H, Graubard BI. Association of all-cause mortality with overweight and obesity using standard body mass index categories: a systematic review and meta-analysis. JAMA. 2013; 309:71–82. PMID: 23280227.
crossref
16. Jia H, Lubetkin EI. Trends in quality-adjusted life-years lost contributed by smoking and obesity. Am J Prev Med. 2010; 38:138–144. PMID: 20117569.
crossref
17. Kolotkin RL, Meter K, Williams GR. Quality of life and obesity. Obes Rev. 2001; 2:219–229. PMID: 12119993.
crossref
18. Finkelstein EA, Trogdon JG, Cohen JW, Dietz W. Annual medical spending attributable to obesity: payer-and service-specific estimates. Health Aff (Millwood). 2009; 28:w822–w831. PMID: 19635784.
crossref
19. Okunogbe A, Nugent R, Spencer G, Ralston J, Wilding J. Economic impacts of overweight and obesity: current and future estimates for eight countries. BMJ Glob Health. 2021; 6:e006351.
20. Okunogbe A, Nugent R, Spencer G, Powis J, Ralston J, Wilding J. Economic impacts of overweight and obesity: current and future estimates for 161 countries. BMJ Glob Health. 2022; 7:e009773.
crossref
21. Anderson EF. The Cactus Family. Portland (OR): Timber Press;2001.
22. Goldstein G, Nobel PS. Water relations and low-temperature acclimation for cactus species varying in freezing tolerance. Plant Physiol. 1994; 104:675–681. PMID: 12232118.
crossref
23. Del Socorro Santos Díaz M, Barba de la Rosa AP, Héliès-Toussaint C, Guéraud F, Nègre-Salvayre A. Opuntia spp.: characterization and benefits in chronic diseases. Oxid Med Cell Longev. 2017; 2017:8634249. PMID: 28491239.
24. Yoon JA, Hahm SW, Park JE, Son YS. Total polyphenol and flavonoid of fruit extract of Opuntia humifusa and its inhibitory effect on the growth of MCF-7 human breast cancer cells. J Korean Soc Food Sci Nutr. 2009; 38:1679–1684.
25. Yoon JA, Hahm SW, Son YS. Nutrients contents in different parts of pickly pear (Opuntia humifusa) and possible anti-breast cancer effect. J Korean Soc Food Sci Nutr. 2009; 22:485–491.
26. Hahm SW, Park J, Son YS. Opuntia humifusa stems lower blood glucose and cholesterol levels in streptozotocin-induced diabetic rats. Nutr Res. 2011; 31:479–487. PMID: 21745630.
crossref
27. Cho JY, Park SC, Kim TW, Kim KS, Song JC, Kim SK, Lee HM, Sung HJ, Park HJ, Song YB, et al. Radical scavenging and anti-inflammatory activity of extracts from Opuntia humifusa Raf. J Pharm Pharmacol. 2006; 58:113–119. PMID: 16393471.
crossref
28. Kim J, Jho KH, Choi YH, Nam SY. Chemopreventive effect of cactus (Opuntia humifusa) extracts: radical scavenging activity, pro-apoptosis, and anti-inflammatory effect in human colon (SW480) and breast cancer (MCF7) cells. Food Funct. 2013; 4:681–688. PMID: 23435602.
crossref
29. Yeo JY, Hwang KW, Park SY. Anti-inflammatory effect of neo-lignan isoamericanin A via suppression of NF-κB in liposaccharide-stimulated RAW 264.7 cells. Trop J Pharm Res. 2020; 19:1857–1862.
30. Hahm SW, Park J, Son YS. Opuntia humifusa partitioned extracts inhibit the growth of U87MG human glioblastoma cells. Plant Foods Hum Nutr. 2010; 65:247–252. PMID: 20814744.
crossref
31. Lee SH, Kim HW, Lee MK, Kim YJ, Asamenew G, Cha YS, Kim JB. Phenolic profiling and quantitative determination of common sage (Salvia plebeia R. Br.) by UPLC-DAD-QTOF/MS. Eur Food Res Technol. 2018; 244:1637–1646.
crossref
32. Kim HW, Lee SH, Yoo SM, Chung MN, Kim JB, Kehraus S, Koenig GM. Identification and quantification of hydroxybenzoyl and hydroxycinnamoyl derivatives from Korean sweet potato cultivars by UPLC-DAD-QToF/MS. J Food Compos Anal. 2021; 100:103905.
crossref
33. Mosser RE, Maulis MF, Moullé VS, Dunn JC, Carboneau BA, Arasi K, Pappan K, Poitout V, Gannon M. High-fat diet-induced β-cell proliferation occurs prior to insulin resistance in C57Bl/6J male mice. Am J Physiol Endocrinol Metab. 2015; 308:E573–E582. PMID: 25628421.
crossref
34. Antunes LC, Elkfury JL, Jornada MN, Foletto KC, Bertoluci MC. Validation of HOMA-IR in a model of insulin-resistance induced by a high-fat diet in Wistar rats. Arch Endocrinol Metab. 2016; 60:138–142. PMID: 27191048.
35. Nemati M, Zardooz H, Rostamkhani F, Abadi A, Foroughi F. High-fat diet effects on metabolic responses to chronic stress. Arch Physiol Biochem. 2017; 123:182–191. PMID: 28276709.
crossref
36. Kang J, Lee J, Kwon D, Song Y. Effect of Opuntia humifusa supplementation and acute exercise on insulin sensitivity and associations with PPAR-γ and PGC-1α protein expression in skeletal muscle of rats. Int J Mol Sci. 2013; 14:7140–7154. PMID: 23538842.
crossref
37. Chandran M, Phillips SA, Ciaraldi T, Henry RR. Adiponectin: more than just another fat cell hormone? Diabetes Care. 2003; 26:2442–2450. PMID: 12882876.
crossref
38. Menzaghi C, Trischitta V, Doria A. Genetic influences of adiponectin on insulin resistance, type 2 diabetes, and cardiovascular disease. Diabetes. 2007; 56:1198–1209. PMID: 17303804.
crossref
39. Katsiki N, Mantzoros C, Mikhailidis DP. Adiponectin, lipids and atherosclerosis. Curr Opin Lipidol. 2017; 28:347–354. PMID: 28463859.
40. Tschritter O, Fritsche A, Thamer C, Haap M, Shirkavand F, Rahe S, Staiger H, Maerker E, Häring H, Stumvoll M. Plasma adiponectin concentrations predict insulin sensitivity of both glucose and lipid metabolism. Diabetes. 2003; 52:239–243. PMID: 12540592.
crossref
41. Liu C, Feng X, Li Q, Wang Y, Li Q, Hua M. Adiponectin, TNF-α and inflammatory cytokines and risk of type 2 diabetes: a systematic review and meta-analysis. Cytokine. 2016; 86:100–109. PMID: 27498215.
crossref
42. Kim EK, Kwon KB, Song MY, Han MJ, Lee JH, Lee YR, Lee JH, Ryu DG, Park BH, Park JW. Flavonoids protect against cytokine-induced pancreatic beta-cell damage through suppression of nuclear factor κB activation. Pancreas. 2007; 35:e1–e9.
43. Ouchi N, Walsh K. Adiponectin as an anti-inflammatory factor. Clin Chim Acta. 2007; 380:24–30. PMID: 17343838.
crossref
44. Jung EY, Yeon SH, Suh HJ. Hypocholesterol effect of Opuntia humifusa extract on high cholesterol diet-induced hypercholesterolemic rats. J Korean Soc Food Sci Nutr. 2014; 43:485–490.
45. Baz L, Algarni S, Al-Thepyani M, Aldairi A, Gashlan H. Lycopene improves metabolic disorders and liver injury induced by a hight-fat diet in obese rats. Molecules. 2022; 27:7736. PMID: 36431836.
crossref
46. Park MK, Lee YJ, Kang ES. Hepatoprotective effect of Cheonnyuncho (Opuntia humifusa) extract in rats treated carbon tetrachloride. Korean J Food Sci Technol. 2005; 37:822–826.
47. Boucher P, de Lorgeril M, Salen P, Crozier P, Delaye J, Vallon JJ, Geyssant A, Dante R. Effect of dietary cholesterol on low density lipoprotein-receptor, 3-hydroxy-3-methylglutaryl-CoA reductase, and low density lipoprotein receptor-related protein mRNA expression in healthy humans. Lipids. 1998; 33:1177–1186. PMID: 9930403.
crossref
48. Jiang H, Yamashita Y, Nakamura A, Croft K, Ashida H. Quercetin and its metabolite isorhamnetin promote glucose uptake through different signalling pathways in myotubes. Sci Rep. 2019; 9:2690. PMID: 30804434.
crossref
49. Kobori M, Masumoto S, Akimoto Y, Oike H. Chronic dietary intake of quercetin alleviates hepatic fat accumulation associated with consumption of a Western-style diet in C57/BL6J mice. Mol Nutr Food Res. 2011; 55:530–540. PMID: 21462320.
50. Matboli M, Saad M, Hasanin AH, A Saleh L, Baher W, Bekhet MM, Eissa S. New insight into the role of isorhamnetin as a regulator of insulin signaling pathway in type 2 diabetes mellitus rat model: molecular and computational approach. Biomed Pharmacother. 2021; 135:111176. PMID: 33401224.
crossref
51. Tundis R, Loizzo MR, Statti GA, Menichini F. Inhibitory effects on the digestive enzyme α-amylase of three Salsola species (Chenopodiaceae) in vitro . Pharmazie. 2007; 62:473–475. PMID: 17663200.
52. Yang EI, Lee CH, Che DN, Jang SI, Kim YS. Biological activities of water-soluble polysaccharides from Opuntia humifusa stem in high-fat-diet-fed mice. J Food Biochem. 2019; 43:e12806. PMID: 31353577.
TOOLS
Similar articles