

 PDF
PDF Citation
 Print
Print


INTRODUCTION
Alcohol-related dementia, characterized by cognitive impairment due to chronic and excessive alcohol consumption, presents a major global public health concern. Alcoholism is one of the causes of mental illness [1], and chronic alcohol consumption causes a decline in memory; problem-solving, learning, and motor abilities; and permanent damage to the structure and function of brain tissue. While several hypotheses propose the pathophysiological mechanism through which alcohol causes brain damage, it is known to be due to the toxicity of ethanol itself, damage to liver function, and the interaction of these factors [2]. A liver directly damaged by ethanol loses its detoxification function, and the accumulation of ammonia affects cerebral blood flow, metabolism, and astrocyte function, not only affecting the dopamine system but also increasing oxidative stress and causing neurotoxicity [3]. Additionally, acetaldehyde by-products or oxidative stress causes inflammatory liver damage and triggers a wide range of immune responses, leading to inflammation and neuronal degeneration of the central nervous system [4].
Numerous types of bamboo are grown and cultivated in Korea [5]. Among them, Phyllostachys edulis (Carrière) J. Houz (PE) is also called Maengjong bamboo or Moso bamboo. It is one of the three major bamboos in Korea, along with Wangdae and Somdae, and is mainly cultivated in the southern region [6]. It is known to mainly eat bamboo shoots, which are young, soft shoots that sprout from bamboo stems [7]. since ancient times, PE has been used as a folk remedy in oriental medicine [8]. It is said to be used to prevent constipation, relieve hangovers, freshen blood, treat stroke and sweating, and relieve fever and dry mouth [9]. To date, research on PE has focused on its anti-inflammatory [10], antibacterial [11], and anticancer activities [1213] within bamboo leaves. Nevertheless, there is a notable absence of research focused on the physiological activities of PE.
Therefore, this study was conducted to investigate whether bamboo shoots improve alcohol-induced cognitive impairment in an in vivo mouse model. We also analyzed the protective mechanisms of bamboo shoots against inflammatory responses and oxidative stress generation.
Go to : 
MATERIALS AND METHODS
Reagents
Sodium chloride, 1.5 M tris-HCl, skim milk, glycine were obtained from LPS Solution Co. (Seoul, Korea). Ethyl alcohol was obtained from Duksan Pure Chemicals Co., Ltd. (Ansan, Korea). Griess reagent, and 2’, 7’-dichlorofluorescin diacetate (DCF-DA) were purchased from Sigma Aldrich Co. (St. Louis, OK, USA). The protein markers and acrylamide were purchased from GenDEPOT Co. (Katy, TX, USA). Protein assay dye and 2× laemmli sample buffer were purchased from Bio-Rad Laboratories (Hercules, CA, USA). The protease inhibitor cocktail and polyvinylidene fluoride (PVDF) membranes were purchased from Merck Millipore Co. (Burlington, MA, USA). Radioimmunoprecipitation assay (RIPA) buffer was purchased from iNtRON Bio. (Seongnam, Korea). Two-mercaptoethanol was purchased from Biopure Co. (Cambridge, MA, USA). Sodium dodecyl sulfate (SDS) and thiobarbituric acid (TBA) were purchased from Thermo Fisher Scientific Co. (Waltham, MA, USA). Trichloroacetic acid (TCA) was purchased from Kanto Chemical Co. (Tokyo, Japan). Dimethyl sulfoxide was purchased from Daejung Co. (Siheung, Korea).
Sample preparation
PE was selected as the 95% ethanol extract based on the in vitro radical scavenging activity in previous study. The ethanol extract of PE was stored at 4°C until is use. All samples were diluted in drinking water to their respective concentrations (100, 250, and 500 mg/kg/day).
Animals and experimental protocols
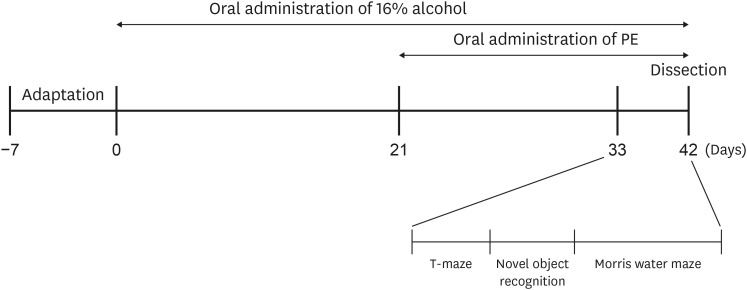
Seven-week-old male C57BL/6N mice were purchased from Orient, Inc. (Seongnam, Korea). Mice weighing 19–22 g were maintained in an animal laboratory under automatically controlled temperature (20 ± 2°C), humidity (50 ± 10%), and 12-h light-dark cycles. After a week of adaptation, the mice were divided into 5 groups (each group comprised 9 mice): 1) Normal, oral administration of drinking water; 2) Control, oral administration of 16% alcohol (5 g/kg/day); 3) PE100, oral administration of 16% alcohol (5 g/kg/day) + PE (100 mg/kg/day); 4) PE250, oral administration of 16% alcohol (5 g/kg/day) + PE (250 mg/kg/day); and 5) PE500, oral administration of 16% alcohol (5 g/kg/day) + PE (500 mg/kg/day). During the 6-week experiment period, 16% alcohol was provided to all groups except normal for the first 3 weeks. For the next 3 weeks, PE was orally administered to the treatment group. All mice could chow freely, and samples were provided by gastric gavage at a volume of 100 μL. The experimental schedule is illustrated in Fig. 1. All experimental procedures were approved by the Institutional Animal Care and Use Committee of the Pusan National University (ED-PNU2021-0229).
T-maze test
The T-maze test was performed to evaluate spatial memory ability, according to the procedures established by Montgomery [14]. In the maze challenge, the mice naturally took either the left or the right path within a T-shaped box. On the training day, each mouse was placed in the starting area with a blocked right passage and allowed to explore freely for 10 min. On the test day, after 24 h, the blocking wall was removed and the mice were allowed to explore both passages (old and new passages) for 10 min. The number of times each passage was entered was recorded, and spatial perception ability (%) was calculated. The space perceptive ability (%) was calculated as the ratio of new passage entries divided by the number of total maze entries, multiplied by 100. It was determined that the higher the proportion of new passages entered, the better a mouse’s memory.
Novel object recognition test
The novel object recognition test was used to evaluate the mice’s cognitive performance in short-term memory [15]. The experiment was performed in a square black box measuring 40 × 40 × 40 cm. Two objects were placed in the box. On the training day, two identical objects were placed within the square field and the mice were placed at the middle of the box. Each mouse was allowed to freely touch both objects for 10 min, and the number of times it touched each object was recorded. On the test day, 24 h later, the mice were placed in the center of the box and allowed to explore for the same amount of time (10 min). However, unlike the in training day, one of the two objects had a different shape. The number of touches per object was recorded. The object recognition ability was expressed as the number of contacts exploring a new object divided by the total number of times a mouse touched the object, multiplied by 100.
Morris water maze test
The water maze test, based on the experimental design by Morris [16], is a generally accepted method for testing cognitive function. This experiment was performed over four consecutive days. During this period, the escape latency and route of each mouse were recorded using a SMART video tracking system 3.0 (Panlab, Barcelona, Spain) and camera. The circular tank used in the experiment had a diameter of 150 cm and height of 60 cm. The tank was filled with water maintained at 22 ± 2°C, and the platform was installed in one of the 4 quadrants after it was equally divided into 4 quadrants, with the center of the tank as a starting point. Water was filled up to 1 cm above the platform, and white paint was dissolved in the water to make the platform invisible. Training was performed thrice a day for 3 days, and the test was conducted on the fourth day. The mice were allowed to learn how to locate the hidden platform using visual tips around the pool. The mice were evenly placed in quadrants 2, 3, and 4 for each experiment, comprising three trials per day, and allowed to find the platform while swimming freely for 60 s. If a mouse reached the target platform within 60 s, the time was recorded in the program, and it remained there for 15 s. If a mouse did not reach the platform in time, it was guided to the platform and then kept there for 15 s to help it remember the platform location. On test day, the last of the 4 days, 3 different tests were conducted. The first experiment was conducted using the same procedures as in the last training session. In the second experiment, the mice were allowed to swim freely for the same duration with the target platform removed, and the time taken to find the quadrant where the platform was located was recorded. In the third experiment, we placed the platform in a pool filled with clear water and measured the time taken to reach the visible platform.
Measurement of reactive oxygen species (ROS) generation
The ROS levels were measured using the DCF-DA assay [17]. Brain, liver, kidney and tissues homogenized with 50 mM phosphate-buffered saline (PBS) were reacted with 12.5 mM DCF-DA solution. The ROS levels were measured using a fluorescence spectrophotometer (FLUOstar OPTIMA, BMG LABTECH, Ortenberg, Germany). It had an excitation wavelength of 485 nm and an emission wavelength of 535 nm.
Measurement of lipid peroxidation
Malondialdehyde (MDA) production was measured as described by Ohkawa et al. [18]. The dissected brain, liver, kidney and tissues were homogenized and centrifuged, then mixed with TBA Reactive Substances solution. The solution was produced by mixing 46 mM TBA, 920 mM TCA, 20% acetic acid, and distilled water. The solution was added to the tissue supernatant, boiled for 20 min to react, then a butanol:pyridine mixture (15:1) was added and centrifuged at 3,000 rpm for 20 min. The absorbance of the supernatant was measured at 540 nm using a microplate reader (LTEK, Seongnam, Korea). The tissue lipid peroxidation was calculated using an MDA standard curve.
Measurement of nitric oxide (NO) production
NO production in homogenized brain, liver, kidney and tissues was measured according to the method described by Schmidt et al. [19]. The supernatant obtained after homogenization and centrifugation was mixed with distilled water (1:1). The Griess reagent was added and incubated for 15 min at room temperature. The absorbance of the mixture was measured at 540 nm using a microplate reader (LTEK). The NO production value of the tissue was calculated using a NaNO2 standard curve.
Western blot analysis
The mice’s brain and liver tissues were homogenized with a lysis buffer containing a protease inhibitor cocktail and RIPA buffer (1:99). Thereafter, the mixture was centrifuged at 12,000 rpm for 30 min, 4°C. The amount of protein in all supernatants was quantified using the Bradford protein assay. Subsequently, a western blot sample was prepared by adding a mixture of 2× laemmli buffer and 2-mercaptoethanol. Equal amounts of samples were loaded onto a 10% SDS polyacrylamide gel and electrophoresed for 2 h at 90 V. Thereafter, the samples were transferred to a PVDF membrane and blocked in 5% skim milk for 90 min. The membranes were then washed 5 times with PBS-T (100 mM PBS containing 0.1% Tween-20) and incubated with the primary antibody overnight. The primary antibodies used for protein expression assay were as follows: beta-actin (β-actin, 1:1,000; Cell Signaling Tech, Beverly, MA, USA), brain-derived neurotrophic factor (BDNF, 1:1,000; Abcam, Cambridge, UK), B-cell lymphoma 2 (Bcl-2, 1:500; Abcam), Bcl-2-associated X protein (Bax, 1:1,000; Cell Signaling Tech), Catalase (CAT, 1:500; Cell Signaling Tech), superoxide dismutase 1 (SOD-1, 1:500; Abcam), and glutathione peroxidase 1 (GPx-1, 1:500; Abcam). After the primary antibody reaction, the membranes were washed four times for 5 min with PBS-T and incubated in the appropriate secondary antibody with horseradish peroxidase conjugated for 1 h. The membranes were then scanned using a chemiluminescent imaging system (Davinch-K, Seoul, Korea) to measure protein expression. The measured results were analyzed using the ImageJ software.
Statistical analysis
The results are presented as mean ± SD. Statistical differences were confirmed using SPSS software (version 26.0; IBM Corporation, Armonk, NY, USA). Duncan’s multiple range test by one-way analysis of variance was used to compare significant differences between the groups. Student’s t-test was performed to compare the training and test sessions in the T-maze and novel object recognition tests. For all comparisons, significant differences used a probability value of P < 0.05.
Go to :
RESULTS
Effects of PE on space perceptive ability in T-maze test
The effects of PE on the spatial cognitive ability of mice were measured using the T-maze test. In the control group that consumed alcohol, no significant change was noted in the number of entries between the new and old paths; however, in the treatment group that consumed PE at different concentrations after alcohol consumption, the exploration of new paths significantly increased. These results suggest that long-term alcohol consumption impairs spatial cognition and learning abilities in mice. By contrast, the PE treatment group significantly preferred exploring new routes (approximately 56–58%) rather than existing routes (approximately 41–42%). This indicates that PE attenuated spatial perceptual impairment in mice (Fig. 2).
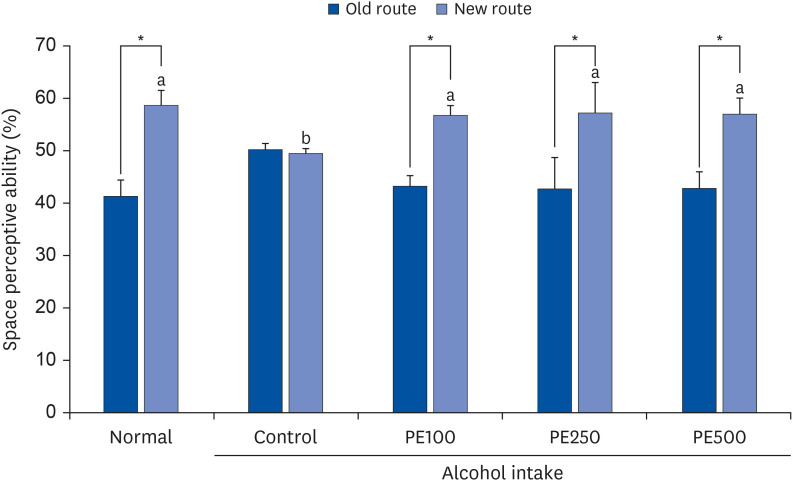 | Fig. 2Effect of PE on the T-maze test in alcohol-induced mouse.Values are mean ± SD.
The mice were divided into 5 groups (each group comprised 9 mice): Normal = water; Control = 16% alcohol (5 g/kg/day); PE100 = 16% alcohol (5 g/kg/day) + PE (100 mg/kg/day); PE250 = 16% alcohol (5 g/kg/day) + PE (250 mg/kg/day); PE500 = 16% alcohol (5 g/kg/day) + PE (500 mg/kg/day).
PE, Phyllostachys edulis (Carrière) J. Houz.
*Space perceptive abilities for old and new routes were significantly different, as determined by Student’s t-test (P < 0.05).
a,bMeans with different letters are significantly different (P < 0.05), according to Duncan’s multiple range test.
|
Effects of PE on object cognitive ability in novel object recognition test
To determine whether PE consumption affected the object recognition ability of mice, we performed a novel object recognition test. The difference in exploration speed between familiar and novel objects was correlated with the mice’ object recognition ability (Fig. 3). Mice that drank alcohol were observed to have an impaired ability to discriminate between objects, with no significant difference between the number of times they touched familiar objects (50.4%) and the number of times they touched novel objects (49.5%). However, mice that were intragastrically administered PE could discriminate between the novel objects. These results showed that PE administration improved impaired object recognition in alcohol-induced mice.
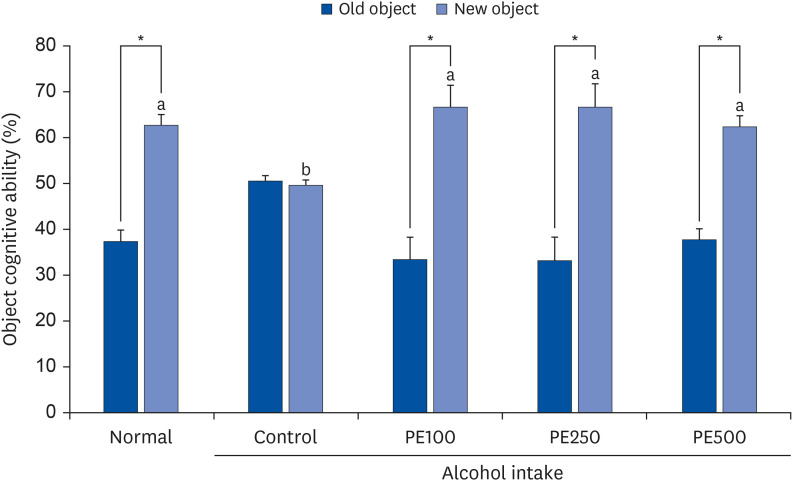 | Fig. 3Effect of PE on novel object recognition test in alcohol-induced mouse.Values are mean ± SD.
The mice were divided into 5 groups (each group comprised 9 mice): Normal = water; Control = 16% alcohol (5 g/kg/day); PE100 = 16% alcohol (5 g/kg/day) + PE (100 mg/kg/day); PE250 = 16% alcohol (5 g/kg/day) + PE (250 mg/kg/day); PE500 = 16% alcohol (5 g/kg/day) + PE (500 mg/kg/day).
PE, Phyllostachys edulis (Carrière) J. Houz.
*Significant differences in cognitive ability between familiar and novel objects were determined using the Student’s t-test (P < 0.05).
a,bMeans with different letters on the bars are significantly different, according to Duncan’s multiple range test (P < 0.05).
|
Effects of PE on Morris water maze test
The effects on spatial memory were investigated using the Morris water maze test. Over the 3 days of training, the mice learned how to find the hidden platform. However, control mice discovered the platform more slowly than normal mice, suggesting that alcohol consumption induced memory deficits. In comparison, mice treated with PE showed a reduction in the latency to reach the hidden platform (Fig. 4A). Additionally, the PE-treated mice had fewer crossings and took a shorter time to discover the target platform compared to the alcohol-induced mice (Fig. 4B). We also conducted a memory retention test to calculate the time spent in the target quadrant area (Fig. 4C). It was confirmed that the occupancy rate of the target quadrant decreased for the alcohol-consuming control group (13.7%) compared to the normal group (25.0%). Conversely, when PE was administered to memory-impaired mice, the average time spent in the target quadrant increased, with the highest rate (26.6%) in the group administered at PE100 group. This suggests that PE is effective in improving learning and memory formation. Finally, the latency to the exposed platform was assessed to determine whether visual and motor skills were influencing factors. None of the groups showed any differences in the latency to reach the exposed platform. This confirmed that the results of the experiment were related to learning and long-term memory but not to the mice’s visual and motor abilities (Fig. 4D). Although there were no significant concentration-dependent differences in the effectiveness of PE, all concentrations effectively ameliorated alcohol-induced cognitive impairment.
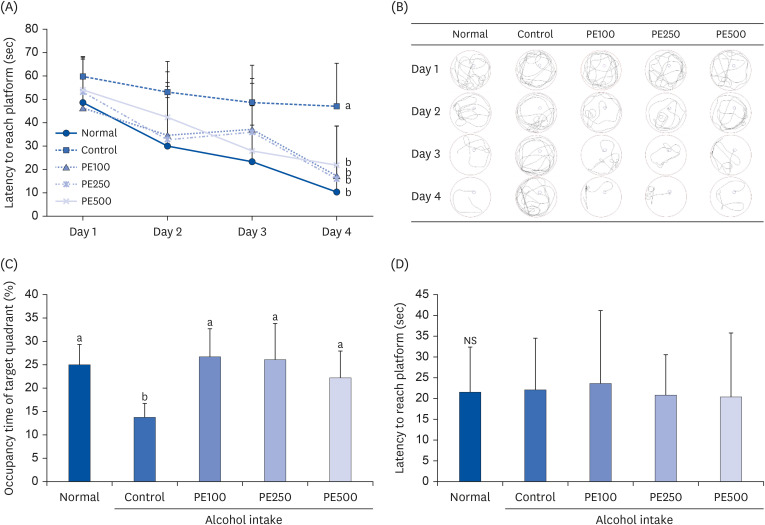 | Fig. 4Effect of PE on Morris water maze test in alcohol-induced mouse.(A) Escape latency to the hidden platform, (B) path tracing of each group to reach the hidden platform, (C) occupancy time of target quadrant, and (D) latency to exposed platform.
Values are mean ± SD.
The mice were divided into 5 groups (each group comprised 9 mice): Normal = water; Control = 16% alcohol (5 g/kg/day); PE100 = 16% alcohol (5 g/kg/day) + PE (100 mg/kg/day); PE250 = 16% alcohol (5 g/kg/day) + PE (250 mg/kg/day); PE500 = 16% alcohol (5 g/kg/day) + PE (500 mg/kg/day).
PE, Phyllostachys edulis (Carrière) J. Houz.
a,bMeans with different letters on the bars are significantly different according to Duncan’s multiple range test (P < 0.05). NS indicates that there is no significant difference (P < 0.05) among groups by Duncan’s multiple range test.
|
Effects of PE on ROS generation
To determine whether PE was effective in suppressing oxidative stress, we measured the ROS levels in the brain, liver, and kidney of mice with alcohol-induced injuries (Fig. 5). Alcohol-induced ROS production was significantly higher in the brain, liver, and kidney of the control group than in those of the normal group. In all groups administrated PE across brain, kidney and liver tissues, ROS production was significantly reduced to levels similar to those in the normal group. Although, there was no variance in concentration based on PE administration, the treatment of PE effectively mitigated ROS production induced by alcohol.
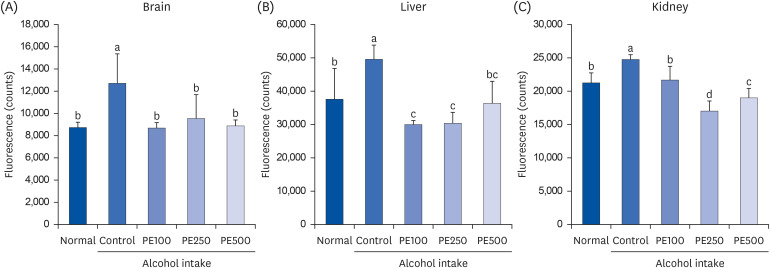 | Fig. 5Effect of PE on ROS in (A) brain, (B) liver, and (C) kidney in alcohol-induced mouse.Values are mean ± SD.
The mice were divided into 5 groups (each group comprised 9 mice): Normal = water; Control = 16% alcohol (5 g/kg/day); PE100 = 16% alcohol (5 g/kg/day) + PE (100 mg/kg/day); PE250 = 16% alcohol (5 g/kg/day) + PE (250 mg/kg/day); PE500 = 16% alcohol (5 g/kg/day) + PE (500 mg/kg/day).
PE, Phyllostachys edulis (Carrière) J. Houz; ROS, reactive oxygen species.
a-dMeans with different letters on the bars are significantly different, according to Duncan’s multiple range test (P < 0.05).
|
Effects of PE on lipid peroxidation
As MDA indicates the degree of lipid peroxidation, MDA content in the mouse brain, kidney, and liver tissues was measured and quantified as an indicator of oxidative stress (Fig. 6). MDA levels in the mice’s brain were significantly increased in the control group (38.2 nmol/L/mg protein) compared to the normal group (27.9 nmol/L/mg protein). However, in all PE-treated groups, MDA production decreased to a significantly lower level than that in the normal group, at 21.8, 26.6, and 25.4 nmol/L/mg protein. Likewise, PE inhibited the alcohol-induced increase in MDA levels in the liver and kidneys. These results indicate that PE administration can prevent alcohol-induced oxidative stress by improving lipid peroxidation.
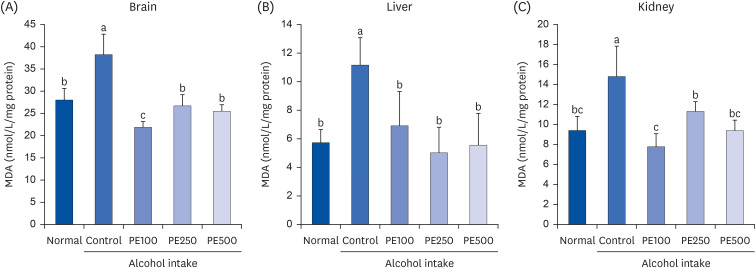 | Fig. 6Effect of PE on lipid peroxidation in (A) brain, (B) liver, and (C) kidney in alcohol-induced mouseValues are mean ± SD.
The mice were divided into 5 groups (each group comprised 9 mice): Normal = water; Control = 16% alcohol (5 g/kg/day); PE100 = 16% alcohol (5 g/kg/day) + PE (100 mg/kg/day); PE250 = 16% alcohol (5 g/kg/day) + PE (250 mg/kg/day); PE500 = 16% alcohol (5 g/kg/day) + PE (500 mg/kg/day).
PE, Phyllostachys edulis (Carrière) J. Houz; MDA, malondialdehyde.
a-cMeans with different letters on the bars are significantly different, according to Duncan’s multiple range test (P < 0.05).
|
Effects of PE on NO production
The protective effects of PE on alcohol-induced NO production in the brain, liver, and kidneys are shown in Fig. 7. We observed that the NO concentration in the brains of the alcohol-induced control group was higher than that in the normal group. Conversely, the PE treatment group had significantly lower NO levels compared to the control group (2.73 μmol/L) at 1.92, 1.98, and 2.01 μmol/L. Additionally, the intragastric administration of PE significantly reduced liver NO levels. In the kidneys, the PE-administered group showed reduced NO production to a level similar to that of the normal group. These results revealed that alcohol consumption leads to the overproduction of NO, and that treatment with PE inhibits it.
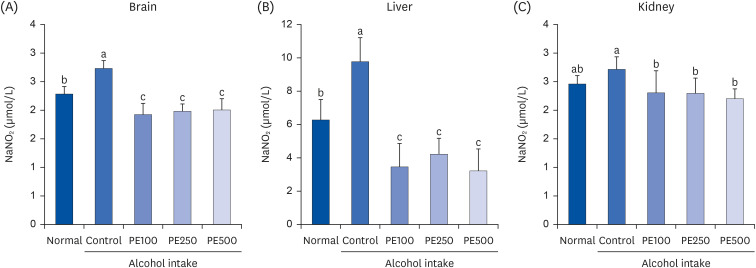 | Fig. 7Effect of PE on NO production in (A) brain, (B) liver, and (C) kidney in alcohol-induced mouse.Values are mean ± SD.
The mice were divided into 5 groups (each group comprised 9 mice): Normal = water; Control = 16% alcohol (5 g/kg/day); PE100 = 16% alcohol (5 g/kg/day) + PE (100 mg/kg/day); PE250 = 16% alcohol (5 g/kg/day) + PE (250 mg/kg/day); PE500 = 16% alcohol (5 g/kg/day) + PE (500 mg/kg/day).
PE, Phyllostachys edulis (Carrière) J. Houz; NO, nitric oxide.
a-cMeans with different letters on the bars are significantly different, according to Duncan’s multiple range test (P < 0.05).
|
Effects of PE on BDNF protein expression
The effect of PE on alcohol-induced neuroprotection in mice brains was studied by measuring the expression of BDNF using western blot analysis (Fig. 8). In comparison to the normal group, BDNF protein levels were notably decreased in the brains of the alcohol-induced control group, indicating a suppression of BDNF expression. Conversely, treatment with PE appeared to promote recovery in BDNF protein expression levels. Specifically, BDNF expression was upregulated in the PE250 group to a level akin to that observed in the normal group.
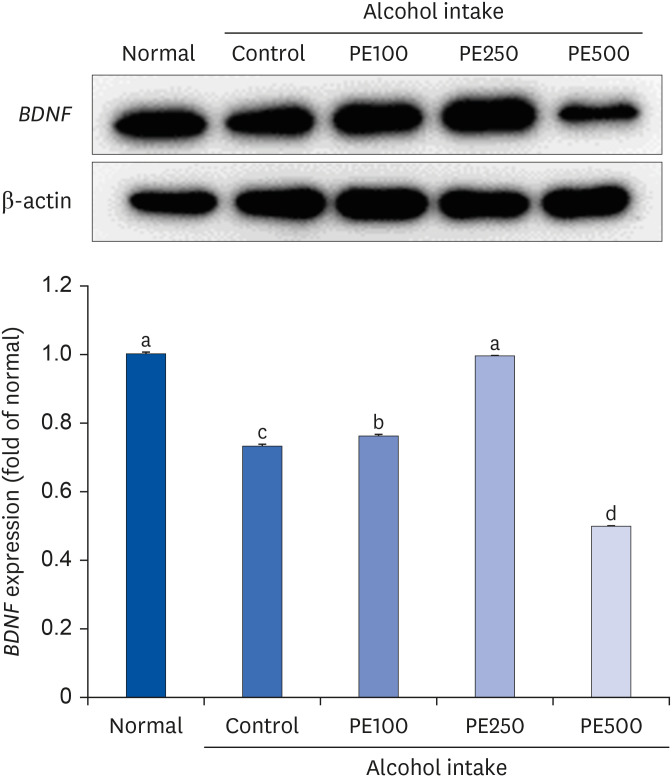 | Fig. 8Effect of PE on BDNF protein expression in alcohol-induced mouse.Values are mean ± SD.
The mice were divided into 5 groups (each group comprised 9 mice): Normal = water; Control = 16% alcohol (5 g/kg/day); PE100 = 16% alcohol (5 g/kg/day) + PE (100 mg/kg/day); PE250 = 16% alcohol (5 g/kg/day) + PE (250 mg/kg/day); PE500 = 16% alcohol (5 g/kg/day) + PE (500 mg/kg/day).
PE, Phyllostachys edulis (Carrière) J. Houz; BDNF, brain-derived neurotrophic factor.
a-dMeans with different letters on the bars are significantly different, according to Duncan’s multiple range test (P < 0.05).
|
Effects of PE on apoptosis-related protein expression
To validate the protective effect of PE against apoptosis, we assessed the protein expression of key genes, Bcl-2 and Bax, in mouse brain tissue. Bax, a known promoter of apoptosis, exhibited a significant increase in protein expression in the alcohol-consuming control group compared to the normal group. However, Bax expression was notably decreased in the PE-treated group relative to the control group. Furthermore, Bcl-2, which impedes cell death mechanisms, displayed significantly lower protein expression in the control group compared to the normal group. Interestingly, Bcl-2 protein expression, which was downregulated, exhibited a slight increase in the PE250 and PE500 groups compared to the normal group. Moreover, upon evaluating the ratio of Bax to Bcl-2, a significant increase was observed in the control group compared to the normal group, whereas a significant decrease in concentration was noted in the PE250 and PE500 treated groups. These findings suggest that PE confers a protective effect against alcohol-induced cell death by inhibiting Bax and promoting Bcl-2 (Fig. 9).
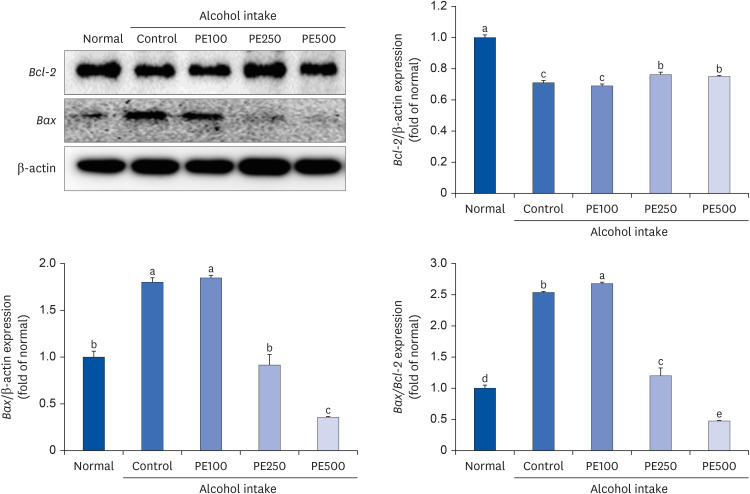 | Fig. 9Effect of PE on apoptosis-related protein expression in alcohol-induced mouse.Values are mean ± SD.
The mice were divided into 5 groups (each group comprised 9 mice): Normal = water; Control = 16% alcohol (5 g/kg/day); PE100 = 16% alcohol (5 g/kg/day) + PE (100 mg/kg/day); PE250 = 16% alcohol (5 g/kg/day) + PE (250 mg/kg/day); PE500 = 16% alcohol (5 g/kg/day) + PE (500 mg/kg/day).
PE, Phyllostachys edulis (Carrière) J. Houz; Bcl-2, B-cell lymphoma 2; Bax, Bcl-2-associated X protein.
a-eMeans with different letters on the bars are significantly different, according to Duncan’s multiple range test (P < 0.05).
|
Effects of PE on oxidative stress-related protein expression
SOD-1 is a major superoxide-scavenging enzyme that catalyzes the replacement of superoxide with hydrogen peroxide and molecular oxygen and is an essential antioxidant enzyme that maintains cellular redox homeostasis. It also actively catalyzes the detoxification of peroxide radicals. Additionally, under normal conditions, CAT is of little importance to most cell types; however, in the presence of oxidative stress, it is the most adaptable antioxidant enzyme and plays an important role in the cellular defense against oxidative damage. GPx-1 functions to detoxify hydrogen peroxide and is one of the most important antioxidant enzymes in humans. Based on this, we measured the expression of proteins related to oxidative enzymes in the liver of mice. In the alcohol-consuming control group, all three oxidative stress factors were reduced compared to the normal group. However, the PE treated group showed recovery patterns similar to the normal group. Specifically, in CAT, significant results were observed only in the low-concentration PE treatment group (PE100). Additionally, both GPx-1 and SOD-1 showed signs of recovery, although their concentrations were not statistically significant. These findings collectively confirm the protective effect of PE against alcohol-induced liver damage and oxidative stress (Fig. 10).
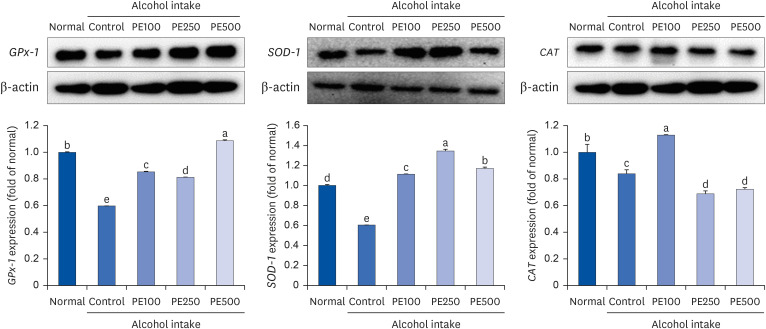 | Fig. 10Effect of PE on oxidative stress-related protein expression in alcohol-induced mouse.Values are mean ± SD.
The mice were divided into 5 groups (each group comprised 9 mice): Normal = water; Control = 16% alcohol (5 g/kg/day); PE100 = 16% alcohol (5 g/kg/day) + PE (100 mg/kg/day); PE250 = 16% alcohol (5 g/kg/day) + PE (250 mg/kg/day); PE500 = 16% alcohol (5 g/kg/day) + PE (500 mg/kg/day).
PE, Phyllostachys edulis (Carrière) J. Houz; GPx-1, glutathione peroxidase 1; SOD-1, superoxide dismutase 1; CAT, catalase.
a-eMeans with different letters on the bars are significantly different, according to Duncan’s multiple range test (P < 0.05).
|
Go to :
DISCUSSION
Chronic alcohol consumption is a risk factor for various forms of dementia, including neuropsychiatric disorders and brain damage [2021]. When excessive alcohol is consumed, ROS is overproduced, causing oxidative stress and DNA damage [2223]. Oxidative stress induced by alcohol consumption downregulates BDNF; disrupts intracellular signaling systems involved in cell survival, growth, and differentiation; and can cause neuroinflammation in the brain, leading to a decline in neurological function [24].
Approximately 70 bamboo species are grown and cultivated in Korea. Bamboo is cold; sweet in taste; non-poisonous; and effective in treating high blood pressure, sterilization, and antifungal treatments. Therefore, it has been used as a folk remedy in oriental medicine since ancient times [25]. Most recent studies have focused on component analysis and antibacterial activity and are mainly limited to the physiological activity of leaves, resulting in a lack of research on in vivo physiological activity [26]. In this study, we examined the effect of improving cognitive and memory abilities in animal experimental models induced by chronic alcohol consumption of PE. T-maze, novel object recognition and water maze test are the most commonly used memory tests. Among them, T-maze and novel object recognition tests are conducted to evaluate short-term spatial cognitive and memory ability by relying on the mouse’s innate spatial detection ability [2728]. On the other hand, Morris water maze is an experiment conducted to evaluate the animal's long-term memory ability based on its learning ability [29]. The chronic alcohol consumption control group didn't show a significant difference in entries between existing and new passages in the T-maze test compared to the normal group. However, the group treated with PE showed an increase in entries into the new passage, indicating improved learning ability. Similar results were seen in the object recognition test, where the control group showed no difference in contact frequency between old and new objects, whereas the PE group had increased contact frequency with new objects. These findings suggest that PE consumption improved learning ability impaired by alcohol consumption. In the Morris water maze experiment, the time to find the hidden escape zone was significantly shortened in the PE group compared to the control group that consumed chronic alcohol. The escape zone was removed and the mice remained in the quadrant, where the escape zone was located. On comparing time, it was confirmed that the group treated with PE remained longer. In addition, when the time to arrive at the escape zone was measured by comparing the hidden and exposed escape zones, there was no significant difference in the exposed escape zone, indicating that the escape zone found using memory and learning abilities. This confirmed that PE improved the long-term memory and learning abilities that were damaged by alcohol consumption.
The levels of NO, MDA, and ROS in the brain, kidney, and liver tissues of the control group that chronically consumed alcohol increased significantly compared to those in the normal group; however, the levels were significantly decreased in the group that was administered PE. This demonstrates the effect of improving oxidative stress induced by chronic alcohol consumption. The expression of dementia- and apoptosis-related proteins was measured in the brain tissue using western blotting. BDNF, a growth factor that regulates neuroplasticity and synapse growth in the adult brain [30], is associated with long-term drug addiction [31]. It has been suggested that long-term alcohol consumption can cause changes in neuroplasticity and ultimately lead to cognitive impairment [32]. The results of this experiment also confirmed that the BDNF concentration in the control group that consumed alcohol decreased. Additionally, it was confirmed that the reduced expression of BDNF was restored when bamboo shoots were treated at low and medium concentrations. However, because BDNF is not the only target for alcohol, further research will be needed on directly or indirectly linked biological factors [3334].
Additionally, a decrease in the expression of Bax, a pro-apoptotic protein, and an increase in the expression of Bcl-2, an anti-apoptotic protein, were observed. By measuring oxidative stress-related factors related to alcohol metabolism in the liver using western blotting, it was confirmed that the expression of antioxidant enzyme factors increased in the group that consumed PE, indicating that PE inhibits alcohol-induced apoptosis and oxidative stress. This is thought to have had an effect on improving cognitive ability by increasing the expression of growth factors in the brain. Hence, PE consumption potentially guards against cognitive decline stemming from chronic alcohol consumption. Further understanding of how PE preserves cognitive function and the imperative for extensive large-scale studies are essential, with expectations for advancements in future research. This underscores the significance of exploring the effectiveness of natural compounds in preventing and mitigating cognitive impairment linked to alcohol consumption.
Go to :
 XML Download