Journal List > Korean Circ J > v.54(7) > 1516087809

Hwang, Park, Nam, Doh, Kim, Kim, Chun, and Koo: Diagnostic Performance of On-Site Automatic Coronary Computed Tomography Angiography-Derived Fractional Flow Reserve

Author's summary

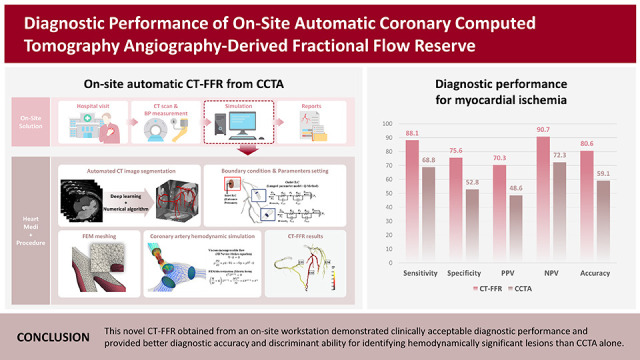
With recent advancements, fractional flow reserve (FFR) can be computed from coronary computed tomography angiography (CCTA). This study validated the diagnostic performance of the on-site automatic CCTA-derived FFR (CT-FFR) using a commercially available workstation to define ischemia-causing coronary artery disease (CAD). This on-site CT-FFR showed a diagnostic accuracy of 80.6%, a sensitivity of 88.1%, and a specificity of 75.6% to predict FFR ≤0.80. In addition, the diagnostic performance and discriminant ability of CT-FFR to predict FFR ≤0.80 were better than those of stenosis severity from CCTA. The current CT-FFR solution can provide useful information on the hemodynamic significance of CAD.

Abstract

Background and Objectives

Fractional flow reserve (FFR) is an invasive standard method to identify ischemia-causing coronary artery disease (CAD). With the advancement of technology, FFR can be noninvasively computed from coronary computed tomography angiography (CCTA). Recently, a novel simpler method has been developed to calculate on-site CCTA-derived FFR (CT-FFR) with a commercially available workstation.

Methods

A total of 319 CAD patients who underwent CCTA, invasive coronary angiography, and FFR measurement were included. The primary outcome was the accuracy of CT-FFR for defining myocardial ischemia evaluated with an invasive FFR as a reference. The presence of ischemia was defined as FFR ≤0.80. Anatomical obstructive stenosis was defined as diameter stenosis on CCTA ≥50%, and the diagnostic performance of CT-FFR and CCTA stenosis for ischemia was compared.

Results

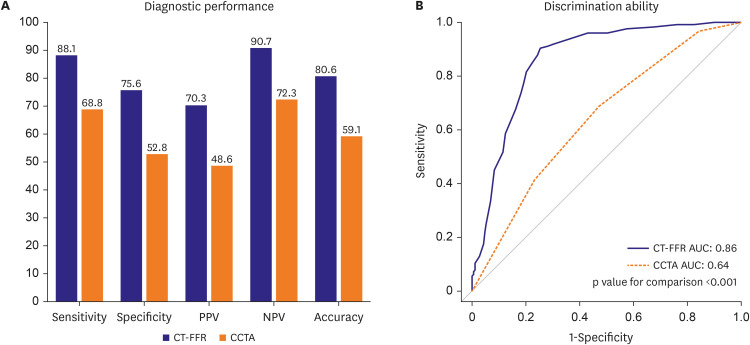
Among participants (mean age 64.7±9.4 years, male 77.7%), mean FFR was 0.82±0.10, and 126 (39.5%) patients had an invasive FFR value of ≤0.80. The diagnostic accuracy, sensitivity, specificity, positive predictive value, and negative predictive value of CT-FFR were 80.6% (95% confidence interval [CI], 80.5–80.7%), 88.1% (95% CI, 82.4–93.7%), 75.6% (95% CI, 69.6–81.7%), 70.3% (95% CI, 63.1–77.4%), and 90.7% (95% CI, 86.2–95.2%), respectively. CT-FFR had higher diagnostic accuracy (80.6% vs. 59.1%, p<0.001) and discriminant ability (area under the curve from receiver operating characteristic curve 0.86 vs. 0.64, p<0.001), compared with anatomical obstructive stenosis on CCTA.

Conclusions

This novel CT-FFR obtained from an on-site workstation demonstrated clinically acceptable diagnostic performance and provided better diagnostic accuracy and discriminant ability for identifying hemodynamically significant lesions than CCTA alone.

Graphical Abstract

kcj-54-382-abf001.jpg

INTRODUCTION

Coronary computed tomography angiography (CCTA) is increasingly utilized as a noninvasive anatomic assessment tool to detect coronary artery disease (CAD).1)2) Current guidelines endorse the use of CCTA as a gatekeeper for further invasive tests in patients with CAD.3) However, anatomic disease severity identified on CCTA has demonstrated an unreliable relationship with hemodynamic significance and this often results in unnecessary invasive coronary angiography.4)5) Currently, fractional flow reserve (FFR) is an invasive standard method to identify lesion-specific myocardial ischemia, and FFR-guided coronary revascularization is recommended in recent guidelines.3)6) With the advancement of technology, FFR can be noninvasively computed from CCTA and numerous studies have demonstrated a good correlation between invasive FFR and CCTA-derived FFR (CT-FFR) and its incremental information on practical decision-making.7)8)9)10)11)12)13)14) However, previous methods need the transfer of CCTA data to external facilities, supercomputing, and waiting times for processing. Several algorithms have been developed to mitigate these limitations and enable these processes on-site.15)16)17)18)19)20)21) Recently, on-site CT-FFR using a novel simpler method has been developed and it makes the calculating process automatic with a commercially available workstation. The aim of this study is to validate this on-site CT-FFR compared with invasive FFR as a reference.

METHODS

Ethical statement

The study protocol was approved by the Institutional Review Boards of each center (Seoul National University Hospital [2207-023-1337], Keimyung University Dongsan Medical Center [DSMC 2022-07-004], Chosun University Hospital [2022-07-001], Yongin Severance Hospital [9-2022-0093], and Inje University Ilsan Paik Hospital [2022-06-026]).

Study design and overview

This is a retrospective, multicenter, comparative, investigator-initiated study to evaluate the diagnostic performance of CT-FFR from routinely acquired CCTA data using the software HeartMedi+ 1.0 (AiMedic, Seoul, Korea) to detect hemodynamically significant CAD. Patients who underwent CCTA within 90 days before invasive coronary angiography and FFR measurement were screened in each participating center. After that, invasive coronary angiography, FFR data, and CCTA data were anonymized and transferred to the independent core laboratories and analyzed in a blind fashion.

Study population

A total of 332 patients were enrolled from 5 tertiary cardiovascular centers (Seoul National University Hospital, Seoul, Korea; Keimyung University Dongsan Medical Center, Daegu, Korea; Inje University Ilsan Paik Hospital, Goyang, Korea; Chosun University Hospital, Gwangju, Korea; Yongin Severance Hospital, Yongin, Korea) in Korea. The inclusion criteria were as follows: 1) adults aged 20 years or older; 2) individuals who had undergone ≥64 multidetector row CCTA within 90 days before invasive coronary angiography and FFR measurement; 3) individuals who had not experienced any clinical events or significant clinical changes between the time of CCTA and invasive coronary angiography. Exclusion criteria included previous coronary intervention or coronary bypass surgery in the target vessel; invasive coronary angiography under unstable conditions; previous myocardial infarction at target vessel territory; congenital heart disease; moderate or severe valvular heart disease; previous valvular heart surgery; left ventricular ejection fraction ≤40% or left ventricular hypertrophy; previous cardiac device implantation; body mass index >35 kg/m2; poor FFR tracing quality; no information on the position of the FFR pressure wire; heart rate ≥100 beats/min during CCTA; CCTA calcium score ≥1000; no nitroglycerin prior to CCTA; CCTA slice thickness >1.0 mm; and significant artifacts in CCTA. Patients were withdrawn from the current study when complete segmentation of the coronary artery failed or an error message was generated from the software during CT-FFR analysis. After the withdrawal of 13 patients, a total of 319 patients were included in the current analysis.

Coronary computed tomography angiography acquisition and analysis

All patients underwent ≥64 multidetector row CCTA following Society of Cardiovascular Computed Tomography guidelines.22)23) CCTA data were transferred with information on the target vessel to the CCTA core laboratory at Seoul National University Bundang Hospital, Seongnam, Korea, for independent and blind analysis of anatomic severity of CAD in the target vessel. CCTA data were analyzed according to the guidelines of the Society of Cardiovascular Computed Tomography by two independent radiologists.24) Coronary lesions were quantified for luminal diameter stenosis as normal (0%), minimal (1% to 24%), mild (25% to 49%), moderate (50% to 69%), severe (70% to 99%), or occlusion (100%). Anatomical obstructive stenosis was defined as a diameter stenosis of 50% or more. The CCTA data were evaluated using a 3D workstation (Brilliance, Philips Medical Systems, Andover, MA, USA). Any discrepancies in their assessments were resolved through consensus between the two radiologists.

Invasive fractional flow reserve measurement and analysis

Invasive coronary angiography was performed with standard techniques. After the administration of intracoronary nitrate (100 or 200 ug), angiographic views were obtained. After diagnostic angiography, FFR was measured as previously described.25) After the engagement of a guide catheter in the coronary artery, the pressure sensor guide wire (Abbott Vascular, Santa Clara, CA, USA or Volcano, San Diego, CA, USA) was equalized to aortic pressure and then placed at the distal segment of a target vessel. Before each physiologic measurement, intracoronary nitrate (100 or 200 ug) was administered. Resting distal to aortic coronary pressure (resting Pd/Pa) was calculated as the ratio of mean distal coronary arterial pressure (Pd) to mean aortic pressure (Pa). Intravenous infusion of adenosine (at a dose of 140 μg per kilogram of body weight per minute) or intracoronary bolus injection of nicorandil (2 mg) was used to induce hyperemia.26) FFR was acquired during maximal hyperemia and was defined as the lowest value of mean hyperemic Pd/Pa. Anonymized invasive coronary angiography and FFR raw data were transferred to the FFR core laboratory at Seoul National University Hospital, Seoul, Korea. The FFR measurements were validated by rechecking the achievement of maximum hyperemia, pressure drift, and other artifacts that could compromise FFR interpretation, and pressure wire location during FFR measurement was checked.

Coronary computed tomography angiography-derived fractional flow reserve computation

CT-FFR computation was performed at the CT-FFR core laboratory at Keimyung University Dongsan Medical Center, Daegu, Korea. CT-FFR was calculated using HeartMedi+ 1.0 according to the manufacturer’s instructions, and CT-FFR was acquired at the location of the pressure wire. The wire location was confirmed by the FFR core laboratory and informed to the CT-FFR core laboratory. When complete segmentation of the coronary artery failed, or an error message was generated from the software, that patient was excluded from the analysis.

Sample size calculation

The primary hypothesis of this study was that the diagnostic accuracy of CT-FFR to predict hemodynamically significant CAD evaluated with an invasive FFR as a reference was greater than 70% with a 1-sided 95% confidence interval (CI). Ischemia was defined as FFR ≤0.80, and the primary analysis was based on a per-patient manner, defining the target vessel as the first FFR-measured vessel. The diagnostic accuracy of CCTA diameter stenosis of 50% or more for the detection of vessel-specic ischemia evaluated by FFR was estimated to be 49%,5) and previous studies have demonstrated that the diagnostic accuracy of CT-FFR ranged from 73% to 87% for predicting FFR ≤0.80.7)8)9) In this clinical study, we anticipated that the diagnostic accuracy of CT-FFR would be at least 20% higher than that of CCTA.8) Assuming that 56% of patients might have vessel-specic ischemia evaluated by FFR,7) 299 patients were required to achieve a 90% statistical power with a one-sided significance level of 0.025 for the primary hypothesis. Considering a 10% dropout rate, we planned to enroll 332 participants.

Statistical analysis

The categorical variables were presented as numbers with percentages, while continuous variables were presented as means ± standard deviations. All analysis was conducted on per-patient analysis by designating the vessel in which FFR was first measured as the representative vessel. The primary outcome measure was the diagnostic accuracy of CT-FFR to detect hemodynamically significant CAD evaluated with an invasive FFR. The diagnostic accuracy was expressed in percentage with a 95% two-sided confidence interval. It would be checked whether the lower boundary of the confidence interval for diagnostic accuracy was higher than 70% by a one-sample proportion test using the Z-test. If the lower boundary of the confidence interval was higher than 70%, it would be interpreted as meeting the primary hypothesis.
The secondary outcome measure included the Spearman’s correlation coefficient of CT-FFR with FFR. Bland-Altman analysis was used to demonstrate the agreement between CT-FFR and FFR. Comparisons of diagnostic performance of CT-FFR, including diagnostic accuracy, sensitivity, specificity, positive predictive value (PPV), and negative predictive value (NPV) to those of CCTA stenosis, and the assessment of discriminant ability using the area under the receiver-operating characteristic curve (AUC) for CT-FFR and CCTA stenosis. A comparison of diagnostic performance was performed using McNemar’s test or weight generalized score statistic as appropriate. The AUCs were compared by Delong’s test. As sensitivity analyses, the diagnostic performance and discriminant ability of CT-FFR compared to CCTA stenosis were also evaluated in a per-vessel manner.
As a post-hoc analysis, we also conducted a subgroup analysis on patients with mild to moderate stenoses by CCTA and an exploratory analysis comparing the secondary outcome measure of CT-FFR with resting Pd/Pa. For exploratory analysis, available resting Pd/Pa data were collected, and the diagnostic threshold for ischemia of resting Pd/Pa was set to 0.92 or less.27)

RESULTS

Patient and lesion characteristics

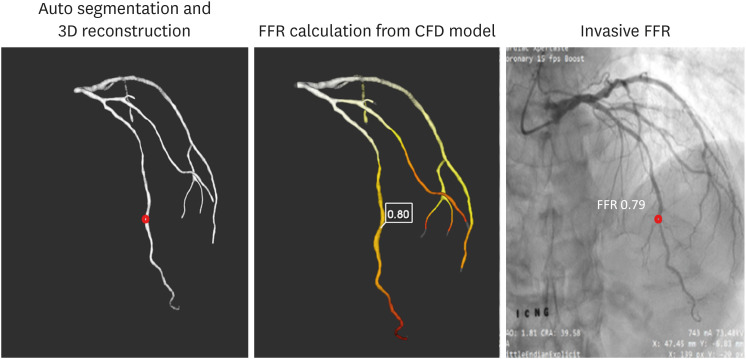
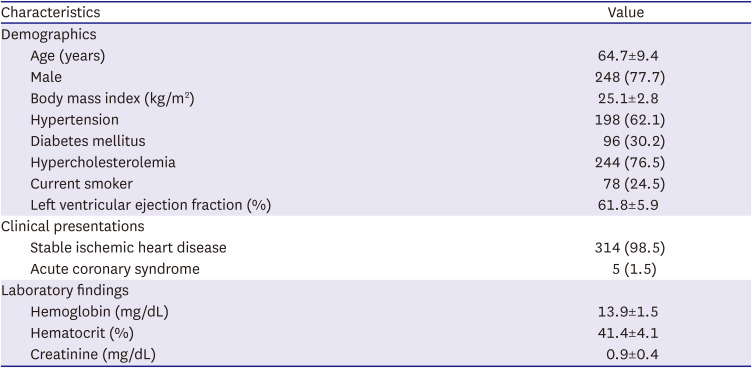
A total of 319 patients with 392 vessels who underwent CCTA, invasive coronary angiography with FFR measurement, and complete CT-FFR computation were included in this analysis (Figure 1). Baseline characteristics are shown in Table 1. The mean age was 64.7±9.4 years, and 77.7% of patients were male. Most patients (98.5%) were diagnosed with stable ischemic heart disease at the time of invasive coronary angiography.
Figure 1

Case example of CT-FFR.

The process of calculating CT-FFR is shown. Three-dimensional model of epicardial coronary artery tree was reconstructed by auto-segmentation from CCTA, and the value of CT-FFR was calculated from the CFD model at the selected point (0.80), which was comparable with the invasive FFR value of 0.82.
3D = three-dimensional; CCTA = coronary computed tomography angiography; CFD = computational fluid dynamic; CT-FFR = coronary computed tomography angiography-derived fractional flow reserve; FFR = fractional flow reserve.
kcj-54-382-g001
Table 1

Baseline patient characteristics

kcj-54-382-i001
Characteristics Value
Demographics
Age (years) 64.7±9.4
Male 248 (77.7)
Body mass index (kg/m2) 25.1±2.8
Hypertension 198 (62.1)
Diabetes mellitus 96 (30.2)
Hypercholesterolemia 244 (76.5)
Current smoker 78 (24.5)
Left ventricular ejection fraction (%) 61.8±5.9
Clinical presentations
Stable ischemic heart disease 314 (98.5)
Acute coronary syndrome 5 (1.5)
Laboratory findings
Hemoglobin (mg/dL) 13.9±1.5
Hematocrit (%) 41.4±4.1
Creatinine (mg/dL) 0.9±0.4
All values were presented as number and proportion or mean with standard deviation.
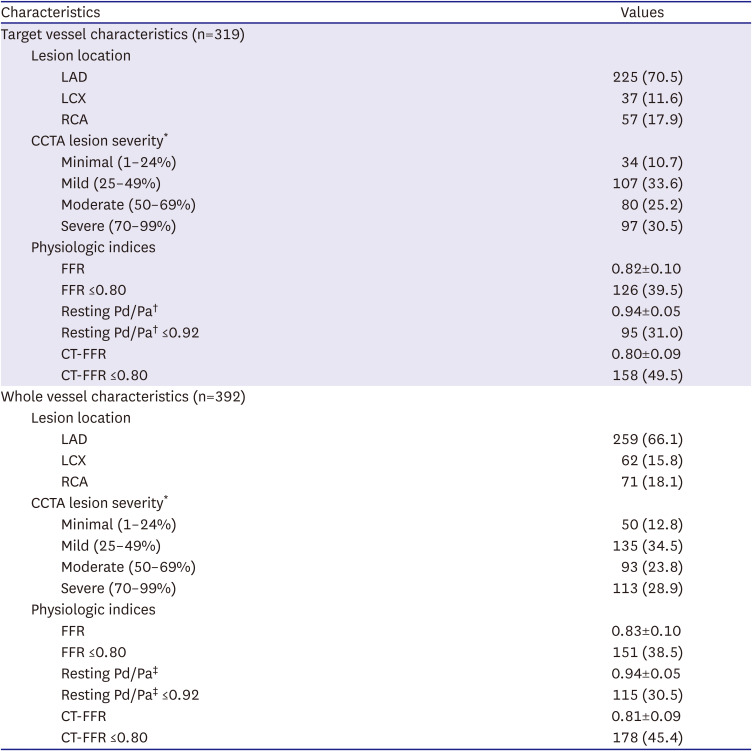
Most target vessels in each patient were located at the left anterior descending coronary arteries (70.5%) (Table 2). CCTA stenosis severity was minimal in 34 patients (10.7%), mild in 107 patients (33.6%), moderate in 80 patients (25.2%), and severe in 97 patients (30.5%) based on CCTA analysis (Table 2). The mean FFR, resting Pd/Pa, and CT-FFR were 0.82±0.10, 0.94±0.05, and 0.80±0.09, respectively, and 39.5% of patients had target vessels with FFR ≤0.80 (Table 2).
Table 2

Baseline lesion characteristics

kcj-54-382-i002
Characteristics Values
Target vessel characteristics (n=319)
Lesion location
LAD 225 (70.5)
LCX 37 (11.6)
RCA 57 (17.9)
CCTA lesion severity*
Minimal (1–24%) 34 (10.7)
Mild (25–49%) 107 (33.6)
Moderate (50–69%) 80 (25.2)
Severe (70–99%) 97 (30.5)
Physiologic indices
FFR 0.82±0.10
FFR ≤0.80 126 (39.5)
Resting Pd/Pa 0.94±0.05
Resting Pd/Pa ≤0.92 95 (31.0)
CT-FFR 0.80±0.09
CT-FFR ≤0.80 158 (49.5)
Whole vessel characteristics (n=392)
Lesion location
LAD 259 (66.1)
LCX 62 (15.8)
RCA 71 (18.1)
CCTA lesion severity*
Minimal (1–24%) 50 (12.8)
Mild (25–49%) 135 (34.5)
Moderate (50–69%) 93 (23.8)
Severe (70–99%) 113 (28.9)
Physiologic indices
FFR 0.83±0.10
FFR ≤0.80 151 (38.5)
Resting Pd/Pa 0.94±0.05
Resting Pd/Pa ≤0.92 115 (30.5)
CT-FFR 0.81±0.09
CT-FFR ≤0.80 178 (45.4)
All values were presented as number and proportion or mean with standard deviation.
CCTA = coronary computed tomography angiography; CT-FFR = coronary computed tomography angiography-derived fractional flow reserve; FFR = fractional flow reserve; LAD = left anterior descending artery; LCX = left circumflex artery; Pd/Pa = distal to aortic coronary pressure; RCA = right coronary artery.
*There was one vessel with no information about lesion severity on CCTA.
There were 13 vessels with no information about resting Pd/Pa.
There were 15 vessels with no information about resting Pd/Pa.
Among all 392 vessels, 66.1% of vessels were at the left anterior descending coronary arteries (66.1%) (Table 2). The mean FFR, resting Pd/Pa, and CT-FFR were 0.83±0.10, 0.94±0.05, and 0.81±0.09, respectively, and 38.5% of vessels had FFR ≤0.80 (Table 2).

Diagnostic performance of coronary computed tomography angiography-derived fractional flow reserve vs. coronary computed tomography angiography for diagnosis of ischemia

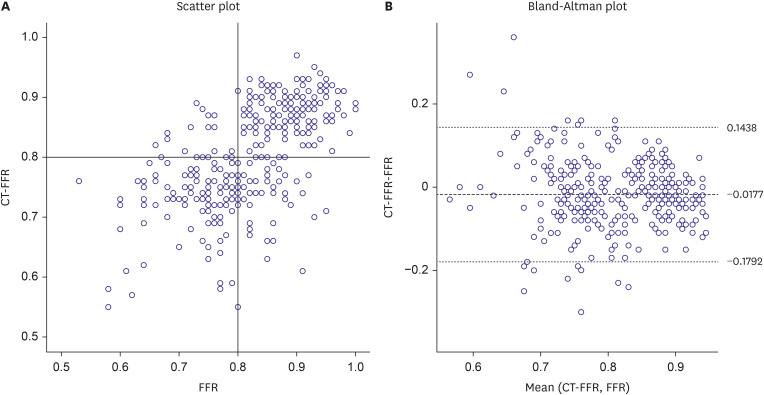
There was a moderate correlation between CT-FFR values and FFR (Spearman’s rank correlation 0.637, p<0.001) (Figure 2). For the primary outcome, the diagnostic accuracy of CT-FFR to predict hemodynamically significant CAD evaluated by FFR was 80.6% (95% CI, 80.5–80.7%), with the lower boundary of the CI exceeding 70% (Figure 3, Table 3). The sensitivity, specificity, PPV, and NPV of CT-FFR were 88.1% (95% CI, 82.4–93.7%), 75.6% (95% CI, 69.6–81.7%), 70.3% (95% CI, 63.1–77.4%), and 90.7% (95% CI, 86.2–95.2%), respectively. CT-FFR applied to target vessels resulted in 111 true positives (34.8%), 146 true negatives (45.8%), 47 false positives (14.7%), and 15 false negatives (4.7%).
Figure 2

Correlation between CT-FFR and FFR.

The correlation between CT-FFR and FFR is shown in (A) the scatter plot and (B) Bland-Altman plot.
CT-FFR = coronary computed tomography angiography-derived fractional flow reserve; FFR = fractional flow reserve.
kcj-54-382-g002
Figure 3

Diagnostic performances and discrimination abilities of CT-FFR and CCTA.

(A) Diagnostic performance and (B) receiver operating characteristic curves comparing CT-FFR and CCTA to predict hemodynamically significant CAD are shown.
AUC = area under the curve; CAD = coronary artery disease; CCTA = coronary computed tomography angiography; CT-FFR = coronary computed tomography angiography-derived fractional flow reserve; NPV = negative predictive value; PPV = positive predictive value.
kcj-54-382-g003
Table 3

Comparison of diagnostic performances and discrimination abilities between CT-FFR and CCTA to predict FFR

kcj-54-382-i003
Diagnostic performance and discrimination ability CT-FFR CCTA p value
Sensitivity (%) 88.1 (82.4–93.7) 68.8 (60.7–76.9) <0.001
Specificity (%) 75.6 (69.6–81.7) 52.8 (45.8–59.9) <0.001
Positive predictive value (%) 70.3 (63.1–77.4) 48.6 (41.2–56.0) <0.001
Negative predictive value (%) 90.7 (86.2–95.2) 72.3 (65.0–79.7) <0.001
Diagnostic accuracy (%) 80.6 (80.5–80.7) 59.1 (59.0–59.3) <0.001
Area under curve 0.86 (0.82–0.90) 0.64 (0.58–0.70) <0.001
All values were presented as estimates with 95% confidence interval.
CCTA = coronary computed tomography angiography; CT-FFR = coronary computed tomography angiography-derived fractional flow reserve; FFR = fractional flow reserve.
For the secondary outcomes, the comparisons of diagnostic performance and discriminant ability between CT-FFR and CCTA to predict hemodynamically significant CAD in target vessels are presented in Figure 3 and Table 3. CT-FFR demonstrated superior diagnostic performance compared to CCTA (80.6% vs. 59.1%, p<0.001 for diagnostic accuracy; 88.1% vs. 68.8%, p<0.001 for sensitivity; 75.6% vs. 52.8%, p<0.001 for specificity; 70.3% vs. 48.6%, p<0.001 for PPV; 90.7% vs. 72.3%, p<0.001 for NPV) (Figure 3A, Table 3). The AUC for CT-FFR was 0.86 and was higher than that of CCTA (p<0.001) (Figure 3B, Table 3).
In whole vessel analyses, the diagnostic accuracy, sensitivity, specificity, PPV, NPV, and AUC of CT-FFR on vessel level were 79.8% (95% CI, 79.8–79.9%), 82.8% (95% CI, 76.8–88.8%), 78.0% (95% CI, 72.8–83.2%), 70.2% (95% CI, 63.5–76.9%), 87.9% (95% CI, 83.5–92.2%), and 0.80 (95% CI, 0.76–0.84), respectively, and those of CT-FFR were significantly higher than those of CCTA (Supplementary Table 1).

Diagnostic performance of coronary computed tomography angiography-derived fractional flow reserve for patients with mild to moderate stenosis severity

Among 319 patients, 187 patients (58.6%) had mild to moderate stenosis in target vessels, and 69 patients (36.9%) had hemodynamically significant stenosis in target vessels. The diagnostic performance and discriminant ability of CT-FFR in these patients were as follows: diagnostic accuracy of 78.1% (95% CI, 77.9–78.3%), sensitivity of 84.1% (95% CI, 75.4–92.7%), specificity of 74.6% (95% CI, 66.7–82.4%), PPV of 65.9% (95% CI, 56.0–75.8%), NPV of 88.9% (95% CI, 82.7–95.1%), and AUC of 0.84 (95% CI, 0.79–0.90) (Table 4). When compared to the anatomical severity of CCTA, CT-FFR showed consistently higher diagnostic performance and discriminant ability in patients with mild to moderate stenosis (Table 4).
Table 4

Comparison of diagnostic performances and discrimination abilities between CT-FFR and CCTA to predict FFR with mild to moderate stenosis

kcj-54-382-i004
Diagnostic performance and discrimination ability CT-FFR (n=187, 58.6%) CCTA (n=187, 58.8%) p value
Sensitivity (%) 84.1 (75.4–92.7) 49.3 (37.5–61.1) <0.001
Specificity (%) 74.6 (66.7–82.4) 61.0 (52.2–69.8) 0.027
Positive predictive value (%) 65.9 (56.0–75.8) 42.5 (31.7–53.3) <0.001
Negative predictive value (%) 88.9 (82.7–95.1) 67.3 (58.4–76.2) <0.001
Diagnostic accuracy (%) 78.1 (77.9–78.3) 56.7 (56.4–56.9) <0.001
Area under curve 0.84 (0.79–0.90) 0.55 (0.48–0.63) <0.001
All values were presented as estimates with 95% confidence interval.
CCTA = coronary computed tomography angiography; CT-FFR = coronary computed tomography angiography-derived fractional flow reserve; FFR = fractional flow reserve.

Diagnostic performance of coronary computed tomography angiography-derived fractional flow reserve vs. resting distal to aortic coronary pressure

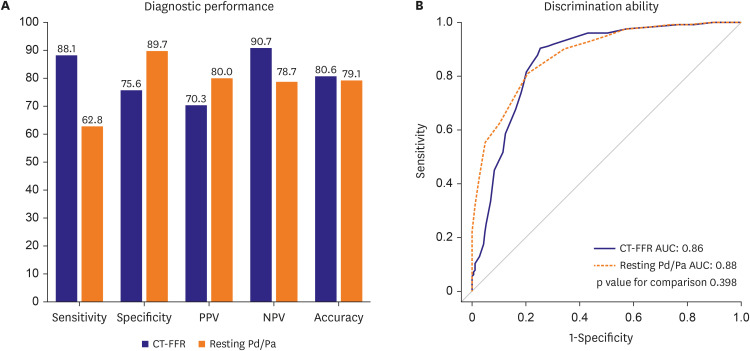
There were no significant differences between CT-FFR and resting Pd/Pa in terms of diagnostic accuracy (80.6% vs. 79.1%, p=0.760) and AUC (0.86 vs. 0.88, p=0.398) for identifying ischemia (Figure 4, Supplementary Table 2). CT-FFR showed significantly higher sensitivity and NPV, whereas resting Pd/Pa showed significantly higher specificity and PPV for the diagnosis of ischemia (Figure 4, Supplementary Table 2).
Figure 4

Diagnostic performances and discrimination abilities of CT-FFR and resting Pd/Pa.

(A) Diagnostic performance and (B) receiver operating characteristic curves comparing CT-FFR and resting Pd/Pa to predict hemodynamically significant CAD are shown.
AUC = area under the curve; CAD = coronary artery disease; CT-FFR = coronary computed tomography angiography-derived fractional flow reserve; NPV = negative predictive value; PPV = positive predictive value; Pd/Pa = distal to aortic coronary pressure.
kcj-54-382-g004

DISCUSSION

The current study evaluated the diagnostic performance of on-site automatic CT-FFR using a commercially available workstation as compared with invasive FFR as a reference. The major finding was as follows. First, CT-FFR demonstrated moderate correlation with invasive FFR and provided a diagnostic accuracy of 80.6% with reasonable sensitivity and specificity. Second, the diagnostic performance and discriminant ability of CT-FFR to predict hemodynamically significant CAD was superior to the diameter stenosis on CCTA in both per-patient and per-vessel analyses. Third, superior diagnostic performance and discriminant ability of CT-FFR to CCTA alone were consistently found in patients with mild to moderate stenotic CAD.
Identifying ischemia-causing coronary artery lesions is essential to deciding treatment strategies in patients with CAD.3)6) Even though CCTA has become a popular noninvasive anatomic assessment tool for detecting or excluding CAD, it is limited to defining the presence of myocardial ischemia caused by CAD.4)5) With technical advancement, CT-FFR computed from CCTA has been developed and demonstrated a good correlation with invasive FFR.7)8)9)10) However, traditional CT-FFR computation using computational fluid dynamic (CFD) has several limitations in the needs of transferring CCTA data to an external laboratory, processing with supercomputing, and waiting times for several hours. Even though several algorithms were recently developed to overcome these issues and provided on-site solutions, the segmentation process to build a 3-dimensional coronary tree is still semi-automatic and requires 30-60 minutes for CT-FFR computation.15)16)17)18) The current on-site solution for CT-FFR used a novel scheme of Q-method-based CFD, with the exclusion of the aortic part from the model, allowing for rapid result derivation even in a conventional desktop computer.28) Another significant advantage of this novel CT-FFR is that the vessel segmentation process and simulation process by CFD are fully automated to minimize human intervention. Therefore, physicians can easily use this platform, even for non-imaging specialists, and the entire process takes less than 30 minutes for CT-FFR computation.
The current study validated the diagnostic performance of CT-FFR using the novel on-site automated algorithm. The diagnostic accuracy of CT-FFR was 80.6% and met the prespecified primary hypothesis in that the diagnostic accuracy of CT-FFR to predict hemodynamically significant CAD. This result is based on the acceptable ranges of sensitivity (88.1%) and specificity (75.6%) of the current CT-FFR, considering the performance of commercially available conventional off-site CT-FFR using CFD (HeartFlow Inc., Redwood City, CA, USA).7)8)9) Several on-site CT-FFR solutions have been developed and demonstrated promising results. On-site CT-FFR using a reduced-order CFD model demonstrated sensitivities and specificities of 76–88% and 65–87%, respectively.15)16)17)18) Recently, machine learning techniques have been applied to CT-FFR technology and demonstrated favorable results with sensitivities and specificities of 79–91% and 76–96%, respectively.19)20)21) Although machine learning-derived CT-FFR showed good diagnostic performance, it is trained based on CT-FFR calculated by a reduced-order CFD algorithm rather than invasive FFR. Therefore, additional validation is deemed necessary. Although the CT-FFRs mentioned above offer several advantages, they were calculated semi-automatic. Even though CT-FFR computation in the current study used the novel simpler method with a conventional desktop computer and was computed by non-imaging specialists, the diagnostic performance of the current CT-FFR in predicting hemodynamically significant CAD was comparable with the previous one.7)8)9)15)16)17)18) These led to a high NPV of 90.7%, indicating a low possibility of false negative tests. Another recent CT-FFR study utilizing transluminal attenuation gradient to define boundary conditions demonstrated outperforming results, with a sensitivity of 89% and specificity of 91%.29) The calculation process was fully automated like our solution, but CT-FFR could not be calculated in 13.9% of cases, emphasizing the necessity for high-quality CCTA images. In contrast, only 3.9% of enrolled patients in our study were excluded from the analysis due to the failure of complete segmentation of the coronary artery and error message generation from the software. These results infer that the current on-site CT-FFR solution can be easily utilized in daily practice, providing reasonable information on the hemodynamic significance of CAD.
The diagnostic performance and discriminant function of the current CT-FFR to predict hemodynamically significant CAD were greater than the diameter stenosis on CCTA. It is well known that anatomic disease severity identified on CCTA has limited diagnostic value in defining the hemodynamically significant CAD.4)5) Therefore, the current CT-FFR can provide additive information on the hemodynamic significance of CAD from CCTA in addition to anatomic severity from CCTA. These findings were consistent with patients with mild to moderate stenosis on CCTA, and diagnostic performance and discriminant ability of the current CT-FFR remained good in these subsets. As major discordance between anatomic significance and hemodynamic significance occurs in these mild to moderate stenotic lesions, the diagnostic performance of the noninvasively computed CT-FFR is truly important in these lesion subsets.30) In addition, the diagnostic accuracy and discriminant ability of CT-FFR were comparable with those of invasively measured resting Pd/Pa, but sensitivity and NPV were higher in CT-FFR than in resting Pd/Pa. These results suggest that CT-FFR is more advantageous in detecting ischemia-causing coronary lesions than resting Pd/Pa, and CT-FFR can provide a lower possibility of false negative tests.
The current study has several limitations to be considered. First, we excluded patients with high Agatston calcium scores (≥1,000 units). Therefore, the current lesions cannot be applied to heavily calcified coronary arteries. Second, 13 patients (3.9%) were excluded from this study due to the failure of complete segmentation of the coronary artery and error message generation from the software. However, this rate is lower than initially expected. Third, patients who underwent coronary bypass surgery or with in-stent restenosis were excluded. Therefore, the current results could not be applied to these patients. Fourth, although our results are comparable with those of previous studies, the current on-site CT-FFR solution demonstrated relatively low specificity. Therefore, improvement in algorithms and validation processes will be essential to achieve a more accurate prediction of myocardial ischemia.
The diagnostic performance and discriminant ability of an automated on-site CT-FFR algorithm were acceptable for use in the clinical field and can provide additive information on the hemodynamic significance of CAD from CCTA.

Notes

Funding: This research was supported by AiMedic (Seoul, Korea). The funders had no role in study design, data collection and analysis, decision to publish, or preparation of the manuscript.

Conflict of Interest: Dr. Bon-Kwon Koo received an Institutional Research Grant from Abbott Vascular, AiMedic, and Philips Volcano. All other authors declare that there is no conflict of interest relevant to the submitted work.

Data Sharing Statement: The data generated in this study is available from the corresponding author upon reasonable request.

Author Contributions:

  • Conceptualization: Hwang D, Park SH, Nam CW, Doh JH, Kim HK, Kim Y, Chun EJ, Koo BK.

  • Data curation: Hwang D, Park SH.

  • Formal analysis: Hwang D, Park SH.

  • Funding acquisition: Koo BK.

  • Investigation: Nam CW, Doh JH, Kim HK, Kim Y, Chun EJ.

  • Methodology: Nam CW, Doh JH, Kim HK, Kim Y, Chun EJ.

  • Project administration: Koo BK.

  • Resources: Koo BK.

  • Software: Chun EJ.

  • Supervision: Koo BK.

  • Visualization: Hwang D, Park SH.

  • Writing - original draft: Hwang D, Park SH.

  • Writing - review & editing: Hwang D, Koo BK.

References

1. Miller JM, Rochitte CE, Dewey M, et al. Diagnostic performance of coronary angiography by 64-row CT. N Engl J Med. 2008; 359:2324–2336. PMID: 19038879.
crossref
2. Budoff MJ, Dowe D, Jollis JG, et al. Diagnostic performance of 64-multidetector row coronary computed tomographic angiography for evaluation of coronary artery stenosis in individuals without known coronary artery disease: results from the prospective multicenter ACCURACY (Assessment by Coronary Computed Tomographic Angiography of Individuals Undergoing Invasive Coronary Angiography) trial. J Am Coll Cardiol. 2008; 52:1724–1732. PMID: 19007693.
3. Knuuti J, Wijns W, Saraste A, et al. 2019 ESC Guidelines for the diagnosis and management of chronic coronary syndromes. Eur Heart J. 2020; 41:407–477. PMID: 31504439.
4. Douglas PS, Hoffmann U, Patel MR, et al. Outcomes of anatomical versus functional testing for coronary artery disease. N Engl J Med. 2015; 372:1291–1300. PMID: 25773919.
crossref
5. Meijboom WB, Van Mieghem CA, van Pelt N, et al. Comprehensive assessment of coronary artery stenoses: computed tomography coronary angiography versus conventional coronary angiography and correlation with fractional flow reserve in patients with stable angina. J Am Coll Cardiol. 2008; 52:636–643. PMID: 18702967.
6. Virani SS, Newby LK, Arnold SV, et al. 2023 AHA/ACC/ACCP/ASPC/NLA/PCNA Guideline for the Management of Patients With Chronic Coronary Disease: A Report of the American Heart Association/American College of Cardiology Joint Committee on Clinical Practice Guidelines. J Am Coll Cardiol. 2023; 82:833–955. PMID: 37480922.
7. Koo BK, Erglis A, Doh JH, et al. Diagnosis of ischemia-causing coronary stenoses by noninvasive fractional flow reserve computed from coronary computed tomographic angiograms. Results from the prospective multicenter DISCOVER-FLOW (Diagnosis of Ischemia-Causing Stenoses Obtained Via Noninvasive Fractional Flow Reserve) study. J Am Coll Cardiol. 2011; 58:1989–1997. PMID: 22032711.
8. Min JK, Leipsic J, Pencina MJ, et al. Diagnostic accuracy of fractional flow reserve from anatomic CT angiography. JAMA. 2012; 308:1237–1245. PMID: 22922562.
crossref
9. Nørgaard BL, Leipsic J, Gaur S, et al. Diagnostic performance of noninvasive fractional flow reserve derived from coronary computed tomography angiography in suspected coronary artery disease: the NXT trial (Analysis of Coronary Blood Flow Using CT Angiography: Next Steps). J Am Coll Cardiol. 2014; 63:1145–1155. PMID: 24486266.
10. Douglas PS, De Bruyne B, Pontone G, et al. 1-year outcomes of FFRCT-guided care in patients with suspected coronary disease: The PLATFORM study. J Am Coll Cardiol. 2016; 68:435–445. PMID: 27470449.
crossref
11. Yang S, Lesina K, Doh JH, et al. Long-term prognostic implications of hemodynamic and plaque assessment using coronary CT angiography. Atherosclerosis. 2023; 373:58–65. PMID: 36872186.
crossref
12. Yang S, Choi G, Zhang J, et al. Association among local hemodynamic parameters derived from CT angiography and their comparable implications in development of acute coronary syndrome. Front Cardiovasc Med. 2021; 8:713835. PMID: 34589527.
13. Yang S, Koo BK. Coronary physiology-based approaches for plaque vulnerability: implications for risk prediction and treatment strategies. Korean Circ J. 2023; 53:581–593. PMID: 37653694.
crossref
14. Lee JM, Doh JH, Nam CW, Shin ES, Koo BK. Functional approach for coronary artery disease: filling the gap between evidence and practice. Korean Circ J. 2018; 48:179–190. PMID: 29557104.
crossref
15. Coenen A, Lubbers MM, Kurata A, et al. Fractional flow reserve computed from noninvasive CT angiography data: diagnostic performance of an on-site clinician-operated computational fluid dynamics algorithm. Radiology. 2015; 274:674–683. PMID: 25322342.
crossref
16. Kruk M, Wardziak Ł, Demkow M, et al. Workstation-based calculation of CTA-based FFR for intermediate stenosis. JACC Cardiovasc Imaging. 2016; 9:690–699. PMID: 26897667.
crossref
17. Yang DH, Kim YH, Roh JH, et al. Diagnostic performance of on-site CT-derived fractional flow reserve versus CT perfusion. Eur Heart J Cardiovasc Imaging. 2017; 18:432–440. PMID: 27354345.
18. Ko BS, Cameron JD, Munnur RK, et al. Noninvasive CT-derived FFR based on structural and fluid analysis: a comparison with invasive FFR for detection of functionally significant stenosis. JACC Cardiovasc Imaging. 2017; 10:663–673. PMID: 27771399.
19. Coenen A, Kim YH, Kruk M, et al. Diagnostic accuracy of a machine-learning approach to coronary computed tomographic angiography-based fractional flow reserve: result from the MACHINE consortium. Circ Cardiovasc Imaging. 2018; 11:e007217. PMID: 29914866.
crossref
20. Tesche C, De Cecco CN, Baumann S, et al. Coronary CT angiography-derived fractional flow reserve: machine learning algorithm versus computational fluid dynamics modeling. Radiology. 2018; 288:64–72. PMID: 29634438.
crossref
21. Röther J, Moshage M, Dey D, et al. Comparison of invasively measured FFR with FFR derived from coronary CT angiography for detection of lesion-specific ischemia: Results from a PC-based prototype algorithm. J Cardiovasc Comput Tomogr. 2018; 12:101–107. PMID: 29409717.
crossref
22. Halliburton SS, Abbara S, Chen MY, et al. SCCT guidelines on radiation dose and dose-optimization strategies in cardiovascular CT. J Cardiovasc Comput Tomogr. 2011; 5:198–224. PMID: 21723512.
23. Abbara S, Arbab-Zadeh A, Callister TQ, et al. SCCT guidelines for performance of coronary computed tomographic angiography: a report of the Society of Cardiovascular Computed Tomography Guidelines Committee. J Cardiovasc Comput Tomogr. 2009; 3:190–204. PMID: 19409872.
crossref
24. Leipsic J, Abbara S, Achenbach S, et al. SCCT guidelines for the interpretation and reporting of coronary CT angiography: a report of the Society of Cardiovascular Computed Tomography Guidelines Committee. J Cardiovasc Comput Tomogr. 2014; 8:342–358. PMID: 25301040.
crossref
25. Lee JM, Choi KH, Hwang D, et al. Prognostic implication of thermodilution coronary flow reserve in patients undergoing fractional flow reserve measurement. JACC Cardiovasc Interv. 2018; 11:1423–1433. PMID: 30093048.
crossref
26. Jang HJ, Koo BK, Lee HS, et al. Safety and efficacy of a novel hyperaemic agent, intracoronary nicorandil, for invasive physiological assessments in the cardiac catheterization laboratory. Eur Heart J. 2013; 34:2055–2062. PMID: 23396491.
crossref
27. Jeremias A, Maehara A, Généreux P, et al. Multicenter core laboratory comparison of the instantaneous wave-free ratio and resting Pd/Pa with fractional flow reserve: the RESOLVE study. J Am Coll Cardiol. 2014; 63:1253–1261. PMID: 24211503.
28. Kwon SS, Chung EC, Park JS, et al. A novel patient-specific model to compute coronary fractional flow reserve. Prog Biophys Mol Biol. 2014; 116:48–55. PMID: 25256102.
crossref
29. Tang CX, Liu CY, Lu MJ, et al. CT FFR for ischemia-specific CAD With a new computational fluid dynamics algorithm: a Chinese multicenter study. JACC Cardiovasc Imaging. 2020; 13:980–990. PMID: 31422138.
crossref
30. Tonino PA, Fearon WF, De Bruyne B, et al. Angiographic versus functional severity of coronary artery stenoses in the FAME study fractional flow reserve versus angiography in multivessel evaluation. J Am Coll Cardiol. 2010; 55:2816–2821. PMID: 20579537.
crossref

SUPPLEMENTARY MATERIALS

Supplementary Table 1

Comparison of diagnostic performances and discrimination abilities between CT-FFR and CCTA to predict FFR in whole vessels
kcj-54-382-s001.xls

Supplementary Table 2

Comparison of diagnostic performances and discrimination abilities between CT-FFR and resting Pd/Pa to predict FFR
kcj-54-382-s002.xls
TOOLS
Similar articles