Journal List > Endocrinol Metab > v.39(3) > 1516087653

Li, Kwon, Choi, Kim, Kang, Jung, Won, Park, Park, and Cho: Diagnostic Accuracy of Preoperative Radiologic Findings in Papillary Thyroid Microcarcinoma: Discrepancies with the Postoperative Pathologic Diagnosis and Implications for Clinical Outcomes

Abstract

Background

The diagnostic accuracy of preoperative radiologic findings in predicting the tumor characteristics and clinical outcomes of papillary thyroid microcarcinoma (PTMC) was evaluated across all risk groups.

Methods

In total, 939 PTMC patients, comprising both low-risk and non-low-risk groups, who underwent surgery were enrolled. The preoperative tumor size and lymph node metastasis (LNM) were evaluated by ultrasonography within 6 months before surgery and compared with the postoperative pathologic findings. Discrepancies between the preoperative and postoperative tumor sizes were analyzed, and clinical outcomes were assessed.

Results

The agreement rate between radiological and pathological tumor size was approximately 60%. Significant discrepancies were noted, including an increase in tumor size in 24.3% of cases. Notably, in 10.8% of patients, the postoperative tumor size exceeded 1 cm, despite being initially classified as 0.5 to 1.0 cm based on preoperative imaging. A postoperative tumor size >1 cm was associated with aggressive pathologic factors such as multiplicity, microscopic extrathyroidal extension, and LNM, as well as a higher risk of distant metastasis. In 30.1% of patients, LNM was diagnosed after surgery despite not being suspected before the procedure. This group was characterized by smaller metastatic foci and lower risks of distant metastasis or recurrence than patients with LNM detected both before and after surgery.

Conclusion

Among all risk groups of PTMCs, a subset showed an increase in tumor size, reaching 1 cm after surgery. These cases require special consideration due to their association with adverse clinical outcomes, including an elevated risk of distant metastasis.

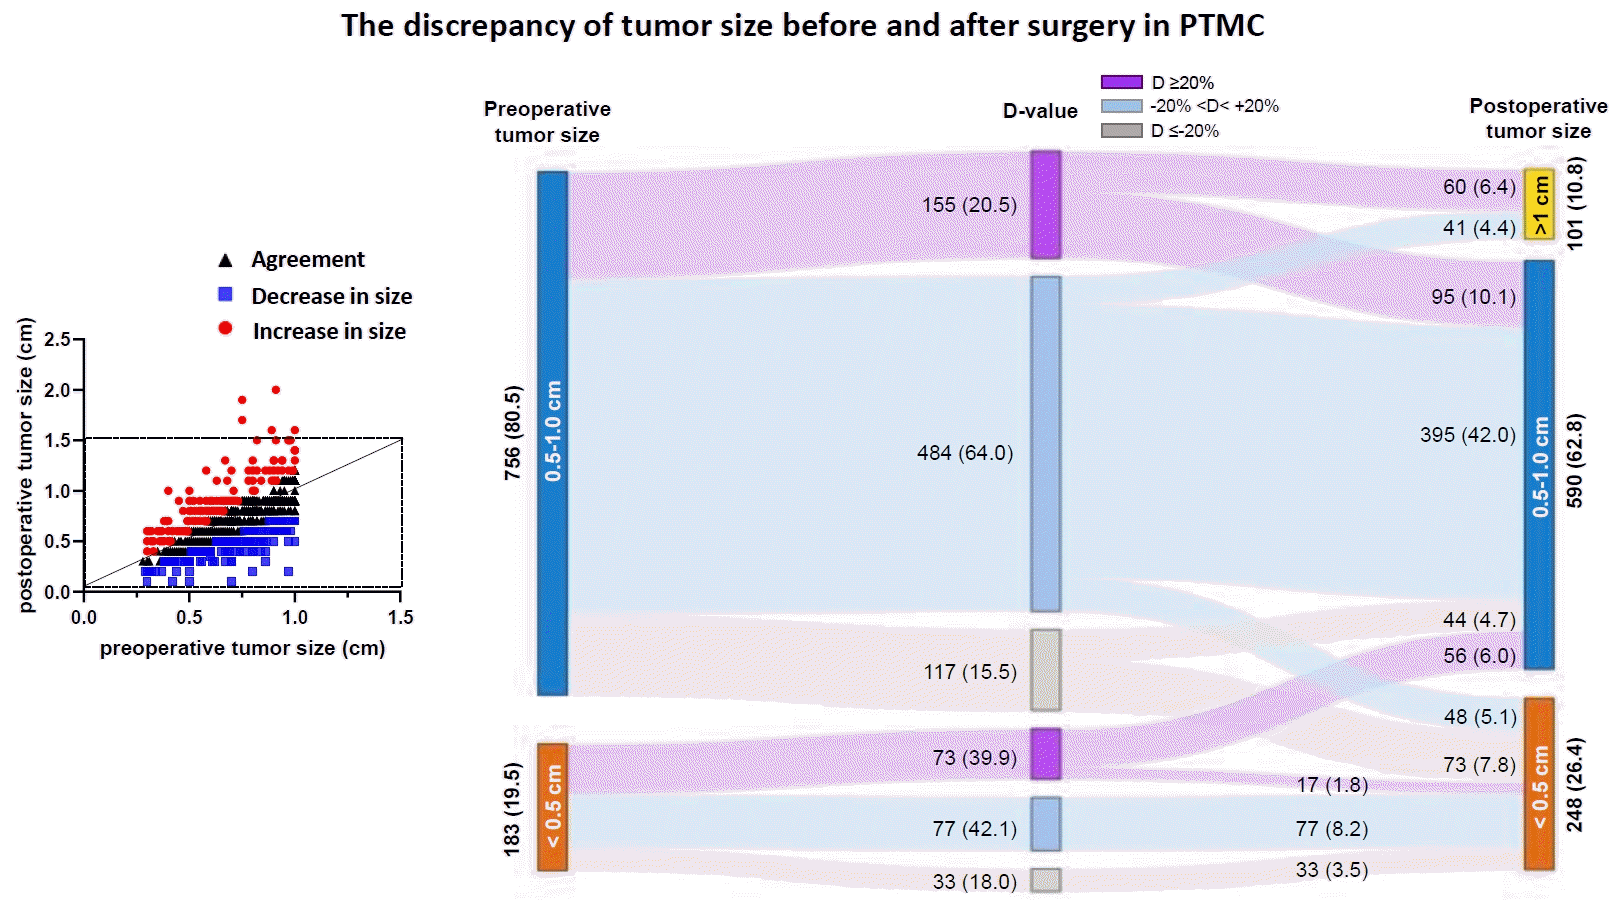
GRAPHICAL ABSTRACT

INTRODUCTION

Papillary thyroid microcarcinoma (PTMC), defined as papillary thyroid carcinoma (PTC) with a maximum tumor diameter of 1 cm or less, has been a major contributor to the rapid increase in the incidence of thyroid cancer in recent years [1-4]. The majority of PTMCs are considered low-risk, they typically do not exhibit aggressive pathological or radiological findings, are believed to have a stable or indolent course, and are associated with an excellent prognosis. Consequently, the American Thyroid Association guidelines recommend that active surveillance (AS) may be a viable alternative to immediate surgical intervention for these low-risk PTMC patients [5]. At present, AS is widely recognized as a primary treatment option for PTMC, and the behavior of PTMCs under AS has been the subject of extensive research [6-9]. However, few studies have focused on non-low-risk PTMCs, which led us to investigate the clinical outcomes of PTMCs across all risk categories, including those that are not considered low-risk.
Meanwhile, the clinical outcomes of PTMCs have been retrospectively studied based on postoperative pathological findings. Larger tumor size and the presence of lymph node metastasis (LNM) have been identified as predictive factors for a poorer prognosis in PTMCs [10-12]. However, in real-world practice, the preoperative diagnosis relies primarily on radiological findings, particularly ultrasonography (USG). Moreover, once a PTMC is classified as low-risk and AS is chosen, it is no longer possible to confirm the pathological characteristics of the tumors. Therefore, the accuracy of preoperative radiological diagnosis is crucial.
This study aimed to investigate the diagnostic accuracy of preoperative radiological evaluations of PTMCs, encompassing both low-risk and non-low-risk groups. It compared tumor size and LNM between preoperative radiological findings and postoperative pathological results, and explored the correlation between these factors and clinical outcomes, such as distant metastasis and recurrence.

METHODS

Subjects

Patients diagnosed with PTMC, encompassing both low-risk and non-low-risk groups, who underwent surgical treatment at Seoul National University Hospital from January 2016 to August 2018 were consecutively enrolled in the study. PTMC was characterized as a thyroid nodule with a maximum diameter of 1 cm or less on USG and classified as Bethesda category V or VI (indicative of suspicious malignancy or confirmed malignancy, respectively) based on fine-needle aspiration (FNA) cytology or core-needle biopsy results [5]. Lesions in Bethesda category V were further confirmed to exhibit highly suspicious features on USG according to the Korean Thyroid Imaging Reporting and Data System (K-TIRADS) [13] or to possess the BRAFV600E mutation. In instances of multiple suspicious nodules, the largest nodule was selected for enrollment, as clinical decisions regarding surgical intervention or AS typically hinge on the size of the largest suspicious nodule. Low-risk PTMC was defined by the absence of cytohistological or radiological risk factors, including LNM, gross extrathyroidal extension, aggressive histology, or distant metastasis at the time of diagnosis.
The study received approval from the Institutional Review Board of Seoul National University Hospital (H-1906-081-1040 and H-1603-044-747). Written informed consent by the patients was waived due to a retrospective nature of our study. An experienced endocrinologist with more than 10 years of expertise in thyroid USG retrospectively reviewed all radiological USG images [14].

Comparison of tumor characteristics before and after surgery

The preoperative radiological assessments of tumor size and LNM were conducted using USG within 6 months before surgery and were then compared with the postoperative pathological findings. Initially, the preoperative tumor size was measured in three dimensions using USG, and the longest diameter was recorded. The discrepancy between preoperative and postoperative tumor (post-T) sizes is represented by the “difference (D)” value. Consistency in tumor size was defined as a D value ranging from –20% to 20%, in accordance with the criteria set forth in a previous study [15]. A D value of ≤–20% was classified as a decrease in size, while a D value of ≥20% was classified as an increase in size.
Second, preoperatively suspicious LNM, generally classified as clinical N1a, was defined as radiologically suspicious LNM with or without cytological confirmation. The clinical and pathological characteristics were compared between two groups: patients diagnosed with LNM only after surgery (post-only LNM) and patients with preoperatively suspicious LNM who were subsequently diagnosed with LNM after surgery (pre-post LNM). Additionally, patients who were postoperatively confirmed to be without LNM constituted the “no LNM” group.

Definition of clinical outcomes

Recurrence was defined as the appearance of a cervical lymph node or thyroid mass after the initial operation, as determined by imaging modalities and subsequently confirmed by pathological or cytological analysis. Distant metastasis was identified by abnormal uptakes of radioactive iodine in distant metastatic lesions on whole body scans (WBS), with or without corroborating findings from other complementary imaging modalities, such as computed tomography (CT) scans. Lung, liver, and bone metastases were categorized as distant metastases, whereas abnormal uptakes in the subclavian lymph nodes and mediastinum were not included. Lesions that continued to show abnormal uptake on WBS after repeated radioactive iodine therapy (RAIT) were classified as persistent disease.

Statistical analysis

The Pearson chi-square test was utilized to analyze categorical variables, while the Student’s t test was applied to normally distributed continuous variables, and the Mann-Whitney U test was employed for continuous variables that did not follow a normal distribution. Survival analysis was carried out using the log-rank test. A P value of less than 0.05 was considered statistically significant. All statistical analyses were performed using SPSS version 27.0 (IBM Corp., Armonk, NY, USA).

RESULTS

Baseline characteristics and surgical outcomes of PTMC patients

A total of 939 patients were diagnosed with PTMCs based on preoperative USG and subsequently underwent surgery. Among these, 738 (78.6%) patients were classified as low-risk PTMC. Table 1 presents the baseline characteristics of all enrolled patients, including a comparison between the low-risk PTMC group and the entire cohort. The average age at diagnosis was 51.0±12.2 years, and 79.3% of the patients were female. The mean preoperative tumor size was 0.70±0.19 cm, and 79 (8.4%) patients exhibited radiologically suspicious LNM prior to surgery. Of the total, 438 (46.6%) patients underwent total thyroidectomy, while 838 (89.2%) underwent central neck dissection. Central neck dissection was performed in both the total thyroidectomy and lobectomy groups, although it was more common in the former (95.0% vs. 84.2%, P<0.001). Lateral neck dissection was carried out in 62 (6.6%) patients, all of whom were part of the total thyroidectomy group. Patients with low-risk PTMCs underwent less extensive surgery, which resulted in a lower percentage of total thyroidectomies compared to the overall patient group (40.2% vs. 46.6%, P=0.009) (Table 1).
After surgery, all 939 patients (100%) were diagnosed with either PTMC or PTC based on histological examination. The postoperative measurement of tumor size averaged 0.72±0.25 cm, and 331 patients (35.3%) had pathologically confirmed LNM (Table 1). Of the 438 patients who underwent total thyroidectomy, 203 (46.3%) received RAIT. Among these, 13 (6.4%) exhibited abnormal uptake, and 201 (99.0%) ultimately achieved complete ablation. Distant metastasis was identified in four patients (0.4%), with metastatic sites including the lungs, bones, and/or liver. Over a median follow-up period of 27.2 months (interquartile range [IQR], 20.2 to 36.5), 12 patients (1.3%) experienced persistent or recurrent disease (Table 1). In the low-risk PTMC group, the rate of RAIT was significantly lower compared to the total patient cohort (14.8% vs. 21.6%, P<0.001). Distant metastasis occurred in one patient (0.1%), and four patients (0.5%) in this group had persistent or recurrent disease (Table 1).

Discrepancy between preoperative and postoperative tumor size in PTMC and representative cases

The tumor size was significantly larger in the postoperative pathological diagnosis than in the preoperative radiological diagnosis (0.72±0.25 cm vs. 0.70±0.19 cm, P=0.021). The concordance rate between radiologic and pathologic measurements of tumor size was 59.7% (561/939), using the criterion of a discrepancy of less than 20% (Table 2). This concordance rate was significantly higher in the group with preoperative tumor sizes of 0.5 to 1.0 cm compared to the group with sizes of 0 to 0.5 cm (64.0% vs. 42.1%, P<0.001). Among low-risk PTMCs, the rates of concordance (total vs. low-risk PTMC, 59.7% vs. 60.0%, P>0.05) and discordance with a decrease in size (total vs. low-risk PTMC, 16.0% vs. 17.2%, P>0.05) were similar to those observed in the total patient cohort (Supplemental Table S1).
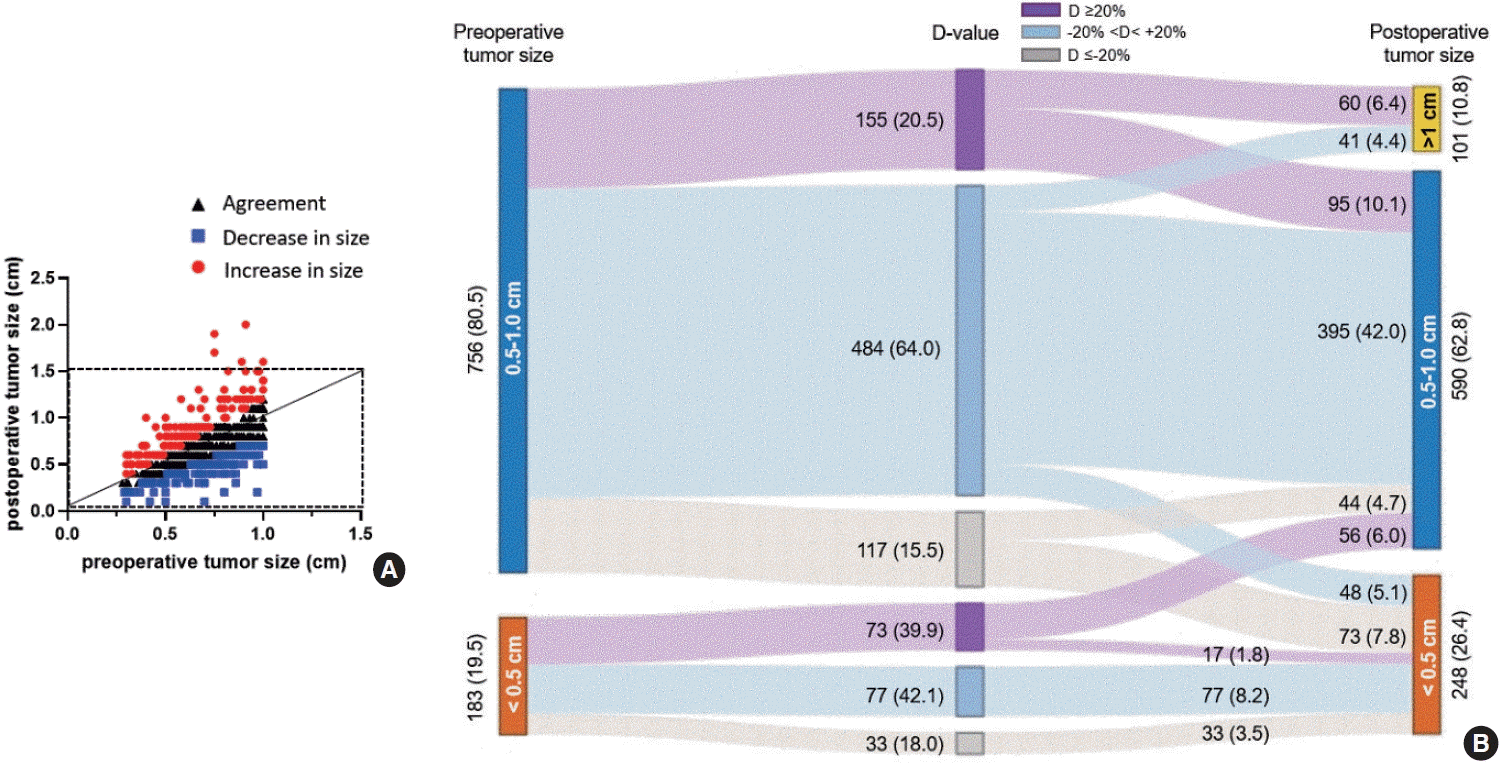
Fig. 1A illustrates the correlation between preoperative and post-T sizes. Notably, an increase in tumor size was observed more frequently than a decrease. Furthermore, the group with preoperative tumor sizes ranging from 0 to 0.5 cm exhibited a higher incidence of tumor size increase compared to the group with sizes from 0.5 to 1.0 cm (39.9% vs. 20.5%, P=0.034). In light of the significant time interval between the preoperative USG and the surgery, which did not exceed 6 months, we conducted a subgroup analysis. This analysis involved sorting patients into monthly intervals based on the time from preoperative USG to surgery. Nearly half of the patients, 48.6%, underwent preoperative USG within 2 months of surgery, and the majority, 65.6%, had it within 3 months before surgery (Supplemental Table S2). Importantly, the concordance rates between radiological and pathological tumor sizes within these time frames were remarkably stable, with rates ranging from 57.3% to 61.2% (Supplemental Table S2).
A Sankey diagram was created to illustrate the changes in tumor size following surgery (Fig. 1B). Prior to surgery, 183 patients (19.5%) had preoperative tumor sizes ranging from 0 to 0.5 cm, while 756 patients (80.5%) presented with tumor sizes of 0.5 to 1.0 cm. Postoperatively, the proportion of tumors measuring 0 to 0.5 cm increased from 19.5% to 26.4%, while the proportion of those measuring 0.5 to 1.0 cm decreased from 80.5% to 62.8%. Unexpectedly, 101 patients (10.8%) exhibited a post-T size greater than 1 cm. All of these patients were initially categorized in the 0.5 to 1.0 cm tumor size group, and 59.4% of them had a D value ≥20% (Fig. 1B).
Fig. 2 presents representative preoperative USG images of cases with discrepancies between preoperative and post-T sizes. In the first case, the discrepancy was due to the selection of an inappropriate region of interest, a result of the tumor’s extremely irregular shape (Fig. 2A, B). Preoperative USG depicted an ill-defined, irregularly shaped lesion, which was assessed as two independent nodules measuring 0.75 cm (Fig. 2A) and 0.47 cm (Fig. 2B). Postoperatively, however, it was confirmed to be a single tumor with a size of 1.9 cm. In the second case, an inadequate echoic window caused by rim calcification led to an inaccurate preoperative measurement. The preoperative thyroid USG revealed a tumor with dense rim calcification measuring 0.67 cm (Fig. 2C), but a 1.3 cm pathologic PTC was confirmed following surgery.
Next, we analyzed the characteristics of the nodules identified on preoperative ultrasound images in the group with post-T size greater than 1 cm, comparing these with size-matched controls from the group with post-T size of 1 cm or less, while maintaining a balanced ratio of 1:1.5. We found no significant differences in ultrasound features, such as echogenicity, margins, calcification, or extrathyroidal extension, between the two groups (Supplemental Table S3). Further research is crucial to determine the predictive factors for nodules that show size discrepancies post-thyroidectomy.

Clinical outcomes and prognostic factors according to postoperative tumor size

Since tumor size is one of the most significant prognostic factors for clinical outcomes in both PTMC and PTC [16,17], we compared clinical outcomes between patients with a post-T size of ≤1 cm (n=838) and those with a post-T size of >1 cm (n= 101). The age and sex distribution was similar between the two groups. However, the body mass index was significantly higher in the post-T size >1 cm group than in the post-T size ≤1 cm group (25.8±4.5 vs. 24.5±3.7, P=0.001) (Table 3). Preoperative radiological diagnosis indicated that the preoperative tumor size was larger in the post-T size >1 cm group than in the post-T size ≤1 cm group (0.93±0.10 cm vs. 0.67±0.18 cm, P<0.001), while the proportions of preoperatively suspicious LNM were similar between the groups. Regarding the surgical procedure, the rates of total thyroidectomy (64.4% vs. 44.5%, P<0.001) and central neck dissection (95.0% vs. 88.5%, P=0.046) were significantly higher in the post-T size >1 cm group than in the post-T size ≤1 cm group (Table 3).
After surgery, the pathologically confirmed post-T size was 0.66±0.19 cm for the post-T size ≤1 cm group and 1.20±0.17 cm for the post-T size >1 cm group, respectively (P<0.001) (Table 3). The incidence of multiplicity (49.5% vs. 31.1%, P<0.001) and microscopic extrathyroidal extension (75.2% vs. 43.7%, P<0.001) was significantly higher in the post-T size >1 cm group compared to the post-T size ≤1 cm group. Additionally, a greater proportion of patients in the post-T size >1 cm group underwent RAIT (41.6% vs. 19.2%, P<0.001), and the frequency of RAIT was also significantly higher in this group (2 vs. 1, P=0.023) (Table 3).
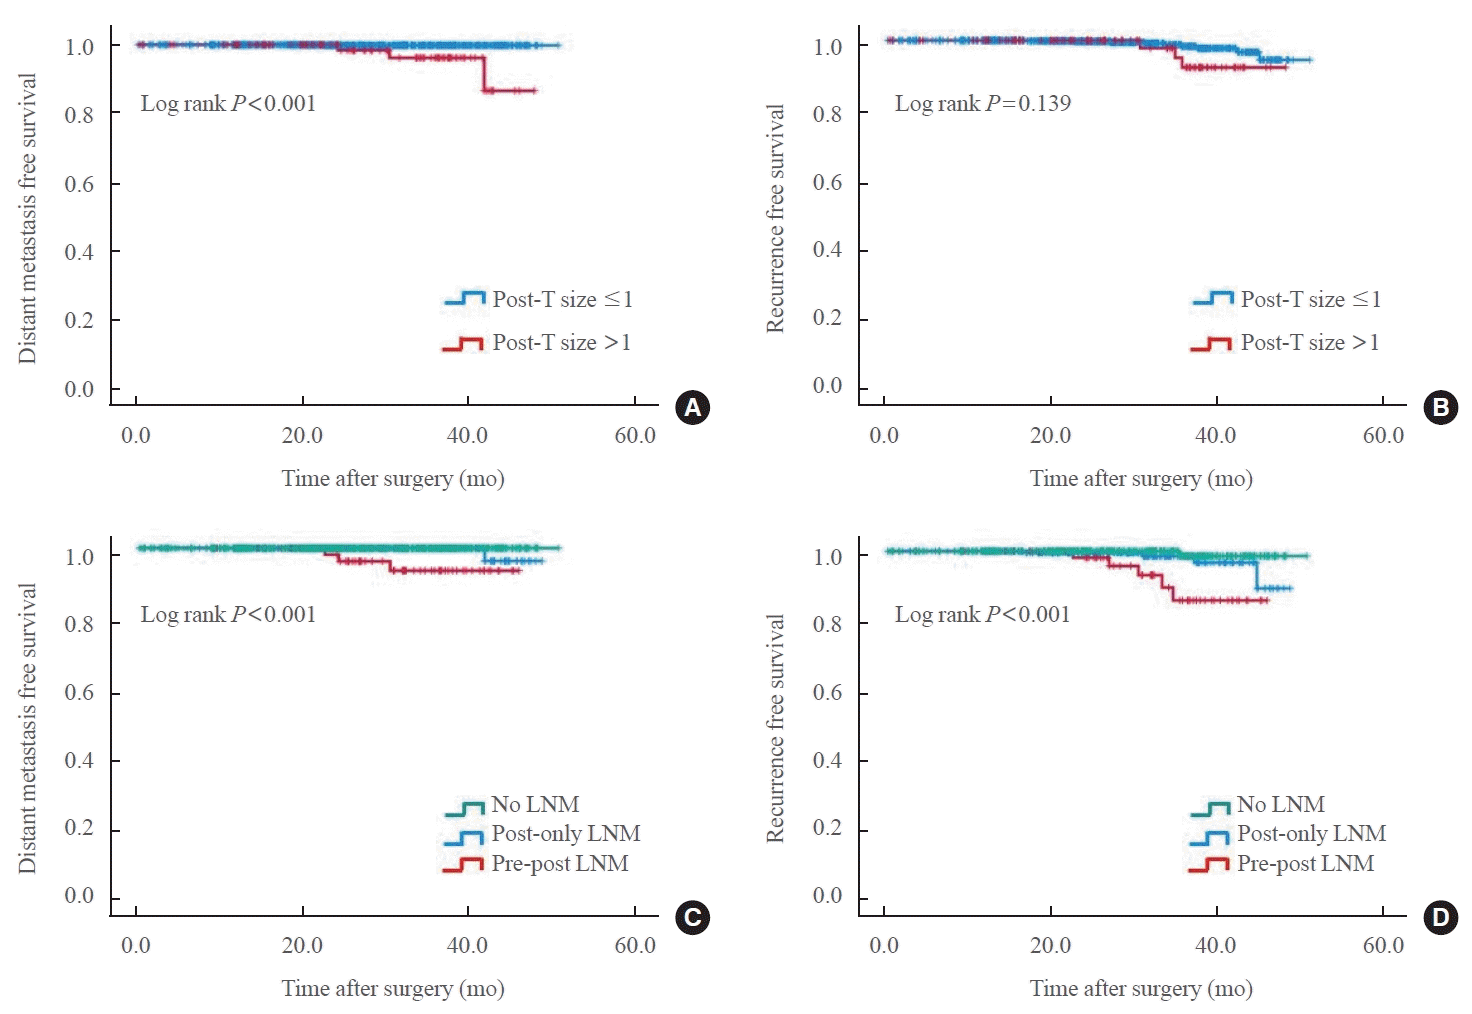
Finally, the presence of distant metastasis was higher in the group with a post-T size >1 cm compared to the group with a post-T size ≤1 cm (3.0% vs. 0.1%, P=0.004) (Table 3). Kaplan-Meier survival analysis revealed that distant metastasis-free survival was significantly lower in the post-T size >1 cm group (P<0.001) (Fig. 3A). However, there was no significant difference in recurrence-free survival between the two groups (P=0.139) (Fig. 3B). Among low-risk PTMC patients, one patient developed distant metastasis and belonged to the post-T size >1 cm group. As a result, distant metastasis-free survival was significantly lower in this group compared to the post-T size ≤1 cm group (P=0.005) (Supplemental Fig. S1). In summary, the post-T size >1 cm group exhibited more histopathologically aggressive characteristics and poorer distant metastasis-free survival than the post-T size ≤1 cm group.

Comparisons of clinical characteristics and outcomes between the pre-post LNM and post-only LNM groups

Before surgery, 79 patients presented with lymph nodes that appeared suspicious for metastasis on preoperative USG, which were generally classified as clinical N1a. FNA confirmed LNM in 53 of these patients (67.1%). After surgery, 72 patients (91.1%) were diagnosed with pathological LNM. However, in seven cases, LNM was not confirmed by postoperative pathology. One case that had been confirmed by preoperative FNA was not diagnosed with LNM after surgery due to the presence of a cystic lesion. In the remaining six cases, preoperative FNA was not performed, but both USG and CT findings suggested suspicious LNM. Nevertheless, the final postoperative pathological results did not indicate LNM in these cases.
Meanwhile, among 860 patients who did not exhibit any suspicious LNM before surgery, and were thus generally classified as clinical N0, 259 patients (30.1%) were diagnosed with pathological LNM after surgery. This group is referred to as the postonly LNM group. To investigate the clinical impacts of this group, their clinical and pathological characteristics were compared with those of the pre-post LNM group. Regarding demographic characteristics, the proportion of males was significantly higher in the pre-post LNM group than in the post-only LNM group (37.5% vs. 25.1%, P=0.038) (Table 4). The rates of total thyroidectomy (94.4% vs. 69.5%, P<0.001) and lateral neck dissection (75.0% vs. 1.9%, P<0.001) were also significantly higher in the pre-post LNM group (Table 4). Postoperative pathological findings, including tumor size, multiplicity, and extrathyroidal extension, were similar between the two groups. However, the characteristics of LNM differed. The size of LNM was larger (median 8.0 mm [IQR, 5.0 to 11.0] vs. 2.0 mm [IQR, 1.0 to 3.0], P<0.001), and the proportion of micrometastasis was lower (8.3% vs. 56.7%, P<0.001) in the pre-post LNM group than in the post-only LNM group. Furthermore, the proportion of patients who underwent RAIT (80.6% vs. 45.9%, P<0.001) and the total cumulative dose of RAIT (100 mCi vs. 60 mCi, P<0.001) were significantly higher in the pre-post LNM group. Additionally, the incidence of distant metastasis (4.2% vs. 0.4%, P=0.034) and the rates of recurrence and persistence (6.9% vs. 1.5%, P=0.026) were significantly higher in the pre-post LNM group (Table 4). Kaplan-Meier survival analysis revealed that both distant metastasis-free survival (P<0.001) (Fig. 3C) and recurrence-free survival (P<0.001) (Fig. 3D) were significantly lower in the pre-post LNM group compared to both the post-only LNM group and the no LNM group. In summary, the postonly LNM group exhibited smaller metastatic foci, a higher proportion of micrometastasis, and more favorable clinical outcomes when compared to the pre-post LNM group.

DISCUSSION

An accurate preoperative diagnosis based on USG is essential for the management of PTMC, as it enables appropriate risk stratification and the selection of AS or surgical intervention. The current study examined the preoperative diagnostic accuracy in a cohort of 939 patients diagnosed with PTMC based on USG findings who subsequently underwent surgical treatment. The concordance rate between radiological and pathological tumor sizes was approximately 60%, with significant discrepancies noted, including an increase in tumor size in 24.3% of cases. Notably, 10.8% of patients had post-T larger than 1 cm. Clinical outcomes were compared between groups with post-T sizes ≤1 and >1 cm, revealing higher rates of tumor multiplicity, microscopic extrathyroidal extension, total thyroidectomy, central neck dissection, RAIT, and distant metastasis in the >1 cm group. These findings suggest more aggressive disease characteristics and poorer distant metastasis-free survival in this group. Regarding LNM, 30.1% of patients who had no preoperative suspicion of LNM were diagnosed with it postoperatively. The group with LNM detected only after surgery, as opposed to both before and after, showed smaller metastatic foci, a higher proportion of micrometastasis, and better clinical outcomes. In summary, a larger post-T size, particularly exceeding 1 cm, is associated with more aggressive disease and poorer distant metastasis-free survival, while LNM detected only postoperatively is indicative of smaller metastatic foci and more favorable clinical outcomes compared to LNM identified both preoperatively and postoperatively.
Previous studies have shown discrepancies in size between preoperative USG measurements and postoperative pathology findings in PTCs. Bachar et al. [18] reported that preoperative radiologic tumor sizes were larger than those determined by pathology, particularly in tumors larger than 1.5 cm. A subgroup analysis of 34 PTMCs revealed no significant differences; however, 18.8% of nodules that measured larger than 1 cm on USG were found to be smaller than 1 cm on pathology [18]. Yoon et al. [19] included 172 PTCs (100 PTMCs) in their study and found that the pathologic tumor size was 10% smaller than the sonographic size. Hahn et al. [15] studied 490 PTCs (272 PTMCs) and observed that preoperative USG tended to overestimate the size of tumors, especially those smaller than 1.0 cm. These consistent findings highlight the need for careful evaluation to prevent unnecessary procedures and overtreatment. In our study, we noted a significant decrease of ≥20% in tumor size in 16.0% of patients, but the clinical significance of such a decrease in PTMCs remains unclear.
Meanwhile, the present study focused on instances where tumor size is frequently underestimated, potentially causing misdiagnosis of PTC as PTMC. A tumor is classified as a PTMC when its size is less than 1 cm, and AS can be considered an initial treatment option in the absence of significant risk factors. Opting for AS as the primary treatment precludes the opportunity for postoperative pathological confirmation of the tumor’s status. Therefore, we investigated the clinicopathological characteristics and surgical outcomes of patients whose tumors were larger than 1 cm after thyroidectomy (post-T size >1 cm group). We found that the preoperative radiologic tumor size was larger in the post-T size >1 cm group than in the post-T size ≤1 cm group. There was no difference in the frequency of radiologic LNM between the two groups. However, postoperative pathology revealed a higher presence of poor prognostic factors and a greater rate of distant metastasis in the post-T size >1 cm group compared to the post-T size ≤1 cm group. These findings suggest that underestimating the size of such tumors and initiating AS as the initial treatment strategy may lead to significant burdens due to unexpected adverse clinical outcomes. While some protocols suggest AS for tumors slightly larger than 1.0 cm, such as those up to 1.5 cm [20-22], our findings underscore the need for meticulous consideration and risk assessment before choosing AS for tumors larger than 1 cm. This emphasizes the critical importance of accurate tumor size evaluation.
The accuracy of USG examinations for PTMC can be compromised by factors such as the nodule’s small size, its characteristics, and technical considerations [23-25]. Challenges arise in differentiating nodules from the surrounding tissue when they have an irregular shape, ill-defined margins, or cystic components [25]. The presence of coexisting thyroiditis can also impede the precise definition of margins and the accuracy of measurements [25]. Additionally, compression from the ultrasound probe may introduce biases in the measurement of nodule size, particularly for cystic nodules, which tend to decrease in size upon compression [26]. Variability in size estimation can occur with nodules that have an irregular shape, ill-defined margins, are affected by thyroiditis, or contain calcifications. Our study highlighted cases where the size of nodules with an irregular shape and dense rim calcification was underestimated. These larger tumors, measuring more than 1 cm, were associated with a poorer prognosis, underscoring the importance of size as a prognostic factor. Therefore, careful consideration is required when using USG to measure the size of tumors with these characteristics.
Given that this study was conducted at a tertiary referral center specializing in thyroid surgery, a significant number of patients with thyroid nodules had undergone FNA prior to their visit to our institution. As a result, there may have been a time lapse between the initial FNA and the patients’ enrollment in the study. During this interval, the size of the nodules could have changed due to factors such as the accumulation of intranodular cystic fluid, inflammation following FNA, and/or micro-bleeding [23,27-29]. Despite this potential limitation, it is noteworthy that the current study represents the largest cohort of exclusively enrolled patients with PTMC and investigates the discrepancy between preoperative and postoperative size measurements in relation to clinical outcomes.
In the current study, we noted a significant difference between preoperative and postoperative LNM in patients with PTMC. Specifically, out of 860 patients who showed no signs of suspicious LNM on USG and/or CT scans, 30.1% were found to have pathological LNM upon examination. It is important to highlight that the group with LNM detected only postoperatively had smaller metastatic deposits in the lymph nodes, which were primarily at the micrometastatic level. However, this group also had a higher LNM ratio. Furthermore, the postoperative-only LNM group exhibited more favorable clinical outcomes compared to the group with LNM identified both preoperatively and postoperatively. This suggests that aggressive treatment may be necessary for cases with LNM suspected before surgery, while LNM discovered incidentally may be of relatively less importance in the management of PTMC.
Conversely, among the seven cases with preoperatively suspected LNM, subsequent pathological examination after surgery revealed no evidence of LNM. In one case, LNM was confirmed through preoperative FNA, but it was not identified in the pathological examination due to cystic degeneration. The clinical implications of cystic degeneration in metastatic lymph nodes, which may reduce in size or completely disappear following surgery, are not yet fully understood. Further investigation with a larger sample size is necessary to better understand this phenomenon.
In conclusion, the size of a subset of PTMCs was underestimated. Notably, 10% of all enrolled tumors exceeded 1 cm and were associated with poor clinical outcomes. These findings highlight the importance of a meticulous evaluation during the preoperative diagnosis to ensure precise assessment and suitable management of PTMCs.

Supplementary Material

Supplemental Table S1.

Comparison of Tumors Showing Agreement and Disagreement between Preoperative Radiological and Postoperative Pathological Size Measurements according to Tumor Size on Radiology in Low-Risk Papillary Thyroid Microcarcinoma Patients
enm-2023-1872-Supplemental-Table-S1.pdf

Supplemental Table S2.

The Agreement Rates in Tumor Size according to the Duration between the Preoperative USG and the Surgery
enm-2023-1872-Supplemental-Table-S2.pdf

Supplemental Table S3.

The Feature of Identified Nodule in Preoperative Ultrasound Images among the Group of Post-T size >1 cm and Post-T size ≤1 cm
enm-2023-1872-Supplemental-Table-S3.pdf

Supplemental Fig. S1.

Comparisons of survival outcomes based on tumor size and lymph node metastasis in postoperative diagnosis in low-risk papillary thyroid microcarcinoma patients. (A, B) Survival outcomes in relation to a tumor size of 1 cm based on postoperative pathological measurement. Kaplan-Meier curves were utilized to analyze distant metastasis-free survival (A) and recurrence-free survival (B) were analyzed.
enm-2023-1872-Supplemental-Fig-S1.pdf

Notes

CONFLICTS OF INTEREST

Sun Wook Cho is the deputy editor of the journal. However, she was not involved in the peer reviewer selection, evaluation, or decision process of this article. No other potential conflicts of interest relevant to this article were reported.

AUTHOR CONTRIBUTIONS

Conception or design: Y.J.P., S.W.C. Acquisition, analysis, or interpretation of data: Y.L., S.K.K., H.C., Y.H.K., S.K., K.C.J., J.K.W., D.J.P., Y.J.P., S.W.C. Drafting the work or revising: Y.L., Y.J.P., S.W.C. Final approval of the manuscript: Y.L., S.W.C.

ACKNOWLEDGMENTS

This research was supported by a grant from the Patient-Centered Clinical Research Coordinating Center funded by the Ministry of Health & Welfare, Republic of Korea (grant number: HI19C0481, HC19C0103) and the BK21FOUR Program of the National Research Foundation of Korea (NRF) funded by the Ministry of Education (5120200513755). The biospecimens and data used in this study were provided by the Biobank of Seoul National University Hospital, a member of the Korea Biobank Network.

REFERENCES

1. Vigneri R, Malandrino P, Vigneri P. The changing epidemiology of thyroid cancer: why is incidence increasing? Curr Opin Oncol. 2015; 27:1–7.
2. Ahn HS, Kim HJ, Welch HG. Korea’s thyroid-cancer “epidemic”: screening and overdiagnosis. N Engl J Med. 2014; 371:1765–7.
crossref
3. Park S, Oh CM, Cho H, Lee JY, Jung KW, Jun JK, et al. Association between screening and the thyroid cancer “epidemic” in South Korea: evidence from a nationwide study. BMJ. 2016; 355:i5745.
crossref
4. Davies L, Welch HG. Current thyroid cancer trends in the United States. JAMA Otolaryngol Head Neck Surg. 2014; 140:317–22.
crossref
5. Haugen BR, Alexander EK, Bible KC, Doherty GM, Mandel SJ, Nikiforov YE, et al. 2015 American Thyroid Association management guidelines for adult patients with thyroid nodules and differentiated thyroid cancer: the American Thyroid Association guidelines task force on thyroid nodules and differentiated thyroid cancer. Thyroid. 2016; 26:1–133.
crossref
6. Jeon MJ, Kim WG, Kim TY, Shong YK, Kim WB. Active surveillance as an effective management option for low-risk papillary thyroid microcarcinoma. Endocrinol Metab (Seoul). 2021; 36:717–24.
crossref
7. Loncar I, van Dijk SP, Metman MJ, Lin JF, Kruijff S, Peeters RP, et al. Active surveillance for papillary thyroid microcarcinoma in a population with restrictive diagnostic workup strategies. Thyroid. 2021; 31:1219–25.
crossref
8. Cho SJ, Suh CH, Baek JH, Chung SR, Choi YJ, Chung KW, et al. Active surveillance for small papillary thyroid cancer: a systematic review and meta-analysis. Thyroid. 2019; 29:1399–408.
crossref
9. Lee EK, Moon JH, Hwangbo Y, Ryu CH, Cho SW, Choi JY, et al. Progression of low-risk papillary thyroid microcarcinoma during active surveillance: interim analysis of a multicenter prospective cohort study of active surveillance on papillary thyroid microcarcinoma in Korea. Thyroid. 2022; 32:1328–36.
crossref
10. Gong Y, Li G, Lei J, You J, Jiang K, Li Z, et al. A favorable tumor size to define papillary thyroid microcarcinoma: an analysis of 1176 consecutive cases. Cancer Manag Res. 2018; 10:899–906.
crossref
11. Jeon MJ, Kim WG, Choi YM, Kwon H, Lee YM, Sung TY, et al. Features predictive of distant metastasis in papillary thyroid microcarcinomas. Thyroid. 2016; 26:161–8.
crossref
12. Wang X, Lei J, Wei T, Zhu J, Li Z. Clinicopathological characteristics and recurrence risk of papillary thyroid microcarcinoma in the elderly. Cancer Manag Res. 2019; 11:2371–7.
13. Yi KH. The revised 2016 Korean Thyroid Association guidelines for thyroid nodules and cancers: differences from the 2015 American Thyroid Association guidelines. Endocrinol Metab (Seoul). 2016; 31:373–8.
crossref
14. Kang S, Lee E, Chung CW, Jang HN, Moon JH, Shin Y, et al. A beneficial role of computer-aided diagnosis system for less experienced physicians in the diagnosis of thyroid nodule on ultrasound. Sci Rep. 2021; 11:20448.
crossref
15. Hahn SY, Shin JH, Oh YL, Son YI. Discrepancies between the ultrasonographic and gross pathological size of papillary thyroid carcinomas. Ultrasonography. 2016; 35:220–5.
crossref
16. Ito Y, Kudo T, Kihara M, Takamura Y, Kobayashi K, Miya A, et al. Prognosis of low-risk papillary thyroid carcinoma patients: its relationship with the size of primary tumors. Endocr J. 2012; 59:119–25.
crossref
17. Ito Y, Fukushima M, Kihara M, Takamura Y, Kobayashi K, Miya A, et al. Investigation of the prognosis of patients with papillary thyroid carcinoma by tumor size. Endocr J. 2012; 59:457–64.
crossref
18. Bachar G, Buda I, Cohen M, Hadar T, Hilly O, Schwartz N, et al. Size discrepancy between sonographic and pathological evaluation of solitary papillary thyroid carcinoma. Eur J Radiol. 2013; 82:1899–903.
crossref
19. Yoon YH, Kwon KR, Kwak SY, Ryu KA, Choi B, Kim JM, et al. Tumor size measured by preoperative ultrasonography and postoperative pathologic examination in papillary thyroid carcinoma: relative differences according to size, calcification and coexisting thyroiditis. Eur Arch Otorhinolaryngol. 2014; 271:1235–9.
crossref
20. Tuttle RM, Fagin JA, Minkowitz G, Wong RJ, Roman B, Patel S, et al. Natural history and tumor volume kinetics of papillary thyroid cancers during active surveillance. JAMA Otolaryngol Head Neck Surg. 2017; 143:1015–20.
crossref
21. Sanabria A. Experience with active surveillance of thyroid low-risk carcinoma in a developing country. Thyroid. 2020; 30:985–91.
crossref
22. Tuttle RM, Fagin J, Minkowitz G, Wong R, Roman B, Patel S, et al. Active surveillance of papillary thyroid cancer: frequency and time course of the six most common tumor volume kinetic patterns. Thyroid. 2022; 32:1337–45.
crossref
23. Gallo M, Pesenti M, Valcavi R. Ultrasound thyroid nodule measurements: the “gold standard” and its limitations in clinical decision making. Endocr Pract. 2003; 9:194–9.
crossref
24. Hegedus L. Thyroid size determined by ultrasound. Influence of physiological factors and non-thyroidal disease. Dan Med Bull. 1990; 37:249–63.
25. Knudsen N, Bols B, Bulow I, Jorgensen T, Perrild H, Ovesen L, et al. Validation of ultrasonography of the thyroid gland for epidemiological purposes. Thyroid. 1999; 9:1069–74.
crossref
26. Deveci MS, Deveci G, LiVolsi VA, Gupta PK, Baloch ZW. Concordance between thyroid nodule sizes measured by ultrasound and gross pathology examination: effect on patient management. Diagn Cytopathol. 2007; 35:579–83.
crossref
27. Baloch ZW, LiVolsi VA. Post fine-needle aspiration histologic alterations of thyroid revisited. Am J Clin Pathol. 1999; 112:311–6.
crossref
28. Pandit AA, Vaideeswar P, Mohite JD. Infarction of a thyroid nodule after fine needle aspiration biopsy. Acta Cytol. 1998; 42:1307–9.
29. Gordon DL, Flisak M, Fisher SG. Changes in thyroid nodule volume caused by fine-needle aspiration: a factor complicating the interpretation of the effect of thyrotropin suppression on nodule size. J Clin Endocrinol Metab. 1999; 84:4566–9.
crossref

Fig. 1.
Discrepancies of tumor size before and after surgery in papillary thyroid microcarcinoma. The difference between preoperative radiological and postoperative pathological tumor sizes is denoted as the “difference (D)” value. Agreement in tumor size was defined as a D value between –20% and 20%. D ≤–20% was categorized as a decrease in size, whereas D ≥20% were categorized as an increase in size. (A) Correlations between preoperative and postoperative tumor size. (B) Sankey diagram for differences in tumor size before and after surgery.
enm-2023-1872f1.tif
Fig. 2.
Representative cases of the discrepancy between tumor size before and after surgery. (A, B) The first case involves a 55-year-old woman with papillary thyroid microcarcinoma (PTMC). An ultrasonographic (USG) image of the right thyroid gland reveals an ill-defined, irregular-shaped lesion that was initially evaluated as two separate nodules. The nodules measured 0.75 cm (A) and 0.47 cm (B). However, after surgery, it was confirmed that these nodules were actually part of a single tumor with a size of 1.9 cm. (C) The second case involves a 56-year-old woman with PTMC. A thyroid USG image shows a nodule with dense rim calcification, measured at 0.67 cm. However, postsurgery examination revealed a pathologic papillary thyroid carcinoma measuring 1.3 cm.
enm-2023-1872f2.tif
Fig. 3.
Comparisons of survival outcomes based on tumor size and lymph node metastasis (LNM) in postoperative diagnosis. (A, B) Survival outcomes in relation to a tumor size of 1 cm based on the postoperative pathological measurement. Kaplan-Meier curves were utilized to analyze distant metastasis-free survival (A) and recurrence-free survival (B). (C, D) Survival outcomes between patients with LNM diagnosed both preoperatively and postoperatively (pre-post LNM), patients with LNM detected only at the time of postoperative evaluation (post-only LNM), and those without LNM detected postoperatively (no LNM). Kaplan-Meier curves were utilized to analyze distant metastasis-free survival (C) and recurrence-free survival (D). Post-T, postoperative tumor.
enm-2023-1872f3.tif
enm-2023-1872f4.tif
Table 1.
Baseline Clinicopathologic Characteristics and Clinical Outcomes of PTMC Patients Who Underwent Surgery
Characteristic Total Low-risk P value
Number of patients 939 (100) 738 (78.6)
At diagnosis
 Age, yr 51.0±12.2 51.2±11.9 0.826
 Male sex 194 (20.7) 146 (19.8) 0.657
 BMI, kg/m2 24.6±3.8 24.6±3.8 0.937
Preoperative radiologic findings
 Tumor size, cm 0.70±0.19 0.69±0.19 0.803
 Radiologic LNM 79 (8.4) 0 <0.00
Surgical procedure
 Total thyroidectomy 438 (46.6) 297 (40.2) 0.009
 Central neck dissection 838 (89.2) 641 (86.9) 0.133
 Lateral neck dissection 62 (6.6) 0 <0.001
Postoperative pathologic findings
 Tumor size, cm 0.72±0.25 0.71±0.25 0.459
 Multiplicity 311 (33.1) 236 (32.0) 0.620
 ETE
  Microscopic 441 (47.1) 327 (44.4) 0.263
  Gross 11 (1.2) 9 (1.2) 0.930
 LNM 331 (35.3) 211 (28.6) 0.009
  LN size, mm 2.5 (1.0–5.0) 1.9 (1.0–3.0) <0.001
  Ratio of LNM 0.25 (0.17–0.46) 0.29 (0.17–0.51) 0.176
BRAFV600E mutation 838 (90.8) 665 (91.5) 0.630
RAIT
 Number of patients 203 (21.6) 109 (14.8) <0.001
 Frequency of RAIT 1 (1–2) 1 (1–2) 0.250
 Total cumulative dose, mCi 60 (50–100) 50 (50–80) 0.037
 Complete ablation 201 (99.0) 109 (100.0) 0.544
 Abnormal uptakea 13 (6.4) 5 (4.6) 0.512
Outcome
 Distant metastasisb 4 (0.4) 1 (0.1) 0.392
 Recurrence/persistence 12 (1.3) 4 (0.5) 0.124

Values are expressed as number (%), mean±standard deviation, or median (interquartile range).

PTMC, papillary thyroid microcarcinoma; BMI, body mass index; LNM, lymph node metastasis; ETE, extrathyroidal extension; LN, lymph node; RAIT, radioactive iodine therapy.

a Patients who showed abnormal uptake in the subclavian lymph node (n=3), mediastinum (n=6), or a distant organ (n=4) including lung, bone, or liver after RAIT;

b Lung, liver, and bone metastasis were included, while cases of abnormal uptake of radioactive iodine in the subclavian lymph node and mediastinum were excluded.

Table 2.
Comparison of Tumors Showing Agreement and Disagreement between Preoperative Radiological and Postoperative Pathological Size Measurements according to Tumor Size on Radiology
Group Criteria Tumor size on radiology
Total P value
0–0.5 cm 0.5–1.0 cm
Agreement –20% to 20%a 77 (42.1) 484 (64.0) 561 (59.7) <0.001
Disagreement
 Decrease in size ≤–20% 33 (18.0) 117 (15.5) 150 (16.0) 0.034
 Increase in size ≥20% 73 (39.9) 155 (20.5) 228 (24.3)
Total 183 (19.5) 756 (80.5)

Values are expressed as number (%).

a Agreement in tumor size was defined as a difference (D value) between –20% and 20%.

Table 3.
Comparisons of Clinicopathological Characteristics and Clinical Outcomes according to the Postoperative Tumor Size
Characteristic Post-T size ≤1 cm Post-T size >1 cm P value
Number of patients 838 (89.2) 101 (10.8)
At diagnosis
 Age, yr 50.8±12.1 52.8±13.1 0.127
 Male sex 173 (20.6) 21 (20.8) 0.972
 BMI, kg/m2 24.5±3.7 25.8±4.5 0.001
Preoperative radiologic findings
 Tumor size, cm 0.67±0.18 0.93±0.10 <0.001
 Radiologic LNM 68 (8.1) 11 (10.9) 0.342
Surgical procedure
 Total thyroidectomy 373 (44.5) 65 (64.4) <0.001
 Central neck dissection 742 (88.5) 96 (95.0) 0.046
 Lateral neck dissection 52 (6.2) 10 (9.9) 0.158
Postoperative pathologic findings
 Tumor size, cm 0.66±0.19 1.20±0.17 <0.001
 Multiplicity 261 (31.1) 50 (49.5) <0.001
 ETE
  Microscopic 365 (43.7) 76 (75.2) <0.001
  Gross 8 (1.0) 3 (3.0) 0.105
 LNM 284 (38.4) 47 (49.0) 0.046
  LN size, mm 2.2 (1.0–5.0) 3.0 (1.3–5.5) 0.262
  Ratio of LNM 0.25 (0.17–0.50) 0.28 (0.17–0.38) 0.658
BRAFV600E mutation 748 (90.7) 90 (91.8) 0.705
RAIT
 Number of patients 161 (19.2) 42 (41.6) <0.001
 Frequency of RAIT 1 (1–2) 2 (1–2) 0.023
 Total cumulative dose, mCi 60 (50–100) 60 (50–80) 0.687
 Complete ablation 160 (99.4) 41 (97.6) 0.372
 Abnormal uptakea 9 (5.6) 4 (9.5) 0.476
Outcome
 Distant metastasisb 1 (0.1) 3 (3.0) 0.004
 Recurrence/persistence 9 (1.1) 3 (3.0) 0.130

Values are expressed as number (%), mean±standard deviation, or median (interquartile range).

Post-T, postoperative tumor; BMI, body mass index; LNM, lymph node metastasis; ETE, extrathyroidal extension; LN, lymph node; RAIT, radioactive iodine therapy.

a Patients who showed abnormal uptake in the subclavian lymph node (n=3), mediastinum (n=6), or a distant organ (n=4) including lung, bone, or liver after RAIT;

b Lung, liver, and bone metastasis were included, while cases of abnormal uptake of radioactive iodine in the subclavian lymph node and mediastinum were excluded.

Table 4.
Comparisons of Clinicopathological Characteristics and Clinical Outcomes according to the Preoperative and Postoperative LNM
Characteristic Pre-post LNM Post-only LNM P value
Number of patients 72 259
At diagnosis
 Age, yr 50.5±13.1 48.3±12.3 0.183
 Male sex 27 (37.5) 65 (25.1) 0.038
 BMI, kg/m2 24.5±3.5 24.4±3.5 0.891
Preoperative radiologic findings
 Tumor size, cm 0.71±0.20 0.71±0.19 0.819
 Radiologic LNM 72 (100.0) 0 <0.001
Surgical procedure
 Total thyroidectomy 68 (94.4) 180 (69.5) <0.001
 Central neck dissection 72 (100.0) 259 (100.0) NA
 Lateral neck dissection 54 (75.0) 5 (1.9) <0.001
Postoperative pathologic findings
 Tumor size, cm 0.77±0.25 0.75±0.25 0.661
 Multiplicity 31 (43.1) 102 (39.4) 0.574
 ETE
  Microscopic 47 (65.3) 158 (61.2) 0.532
  Gross 1 (1.4) 4 (1.5) 1.000
 LNM
  LN size, mm 8.0 (5.0–11.0) 2.0 (1.0–3.0) <0.001
  Micrometastasis 6 (8.3) 140 (56.7) <0.001
  Ratio of LNM 0.21 (0.15–0.35) 0.26 (0.17–0.50) 0.019
BRAFV600E mutation 64 (88.9) 239 (93.4) 0.207
RAIT
 Number of patients 58 (80.6) 119 (45.9) <0.001
 Frequency of RAIT 2 (1–2) 1 (1–2) 0.288
 Total cumulative dose, mCi 100 (57.5–100) 60 (50–80) <0.001
 Complete ablation 56 (96.6) 119 (100.0) 0.106
 Abnormal uptakea 7 (12.1) 6 (5.0) 0.124
Outcome
 Distant metastasisb 3 (4.2) 1 (0.4) 0.034
 Recurrence/persistence 5 (6.9) 4 (1.5) 0.026

Values are expressed as mean±standard deviation, number (%), or median (interquartile range).

LNM, lymph node metastasis; BMI, body mass index; NA, not available; ETE, extrathyroidal extension; LN, lymph node; RAIT, radioactive iodine therapy.

a Patients who showed abnormal uptake in the subclavian lymph node (n=3), mediastinum (n=6), or a distant organ (n=4) including lung, bone, or liver after RAIT;

b Lung, liver, and bone metastasis were included, while cases of abnormal uptake of radioactive iodine in the subclavian lymph node and mediastinum were excluded.

TOOLS
Similar articles