초록
방법
결과
Abstract
Background
Methods
Results
Conclusions
감사의 글
REFERENCES
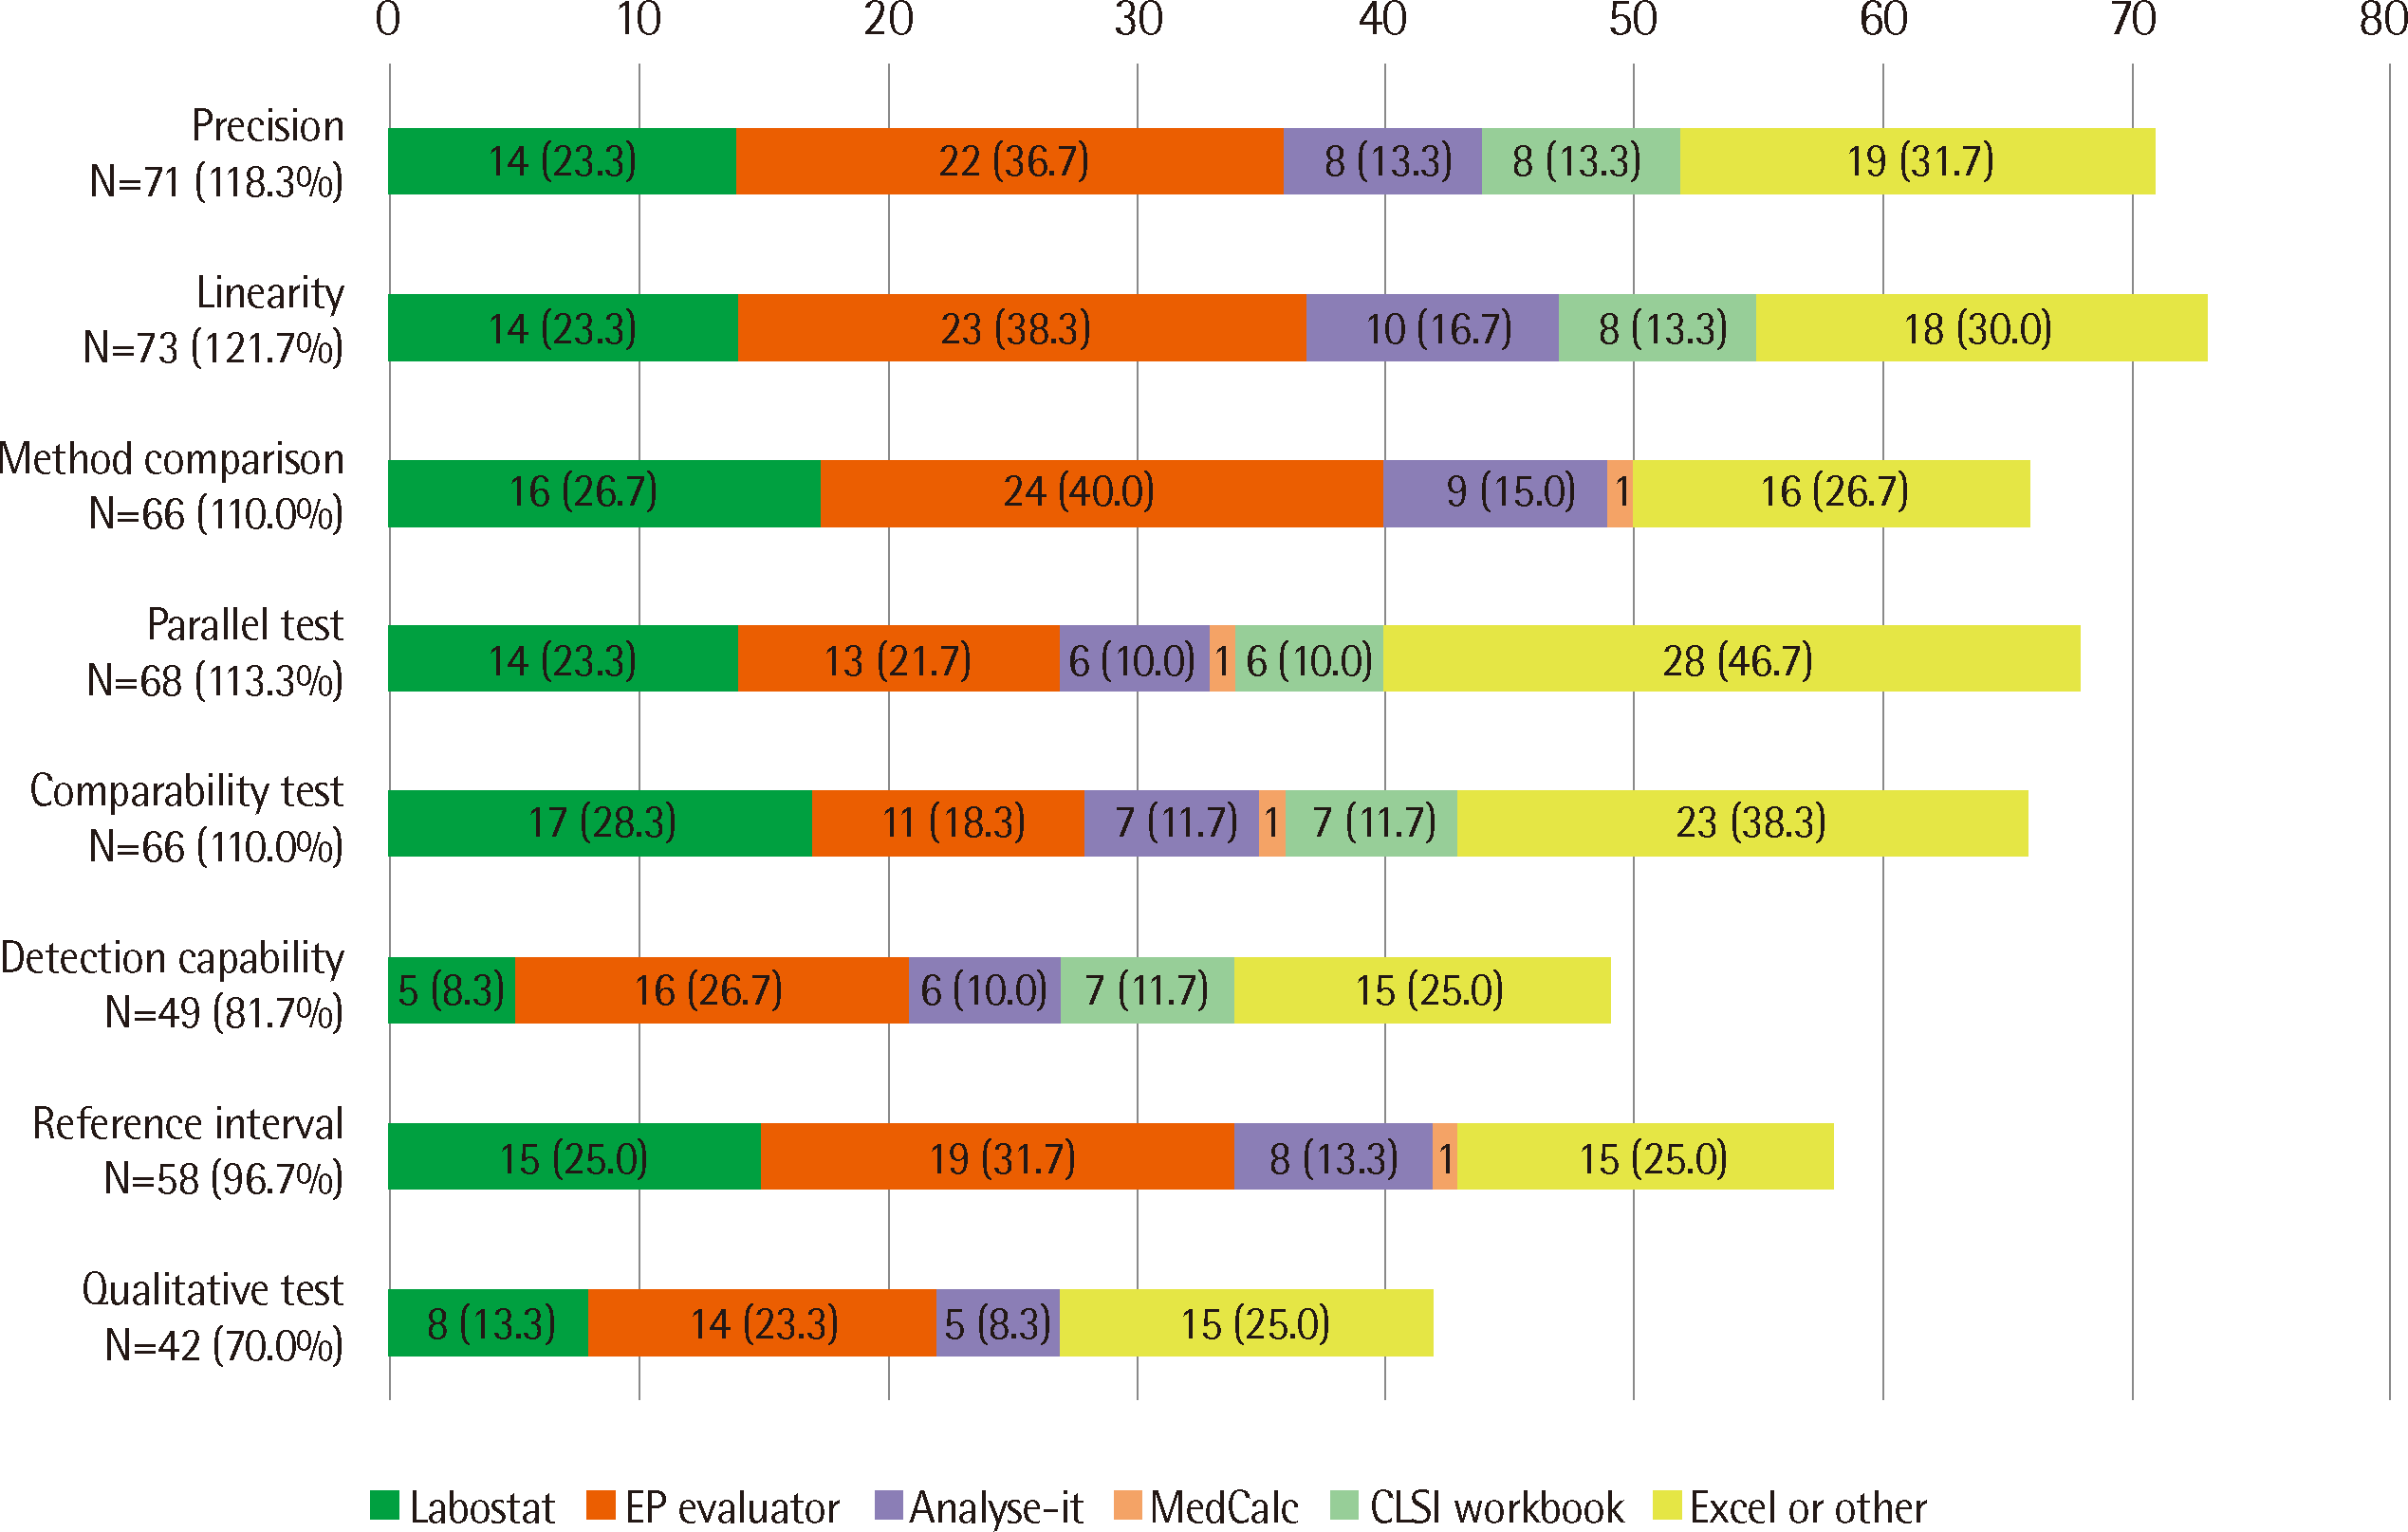
Fig. 1

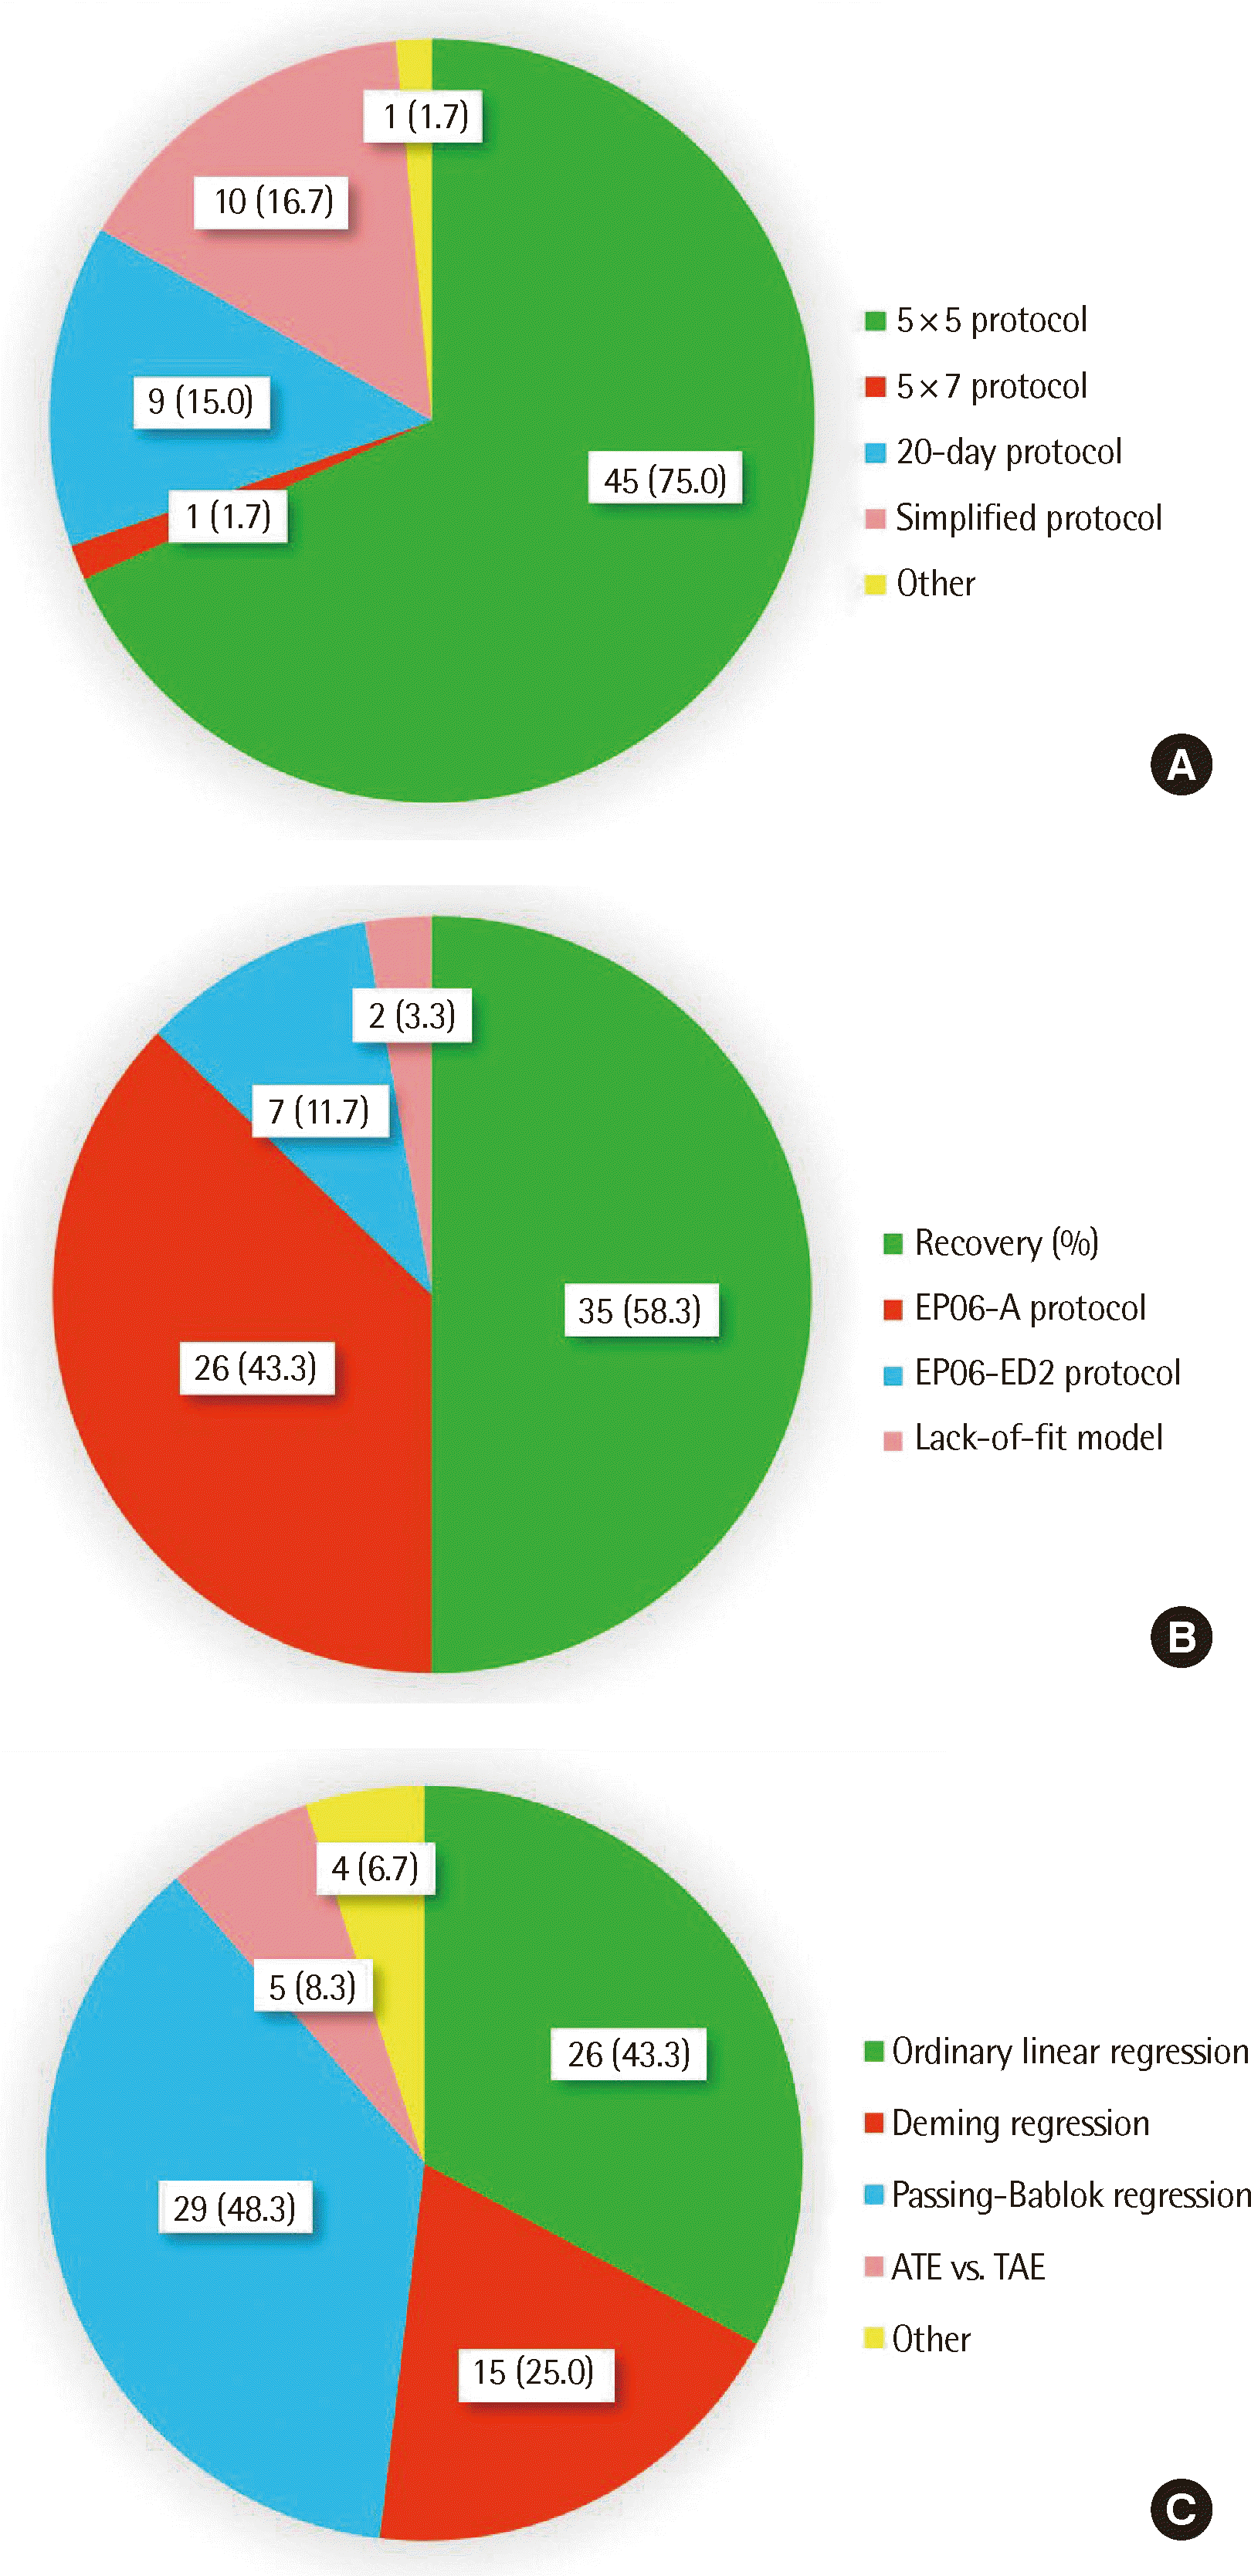
Fig. 2

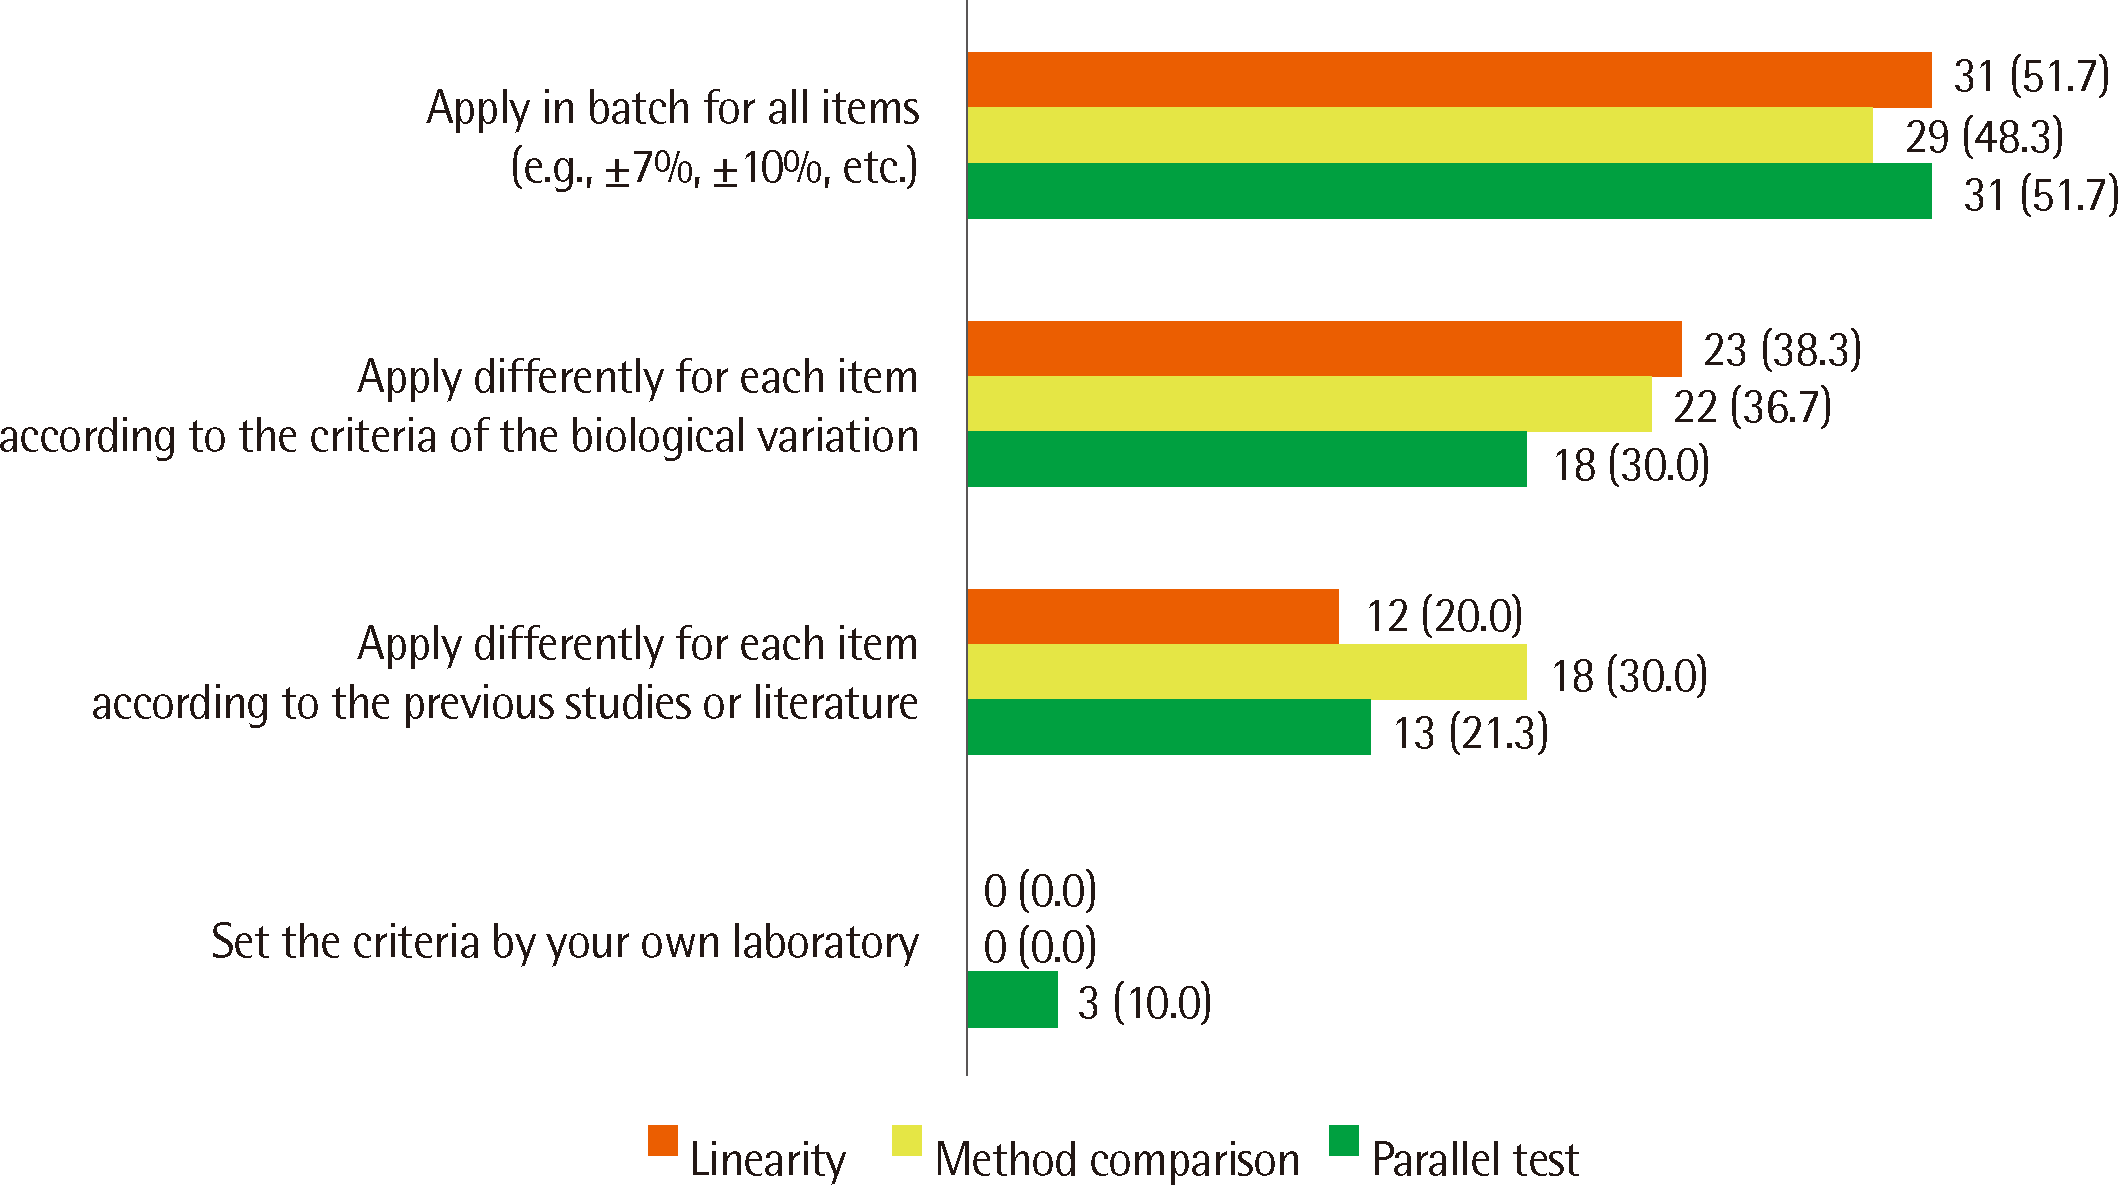
Fig. 3

Table 1
| Questions | Answer, N (%) |
|---|---|
| 1. Are you aware of the latest EP15-A3 guideline for the verification of precision? | |
| Yes | 57 (95.0) |
| No | 3 (5.0) |
| 2. Which protocol does your laboratory use for evaluating assay precision? | |
| 5×5 protocol (five replicates per run, with 1 run per day over 5 days, for a total of 25 replicates per level) | 45 (75.0) |
| 5×7 protocol (five replicates per run, with 1 run per day over 7 days, for a total of 35 replicates per level) | 1 (1.7) |
| 10-day protocol (each run in duplicate, with 2 runs per day over 10 days, for a total of 40 replicates per level) | 0 (0.0) |
| 20-day protocol (each run in duplicate, with 2 runs per day over 20 days, for a total of 80 replicates per level) | 9 (15.0) |
| Simplified protocol (each run in duplicate, with 2 runs per day over 5 days, for a total of 20 replicates per level) | 10 (16.7) |
| Other* | 1 (1.7) |
| 3. How many of the following materials are used for precision testing in your laboratory? | |
| QC material, 2 levels | 51 (85.0) |
| QC material, 3 levels | 19 (31.7) |
| Patient sample, 2 levels | 5 (8.3) |
| Patient sample, 3 levels | 1 (1.7) |
| 4. Is repeatability evaluated separately from precision testing in your laboratory? | |
| Yes, by 10 repeated measurements | 10 (16.7) |
| Yes, by 20 repeated measurements | 11 (18.3) |
| It is calculated from the data in the precision test, and repeatability is not evaluated separately. | 34 (56.7) |
| No, it is not calculated. | 5 (8.3) |
| 5. Which statistical program do you use for calculating repeatability and the between-run and total-laboratory imprecision? | |
| Labostat (Laboratory Medicine Foundation, Seoul, Korea) | 14 (23.3) |
| Analyse-it (Analyse-it Software, Ltd., Leeds, UK) | 9 (15.0) |
| SPSS Statistics (IBM Corporation, Chicago, IL, USA) | 1 (1.7) |
| Only CV% of the total measurement is used without calculating them. | 31 (51.7) |
| Other† | 5 (8.3) |
| 6. What actions are taken when outliers (or an outlier) occur(s) in the precision test? | |
| Use the Grubbs’ test and remove up to one measurement from the entire level | 5 (8.3) |
| Use the Grubbs’ test and remove up to two measurements from the entire level | 18 (30.0) |
| All measurements are used for precision assessment without evaluating the outlier(s) separately. | 33 (55.0) |
| Other‡ | 4 (6.7) |
| 7. Which of the following criteria do you use for precision evaluation? | |
| CV(%) values presented by the manufacturer | 41 (68.3) |
| CV(%) values in previous studies or the literature | 16 (26.7) |
| CV(%) values set by your own laboratory | 19 (31.7) |
| 8. How do you decide if the CV(%) value calculated from the precision test exceeds the criteria in your laboratory? | |
| If the CV(%) value falls within the UVL expanded in accordance with EP15-A3, it is judged as accepted. | 21 (35.0) |
| If the χ2-square value is less than the verification value at the corresponding degree of freedom, it is judged as accepted. | 4 (6.7) |
| Judged as unaccepted without an additional verification process | 24 (40.0) |
| No separate process in place | 7 (11.7) |
| Other§ | 4 (6.7) |
Some participants provided multiple answers to one question. The bolded questions are those in which the sum of the percentage exceeds 100%.
*Each run in duplicate, with a single run per day over 20 days, for a total of 40 replicates per sample; †EP Evaluator (Data Innovations, Colchester, VT, USA) or Microsoft Excel (Microsoft Corporation, Redmond, WA, USA); ‡No limit to the number of removed outliers, Tukey’s test, or reevaluation; §Judged by resetting of the criteria, reevaluation after reexamination, or reevaluation by increasing the number of measurements.
Table 2
| Questions | Answer, N (%) |
|---|---|
| 1. Are you aware of the latest EP06-ED2 guideline for linearity evaluation? | |
| Yes | 52 (86.7) |
| No | 8 (13.3) |
| 2. Which protocol does your laboratory use for evaluating the linearity of an assay? | |
| Lack-of-fit model for the linear fit | 2 (3.3) |
| Recovery (%) between expected and measured values | 35 (58.3) |
| Comparison of the best polynomial fit and linear fit (EP06-A protocol) | 26 (43.3) |
| Determination of whether the weighted deviation falls within the allowable deviation from linearity (EP06-ED2 protocol) | 7 (11.7) |
| 3. How many of the following materials are used for the linearity test in your laboratory? | |
| Material provided by the manufacturer, 5 levels | 58 (96.7) |
| Material provided by the manufacturer, 6 or 7 levels | 2 (3.3) |
| Patient sample, 5 levels | 22 (36.7) |
| Patient sample, 6 or 7 levels | 4 (6.7) |
| Calibrator | 2 (3.3) |
| 4. Which of the following criteria do you use for linearity testing? | |
| Apply in batches for all items (e.g., ±7%, ±10%, etc.) | 31 (51.7) |
| Apply differently for each item according to the criteria of the biological variation | 23 (38.3) |
| Apply differently for each item according to previous studies or the literature | 12 (20.0) |
| 5. If one level does not satisfy the acceptance criteria, how do you judge and manage it? | |
| If the level is other than the lowest level, one or two more levels are tested, and the linearity is reevaluated after the removal of existing outliers. | 22 (36.7) |
| Regardless of which level it is, one or two more levels are tested, and the linearity is reevaluated after the removal of existing outliers. | 6 (10.0) |
| If the level is other than the lowest level, the linearity test is reevaluated after reexamination or using other materials. | 15 (25.0) |
| Regardless of which level it is, the linearity test is reevaluated after reexamination or using other materials. | 17 (28.3) |
| 6. Which of the following criteria do you use for evaluating the linearity at the lowest concentration level? | |
| If the lowest level does not satisfy the criteria but the other levels do, linearity is judged as acceptable across all levels. | 21 (35.0) |
| Apply the expanded criteria only for the lowest level | 15 (25.0) |
| Apply the absolute value, other than %deviation, for the lowest level only | 21 (35.0) |
| Other* | 3 (5.0) |
| 7. Are you aware of the latest EP34-ED1 guideline for verifying the dilution factor? | |
| Yes | 46 (76.7) |
| No | 14 (23.3) |
| 8. Which of the following protocols does your laboratory use to verify the maximum dilution factor? | |
| Evaluate whether the recovery (%) values are within the criteria after measuring several (e.g., 3–5) samples near the upper limit of the AMI | 15 (25.0) |
| Ev aluate whether the recovery (%) values and 97.5 percentile upper and 2.5 percentile lower limits are within the criteria after measuring several (e.g., 3–5) samples (neat and diluted samples) | 13 (21.7) |
| Apply the dilution factor presented by the manufacturer without verifying it | 32 (53.3) |
Table 3
| Questions | Answer, N (%) |
|---|---|
| 1. Which of the following protocols does your laboratory mainly use for method comparison in the process of new laboratory test implementation? | |
| Ordinary linear regression | 26 (43.3) |
| Deming regression | 15 (25.0) |
| Weighted Deming regression | 0 (0.0) |
| Passing–Bablok regression | 29 (48.3) |
| ATE vs. TAE | 5 (8.3) |
| Other* | 4 (6.7) |
| 2. Which of the following criteria do you use for judging the results from the method comparison evaluation in the process of new laboratory test implementation? | |
| Accept if the 95% CI of the slope contains the value 1 and the 95% CI of the intercept contains the value 0 | 25 (41.7) |
| Accept if the %difference between the MDL and the value obtained by substituting the MDL for the x value of the regression equation is less than the targeted %bias | 14 (23.3) |
| Accept if the 95% CI of the value obtained by substituting the MDL for the x value of the regression equation contains the MDL value | 10 (16.7) |
| Accept if ATE/TAE ≥1 | 1 (1.7) |
| Accept if both R2 >0.95 and %difference <10% are satisfied | 13 (21.7) |
| Other† | 8 (13.3) |
| 3. How do you apply the acceptance criteria for evaluating method comparison test results? | |
| Apply in batches for all items (e.g., ±7%, ±10%, etc.) | 29 (48.3) |
| Apply differently for each item according to the criteria of the biological variation | 22 (36.7) |
| Apply differently for each item according to previous studies or the literature | 18 (30.0) |
| 4. How many patient samples do you use for method comparison testing in your laboratory? | |
| 10 samples | 1 (1.7) |
| 20 samples | 20 (33.3) |
| 40 samples | 39 (65.0) |
| 120 samples | 4 (6.7) |
| Other‡ | 5 (8.3) |
| 5. Which of the following protocols does your laboratory use for parallel testing when the reagent lot number is changed? | |
| Evaluate %bias obtained by measuring 2–5 patient samples using both old and new lots | 41 (68.3) |
| Evaluate %bias obtained by measuring 6–10 patient samples using both old and new lots | 10 (16.7) |
| Evaluate %bias obtained by measuring 11–20 patient samples using both old and new lots | 6 (10.0) |
| Evaluate after calculating the required number of samples using CD and SWRL (EP26-A protocol) | 9 (15.0) |
| Other§ | 4 (6.7) |
| 6. Which of the following criteria do you use for evaluating parallel test results when the reagent lot number is changed? | |
| Apply in batches for all items (e.g., ±7%, ±10%, etc.) | 31 (51.7) |
| Apply differently for each item according to the criteria of the biological variation | 18 (30.0) |
| Apply differently for each item according to previous studies or the literature | 13 (21.7) |
| Set the criteria by your own laboratory | 3 (5.0) |
| 7. If your laboratory evaluates parallel test results using a CD, what CD fold value is the rejection limit set at? | |
| 0.6 fold | 1 (1.7) |
| 0.7 fold (the criterion set in the Labostat program) | 6 (10.0) |
| 0.8 fold | 1 (1.7) |
| 0.9 fold | 0 (0.0) |
| 1 fold | 1 (1.7) |
| Evaluate only by %difference without using a CD | 51 (85.0) |
| 8. If your laboratory uses two or more analyzers for the same item, how do you conduct a regular comparative evaluation between the analyzers? | |
| Evaluate within one day using the same method and the same number of samples and compare with the case of evaluating the newly introduced method or assay | 24 (40.0) |
| Ev aluate using the data accumulated over several days by measuring one or a small number of samples per day and analyze using the same method and compare with the case of evaluating the newly introduced method or assay | 35 (58.3) |
| Evaluate using the pooled CV(%) and CD after replicating the appropriate number of measurements using two patient samples (C54-A protocol) | 3 (5.0) |
| Ev aluate after obtaining the appropriate number of runs and replicates per run considering CD/SDtotal and SDrepeatability/SDtotal using one patient sample (EP31-A-IR protocol) | 0 (0.0) |
| Evaluate using QC materials | 4 (6.7) |
Some participants provided multiple answers to one question. The bolded questions are those in which the sum of the percentage exceeds 100%.
*Bland–Altman plot, or may vary by the items; †Evaluate whether the absolute difference and standard deviation are within the ATE, or may vary by the items; ‡50 samples, or may vary by the items; §Evaluate using both QC materials and patient samples, or may vary by the items.
Abbreviations: ATE, allowable total error; TAE, total analytical error; CI, confidence interval; MDL, medical decision level; CD, critical difference; SD, standard deviation; SWRL, within-laboratory standard deviation; CV, coefficient of variation; SDtotal, total standard deviation; SDrepeatability, repeatability standard deviation; QC, quality control.
Table 4
| Questions | Answer, N (%) |
|---|---|
| 1. Which of the following reporting methods does your laboratory use for the value that is higher than LoB but lower than LoQ? | |
| Less than LoQ (e.g., <10 mmol/L) | 53 (88.3) |
| Detected, but less than LoQ (e.g., Detected, <10 mmol/L) | 5 (8.3) |
| Report as the lower limit of the AMI | 2 (3.3) |
| 2. Does your laboratory validate (or verify) the LoB, LoD, and LoQ directly for the newly introduced method or assay? | |
| Yes | 7 (11.7) |
| Only some items, such as WBC and RBC, are validated. | 18 (30.0) |
| No | 35 (58.3) |
| 3. When validating (or verifying) the LoQ, for which of the following do you set the minimal value that starts to fall within the target? | |
| Total error (%) | 9 (15.0) |
| Coefficient of variation (%) | 16 (26.7) |
| No attempt to validate (or verify) the LoQ | 35 (58.3) |
| 4. Which of the following formulas does your laboratory use for evaluating the carryover? | |
| 49 (81.7) | |
| 17 (28.3) | |
| 5. How many patient samples does your laboratory use to validate the reference interval? | |
| 120 samples (90% CI) | 17 (28.3) |
| 153 samples (95% CI) | 0 (0.0) |
| 198 samples (99% CI) | 1 (1.7) |
| Apply the reference interval presented by the manufacturer after evaluating 20 patient samples | 60 (100.0) |
| 6. How many of the following materials do you use for qualitative testing in your laboratory? | |
| Materials provided by the manufacturer / C50–20%, C50, C50+20% | 22 (36.7) |
| Materials provided by the manufacturer / C50–20%, C50+20% | 19 (31.7) |
| Patient samples / C50–20%, C50, C50+20% | 14 (23.3) |
| Patient samples / C50–20%, C50+20% | 11 (18.3) |
| Other* | 2 (3.3) |
| 7. How many samples per level does your laboratory use to evaluate the performance of the qualitative test? | |
| 1 sample | 1 (1.7) |
| 2 or 3 samples | 22 (36.7) |
| 5 samples | 16 (26.7) |
| 10 samples | 9 (15.0) |
| 20 samples | 8 (13.3) |
| 40 samples | 2 (3.3) |
| No attempt to evaluate the performance of the qualitative test | 2 (3.3) |
| 8. If one level shows an unacceptable result, how do you judge and manage it? | |
| Reevaluate using C50–30% or C50+30% samples | 16 (26.7) |
| Reevaluate using C50–50% or C50+50% samples | 5 (8.3) |
| Evaluate by adding as many samples as initially evaluated. (The final number of samples is twice that of the initial evaluation.) | 24 (40.0) |
| Evaluate 40 samples by adding the number of samples | 7 (11.7) |
| Evaluate one or two additional samples per level | 6 (10.0) |
| No attempt to evaluate the performance of the qualitative test | 2 (3.3) |
Some participants provided multiple answers to one question. The bolded questions are those in which the sum of the percentage exceeds 100%.
Abbreviations: LoB, limit of blank; LoQ, limit of quantitation; AMI, analytical measuring interval; WBC, white blood cell; RBC, red blood cell; L1–L4, measured values of the low-level sample; H1–H4, measured values of the high-level sample; CI, confidence interval; C50, analyte concentration near the cutoff that yields 50% positive and 50% negative results; C50±20%, ±20% of the C50 concentration.


 PDF
PDF Citation
 Print
Print


 XML Download