Journal List > Lab Med Online > v.14(3) > 1516087638

직선구간과 확장측정구간의 평가 및 설정

초록

직선성은 검사법의 성능 특성을 평가하는 주요 요소 중 하나로 신규 측정절차의 도입 시는 물론 그 이후에도 정기적으로 평가가 이루어져야 한다. 희석 배수의 검증 및 검정은 측정가능구간(AMI)을 이용하여 확장측정구간(EMI)을 확장하여 보고가능구간(RI)을 설정하는 데 필요한 절차이다. 비록 직선성과 희석배수를 위한 최신 지침인 CLSI EP06, EP34가 나와 있지만, 많은 검사실에서는 이를 실제로 적용하지 못하는 경우가 많다. 이에 본 종설은 직선구간 및 확장측정구간의 설정을 위한 직선성과 희석배수의 검증 및 검정 과정에 대해 기본 개념 및 실무적 측면에서 전반적이며 포괄적으로 서술하여 국내 진단검사의학과 전문의, 전공의, 임상병리사 및 관련 업계 종사자들에게 실질적인 도움이 되고자 한다. 본 종설은 직선성 평가에 대한 개념 및 역사, 직선 구간의 검증 및 검정, AMI, EMI, RI의 개념, 희석배수의 설정, EMI의 검증 및 검증을 다루었다. 본 종설은 국내 임상 검사실 및 관련 업계에서 직선성 및 희석배수에 대한 이해를 넓히고 보다 쉽고 효과적으로 이를 평가함으로써 국내의 진단검사 품질을 향상시키는 데에 기여할 것으로 기대된다.

Abstract

Linearity is one of the major factors in evaluating the performance characteristics of laboratory methods and should be evaluated regularly at the time of introducing a new measurement procedure and as an ongoing process. The validation and verification of the dilution factor are necessary procedures to establish reportable intervals (RIs) through the expansion of extended measuring intervals (EMIs) using analytical measuring intervals (AMIs). Although up-to-date guidelines for linearity and the dilution factor exist, such as the Clinical Laboratory Standards Institute (CLSI) EP06 and EP34, these have not yet been applied to many clinical laboratories in Korea. Therefore, this review article aims to provide practical assistance to clinical pathologist, residents, clinical laboratory technologists, and related industry workers, in Korea, by describing the overall and comprehensive processes of linearity and the dilution factor with regard to basic concepts and practical aspects. This review details the concept and history of linearity evaluation, validation and verification of the linearity interval, concepts of AMI, EMI, and RI, the establishment of the dilution factor, and validation and verification of EMI. This article is expected to contribute to improving the quality of diagnostic tests in Korea by enhancing the understanding of linearity and the dilution factor across clinical laboratories and related industries, thus facilitating easier and more effective evaluation.

서 론

직선성(linearity)은 신규 검사법 도입 평가 시에는 물론 도입 이후에도 정기적으로 평가해야 하는 주요 평가 요소이다. International Standard Organization (ISO) 17025를 비롯한 국내외 각종 지침에서는 정량적 측정절차(quantitative measurement procedure)의 초기 도입 시 필수적으로 검증(validation) 및 검정(verification)해야 할 항목 중 하나로 직선성을 포함하고 있다[1-4]. 또한 진단검사의학재단 우수검사실 신임인증 평가 문항에서도 3가지 이상의 6338농도 물질을 이용하여 연 2회 직선성 평가를 시행할 것을 필수 항목으로 하고 있다[5]. 직선성 평가는 비단 체외진단의료기기 인·허가 과정에서 필수 평가 항목일 뿐만 아니라, 이를 통해 해당 검사법의 문제점을 조기에 발견할 수 있고 또한 측정가능구간(analytical measuring interval, AMI)을 명확히 설정할 수 있다[6-9].
직선성에 대한 지침으로는 1986년 10월 발간된 National Committee for Clinical Laboratory Standards (NCCLS)의 EP06-P [10]가 첫 지침이다. 이어서 Clinical Laboratory Standards Institute (CLSI)에서 2003년 4월에 EP06-A [11]를, 가장 최근에는 2020년 11월에 EP06-ED2 [12]를 출간하였다. 국내에서는 대한진단검사의학회에서 EP06-A의 한글 편역본[13]을 2013년에, EP06-ED2의 편역본[14]을 2022년에 각각 출간하였다. 검사법 평가에 대한 필수 요소로서의 직선성에 대한 교육은 국내에서도 각종 학회 및 별도 워크숍을 통해 이루어져 왔으나 진단검사의학 교과서에는 반영이 되지 않고 있다가 2021년에 개정된 진단검사의학 제6판[15]과 첫 출판된 진단검사의학 실무핸드북 제1판[16]에 처음 반영되었다. 다만, 교과서의 집필 당시에는 EP06-ED2가 출간되지 않았던 관계로 해당 교과서에는 EP06-A 내용 위주로 서술되어 있으며, 따라서 다음번 개정 교과서에는 EP06-ED2의 내용이 반영될 예정이다.
한편으로, 측정가능범위를 넘어서는 결과값을 보이는 검체에 대해서는 희석을 통해 보고가능구간(reportable interval, RI)을 확장할 수 있는데, ISO 15189에서는 보고가능범위 역시 필수적으로 검증 및 검정되어야 할 요소로 명시하고 있는데[17], 희석배수의 평가는 직선성의 평가와는 엄연히 다름에도 불구하고[18] 2018년 CLSI EP34-ED1 [19]의 출간 이전에는 별도의 정립된 지침이 존재하지 않았다. 희석배수의 평가 역시 한글 번역본이 2019년 출간되었고[20], 2021년 출간된 국내 교과서 및 핸드북에도 해당 내용이 반영되어 있다[15, 16].
그러나 검사법 평가에 대한 국내의 한 설문조사에 따르면[21], 응답 기관 중 82.7%에서 EP06-ED2에 대해 안다고 응답하였으나, 실제로 이 지침을 사용하는 기관은 11.7%에 불과하였고, 이전 지침인 EP06-A를 사용하는 경우가 43.3%, 심지어 기대치(expected value)와 실측치(measured value) 간의 %회수율(recovery)을 사용하는 경우가 58.3%에 달하였다. 희석배수 역시 마찬가지였는데, 응답 기관 중 76.7%에서 EP34-ED1을 안다고 응답하였으나 실제로 이 지침을 적용하는 기관은 21.7%에 불과하였고, 제조사에서 제시하는 희석배수를 별도의 검정 없이 그대로 사용한다고 응답한 경우가 53.3%에 달하였다.
이에 본 종설에서는 직선구간 및 확장측정구간의 설정을 위한 직선성과 희석배수의 검증 및 검정 과정에 대해 기본 개념 및 실무적 측면에서 서술함으로서 국내 진단검사의학과 전문의, 전공의, 임상병리사 및 관련 업계 종사자들에게 실질적인 도움을 주고자 한다.

직선성의 평가 및 설정

1. 직선성의 기본 개념

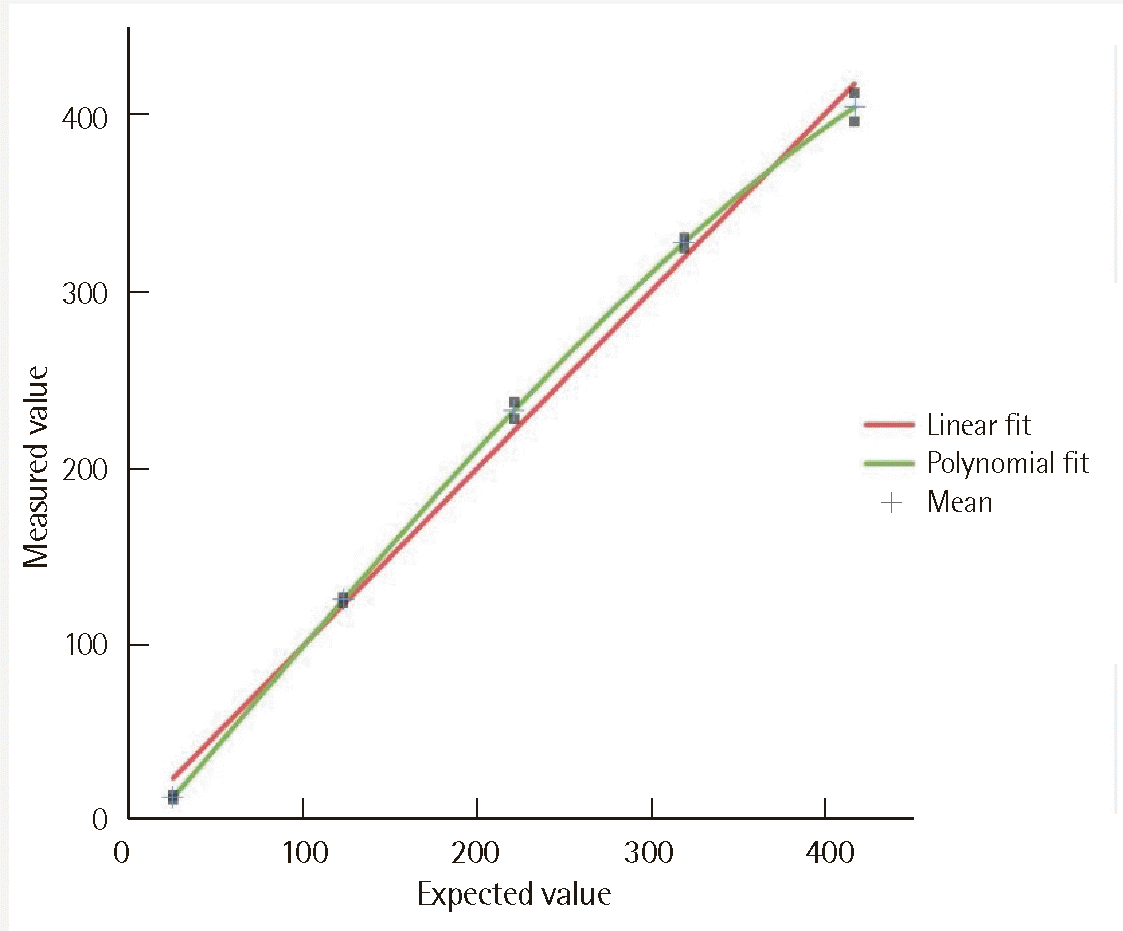
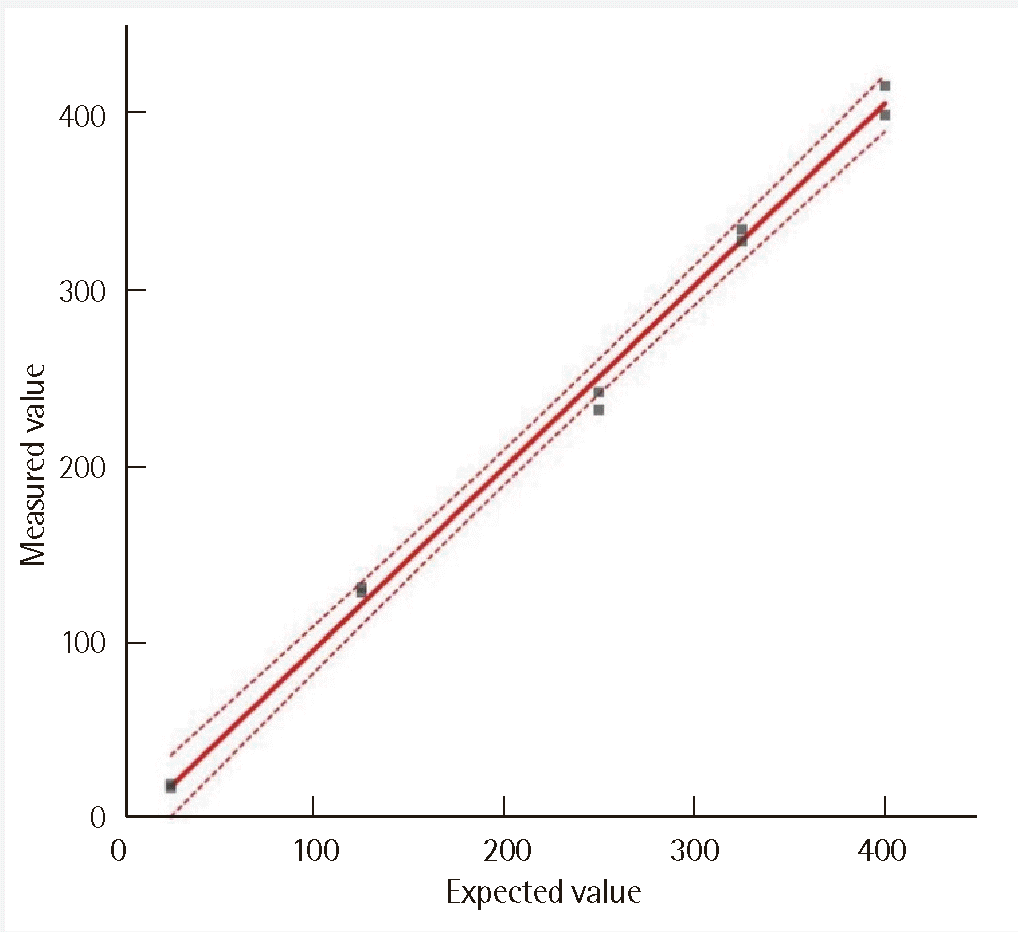
직선성은 CLSI 지침[11, 12] 및 진단검사의학 용어집[22]에서는 ‘주어진 구간 내에서 분석물질의 농도(또는 양)에 정비례하는 결과를 낼 수 있는 능력’으로, 진단검사의학 교과서에서는 ‘검사 시스템의 측정범위 전반에서 실제 측정값과 계산된 기댓값 사이의 관계’ [15]로 정의하고 있다. 여기서 직선성의 평가는 검사장비의 원래 출력값이 아니라 검사정보시스템에 최종 보고하는 분석값을 의미하고, 농도단위(예, nmol/L, ng/dL, μIU/mL)로 뿐만 아니라 효소 활성, 혈구 계수 등 정량값으로 보고되는 거의 모든 경우에 적용 가능하다. 다만 정성(qualitative) 및 반정량(semi-quantitative) 검사, 시간으로 표기되는 일부 혈액응고검사, 혹은 비(ratio)로서 표현되는 일부 자가 항체 검사 등의 검사에는 적용할 수 없다[12]. 직선성은 정확도(accuracy)와 일부 관련이 있다고 할 수 있는데, 이는 직선성 자체가 내부 또는 상대적인 정확도의 한 형태로 간주되기 때문이다[23, 24]. 직선성 평가를 위해 일선 검사실에는 CLSI 지침 이외에도 %회수율 평가를 많이 사용하고 있는데[21], %회수율=(측정치 평균/이론적 기대치)×100으로 간단히 구할 수 있으나[9], 데이터가 직선이 아닌 포물선 혹은 S자 커브(curve)를 보이는 경우에는 적용할 수가 없고[7], 검사의 비정밀도(imprecision)을 반영하지 못한다는 한계가 있다[4]. Fig. 1A와 같이 기대치와 측정치 모두가 직선 궤적을 보이면서 2회 반복측정한 측정치들의 비정밀도가 낮을 경우에는 %회수율로도 충분히 평가 가능하나, Fig. 1B와 같이 직선 궤적을 보이지 않으나 측정치가 기대치와 근접하여 %회수율은 우수한 경우 적합(acceptable) 판정을 부적절하게 내릴 수 있고, 혹은 Fig. 1C와 같이 측정치의 비정밀도가 우수하지 않으나 측정치 평균이 기대치에 근접한 경우에도 적합 판정을 부적절하게 내릴 수 있다.

2. 직선성 평가법의 변천 과정

서론에서 밝혔듯이 직선성에 대한 첫 지침은 1986년 출간된 NCCLS의 EP06-P [10]이다. 해당 지침에서는 등간격의 5개 검체를 각각 4회씩 반복 측정한 평균 결과로 최적화 회귀직선(best-fit linear regression line)을 구하고, 이로부터의 분산(variance)과 반복정밀도(repeatability)를 반영한 적합성 결여 검정(lack-of-fit test)을 통해 직선성 여부를 평가하였다. 그러나 이러한 방법은 반복정밀도가 매우 우수한 검사법에서 측정치들의 약간의 차이로 인해 실제로는 임상적으로 별 문제가 없는 차이임에도 불구하고 실패 판정을 부적절하게 내릴 위험성을 내포하고 있고[25], 측정 결과가 등분산성을 보이지 않는 경우에는 적용할 수 없다[26]. 또한 반복정밀도가 좋지 못한 검사법의 비선형성(non-linearity)을 식별하지 못할 위험이 있고, 직선이 아닌 용량-반응 관계를 보이는 검사법에 적용할 수 없고, 실제 직선성이 아닌 통계적 특성에만 의존한다는 한계가 있었다[23].
이러한 한계를 보완하기 위해, 2003년 출간된 CLSI의 EP06-A [11]에서는 데이터를 1차 다항식(직선식)뿐만 아니라 2차 및 3차 다항식에도 적합화하도록 하였다. 해당 지침에 따른 직선성 평가는 Analyse-it (Analyse-it Software, Ltd., Leeds, UK), EP Evaluator (Data Innovations, Colchester, VT, USA) 등의 유료 통계 소프트웨어(Software)는 물론, 진단검사의학재단에서 개발한 Labostat (Laboratory Medicine Foundation, Seoul, Korea)에서도 구현할 수 있다[27]. Supplementary Fig. 1에 EP06-A 지침에 의거한 직선성 평가 방법을 Labostat 프로그램을 예로 들어 설명하였다. 해당 지침은 자유도(degree of freedom) 및 이에 대한 t-검정 결과를 바탕으로 최적화 다항회귀식(best-fit polynomial regression line)을 구하고 이를 바탕으로 직선성을 판정하는 방식으로, 데이터가 직선이 아닌 포물선 혹은 S자 커브를 보이는 경우에도 적용 가능하다는 장점이 있으나[7] 복잡한 계산을 요구하고 각 개별 측정치들의 비정밀도를 반영하지 못한다는 한계가 있었다[12]. 또한, 해당 방법은 최적화 다항회귀식과 직선 회귀식 사이의 차이를 이용하여 각 검체에서의 비선형성을 구하고 그 비선형성이 임상적으로 허용가능한 차이(clinically acceptable bias)를 보이는지를 평가하였는데[28], 이는 오류(error)의 정도를 정량화하여 평가할 수 있다는 장점이 있으나[29], 허용 기준에 따라 제 1형 오류(type I error)에 빠질 우려가 있었다[30].
이에 2020년 출간된 CLSI EP06-ED2 [12]에서는 다시 직선 회귀식만을 적용하는 것으로 변경되었으며 2차 및 3차 다항식 계산을 삭제하였는데, 다만 가중치(weight)를 부여한 1차 직선식이다. 데이터 간의 표준편차(standard deviation)는 일정할 경우보다 수치의 증가에 따라 비례적으로 증가할 경우가 많기에[31] 가중치를 부여한 분석을 채택한 것이다. 또한 EP06-A에서 빠졌던 반복정밀도를 다시 반영하였는데 EP6-P와는 달리 실제 직선성 계산에 반영하지는 않고, 검증 과정에서 반복측정횟수의 선정 및 검정 과정에서 검체의 농도 범위 선정에서의 참고사항으로 반영하였다. EP06-ED2는 EP06-A에 비해 검사실에서의 평가 부담을 줄이고 효율적인 직선성 평가를 할 수 있도록 개정된 지침이다[32]. Table 1에 EP06-A와 비교하여 EP06-ED2에서 변경된 사항을 비교 및 요약하였다.

3. 직선성 관련 용어 정의

직선성 관련 용어 정의는 EP06-ED2의 편역본[14]을 따른다.
직선구간(linearity interval, LI): 적합화 직선을 통해 측정치의 직선성이 확립된 구간으로, 측정가능구간과 같거나 이에 속할 수 있음(직선구간⊂측정가능구간).
직선성으로부터 허용 가능한 편차(allowable deviation from linearity, ADL): 검사의 수행능 및 임상적 요소를 고려하여 적합화 직선으로부터 허용 가능한 최대 편차로, 총 허용오차(allowable total error)의 1/2 이하이어야 함.
다음은 검증과 검정에 대한 정의로서 비단 직선성뿐만 아니라, 진단검사의학 전반에 해당하는 개념이다.
검증(檢證, validation): 측정시스템의 명시된 요구 사항이 사용 목적에 적합한지를 평가하는 것으로[33], 제조사가 측정시스템의 분석적, 임상적 성능 특성을 설정(establishment) 및 확정(confirmation)하는 과정임[34].
검정(檢定, verification): 측정시스템의 목표 성능 특성이나 법적 요구사항이 달성되었는지를 평가하는 것으로[33], 최종 사용자(end-user)인 검사실에서 측정시스템의 수행능 특성이 제조사 설정 목표(claim)를 충족하는지를 확인하는 과정임[34].

4. 직선성 평가의 기본 고려사항

직선성 평가용 검체는 통상적인 검사에 사용하는 환자 검체와 최대한 유사해야 하고 간섭물질(interferent)에 유의한 영향을 받지 말아야 하며 기질(matrix) 효과를 고려해야 한다. 수용 가능한 검체의 유형은 다음과 같다: 1) 환자 검체 풀(patient sample pool); 2) 권장 희석액으로 희석한 고농도 검체; 3) 측정물질을 보충(supplement)하여 만든 고농도 검체; 4) 상품화된 정도관리(quality control) 물질, 보정물질(calibrator), 직선성 물질 등. 그리고 권장 희석액 이외의 희석액으로 희석한 환자 검체 풀, 과소 또는 과다희석된 정도관리물질은 사용은 가능하나 기질 차이가 결과에 영향을 미칠 수 있기에 사용을 최소한으로 하고 사용 시 문서화해야 한다. 이외 검체 관련사항은 EP06-A [11] 및 EP06-ED2 [12]를 참고바란다. 직선성 패널(panel) 검체를 제조하기 위해 이전에는 저농도와 고농도 물질의 비례적 혼합(예: 저농도(L), 0.75 L+0.25 H, 0.5 L+0.5 H, 0.25 L+0.75 H, 고농도(H))을 허용하였으나, 혼합 과정상의 오차가 발생할 수 있기에 새 지침에서는 동일 부피 혼합(equal volume mixing), 비례적 혼합(proportional mixing), 계단희석(serial dilution) 등을 이용하여 제조할 것을 권장한다.
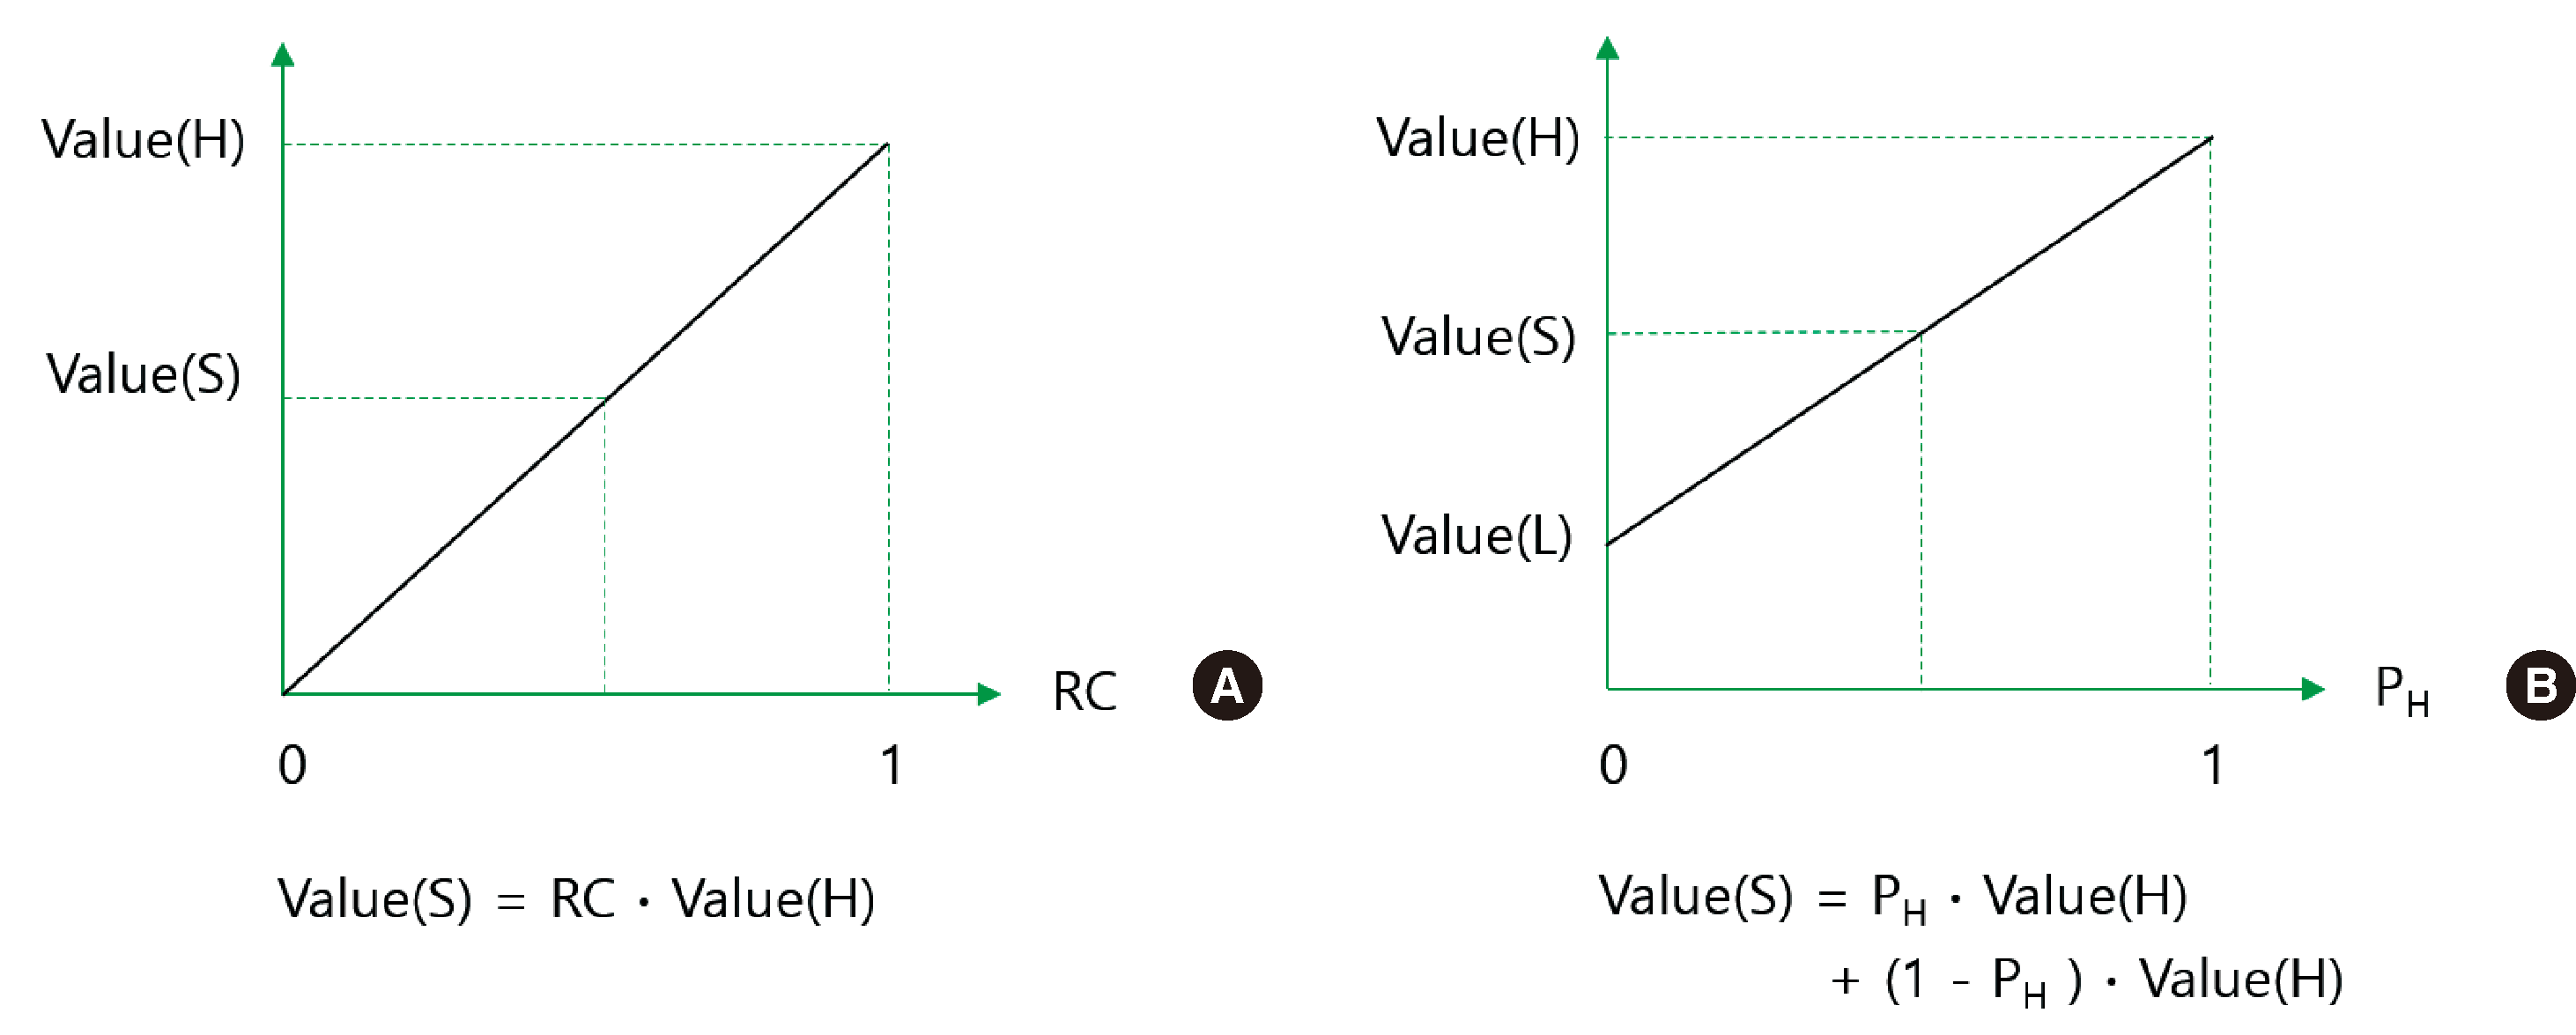
한편으로 EP06-ED2에서는 검증 과정의 기본 연구 디자인(design)을 크게 3가지로 제시하였는데, Fig. 2와 같이 디자인 A에서는 고농도 검체와 공시료(blank sample)를 혼합하여 중간농도 검체를 제조하는 방식으로 EP06-ED2에서는 권장하는 방식이고, 디자인 B는 고농도 검체와 저농도 검체를 혼합하여 중간농도 검체를 제조하는 방식이다. Fig. 2에는 제시하지 않았지만 디자인 C는 전체 구간을 커버하기 위해 서로 다른 고농도 검체1과 2를 사용하여 다중 직선성 패널을 제조하는 방식이다[12].

5. 직선구간의 검증

Table 1에서도 언급하였듯이 EP06-ED2에서는 직선구간의 검증과 검정 과정을 서로 분리하였다. EP06-ED2에서는 직선구간 검증에 있어서 직선구간 전반에 걸쳐있는 여러 농도의 검체를 이용하여 직선성 패널을 마련하고, 각 검체에 대해서는 단일 검사시행(single run) 내에 측정을 완료할 것을 제시한다. 단일 시행 내에 측정할 반복측정횟수는 Supplementary Table 1과 같이 검사법 자체의 변이계수(coefficient of variation, %CV) 및 ADL에 따라 달라질 수 있는데 ADL이 높고 %CV가 낮을수록 요구되는 반복측정횟수가 적고 ADL이 낮고 %CV가 높을수록 요구되는 반복측정횟수는 많다. 다만, 해당 표에서 반복측정횟수를 2 혹은 3으로 제시하는 경우에도 최소 4회 이상 반복측정을 권장하고 있다[12].
직선성 패널의 검체 수는 최소 9개 이상 농도의 검체가 필요한데, Fig. 3과 같이 9개 검체 중에 7개는 직선구간상한(upper limit of linearity interval, ULLI)과 직선구간하한(lower limit of linearity interval, LLLI) 이내의 검체를 사용하면 되는데, 최고 농도 검체는 ULLI와 정량상한(upper limit of quantitation, ULoQ) 사이의 검체, 최저 농도의 검체는 LLLI와 정량하한(lower limit of quantitation, LLoQ) 사이의 검체여야 한다. 예를 들어 측정가능구간이 5–320 ng/mL, 직선구간이 10–300 ng/mL 인 검사법을 평가할 경우, 5–10 ng/mL 사이의 검체 1개, 10–300 ng/mL 사이의 검체 7개, 300–320 ng/mL 사이의 검체 1개로 직선성 패널을 구성하면 된다.
EP06-ED2 [12] 지침에 의한 Design A의 직선성 검증 평가 예시를 Table 2에 제시하였다. 다만, Design B의 경우는 상대농도가 없지만 중간검체의 농도를 고농도 검체 농도로 나눈 값을 상대농도로 간주하여 평가를 시행하면 된다(예: 중간농도 검체의 농도가 190 ng/mL, 최고농도 검체의 농도가 210 ng/mL인 경우, 190/210≒0.9048을 상대농도로 간주함). Table 2에서 각 검체의 %편차(% deviation)가 ±%ADL 이내이면 적합 판정을 내릴 수 있는데, 경우에 따라 저농도 검체의 경우 별도로 편차의 절대값을 ADL 절대값과 비교할 수 있다. 즉, 직선구간의 검증은 실제 측정값과 가중치를 적용한 예측값 간의 차이가 ADL 이내에 드는지를 평가하는 과정이라 할 수 있다.

6. 직선구간의 검정

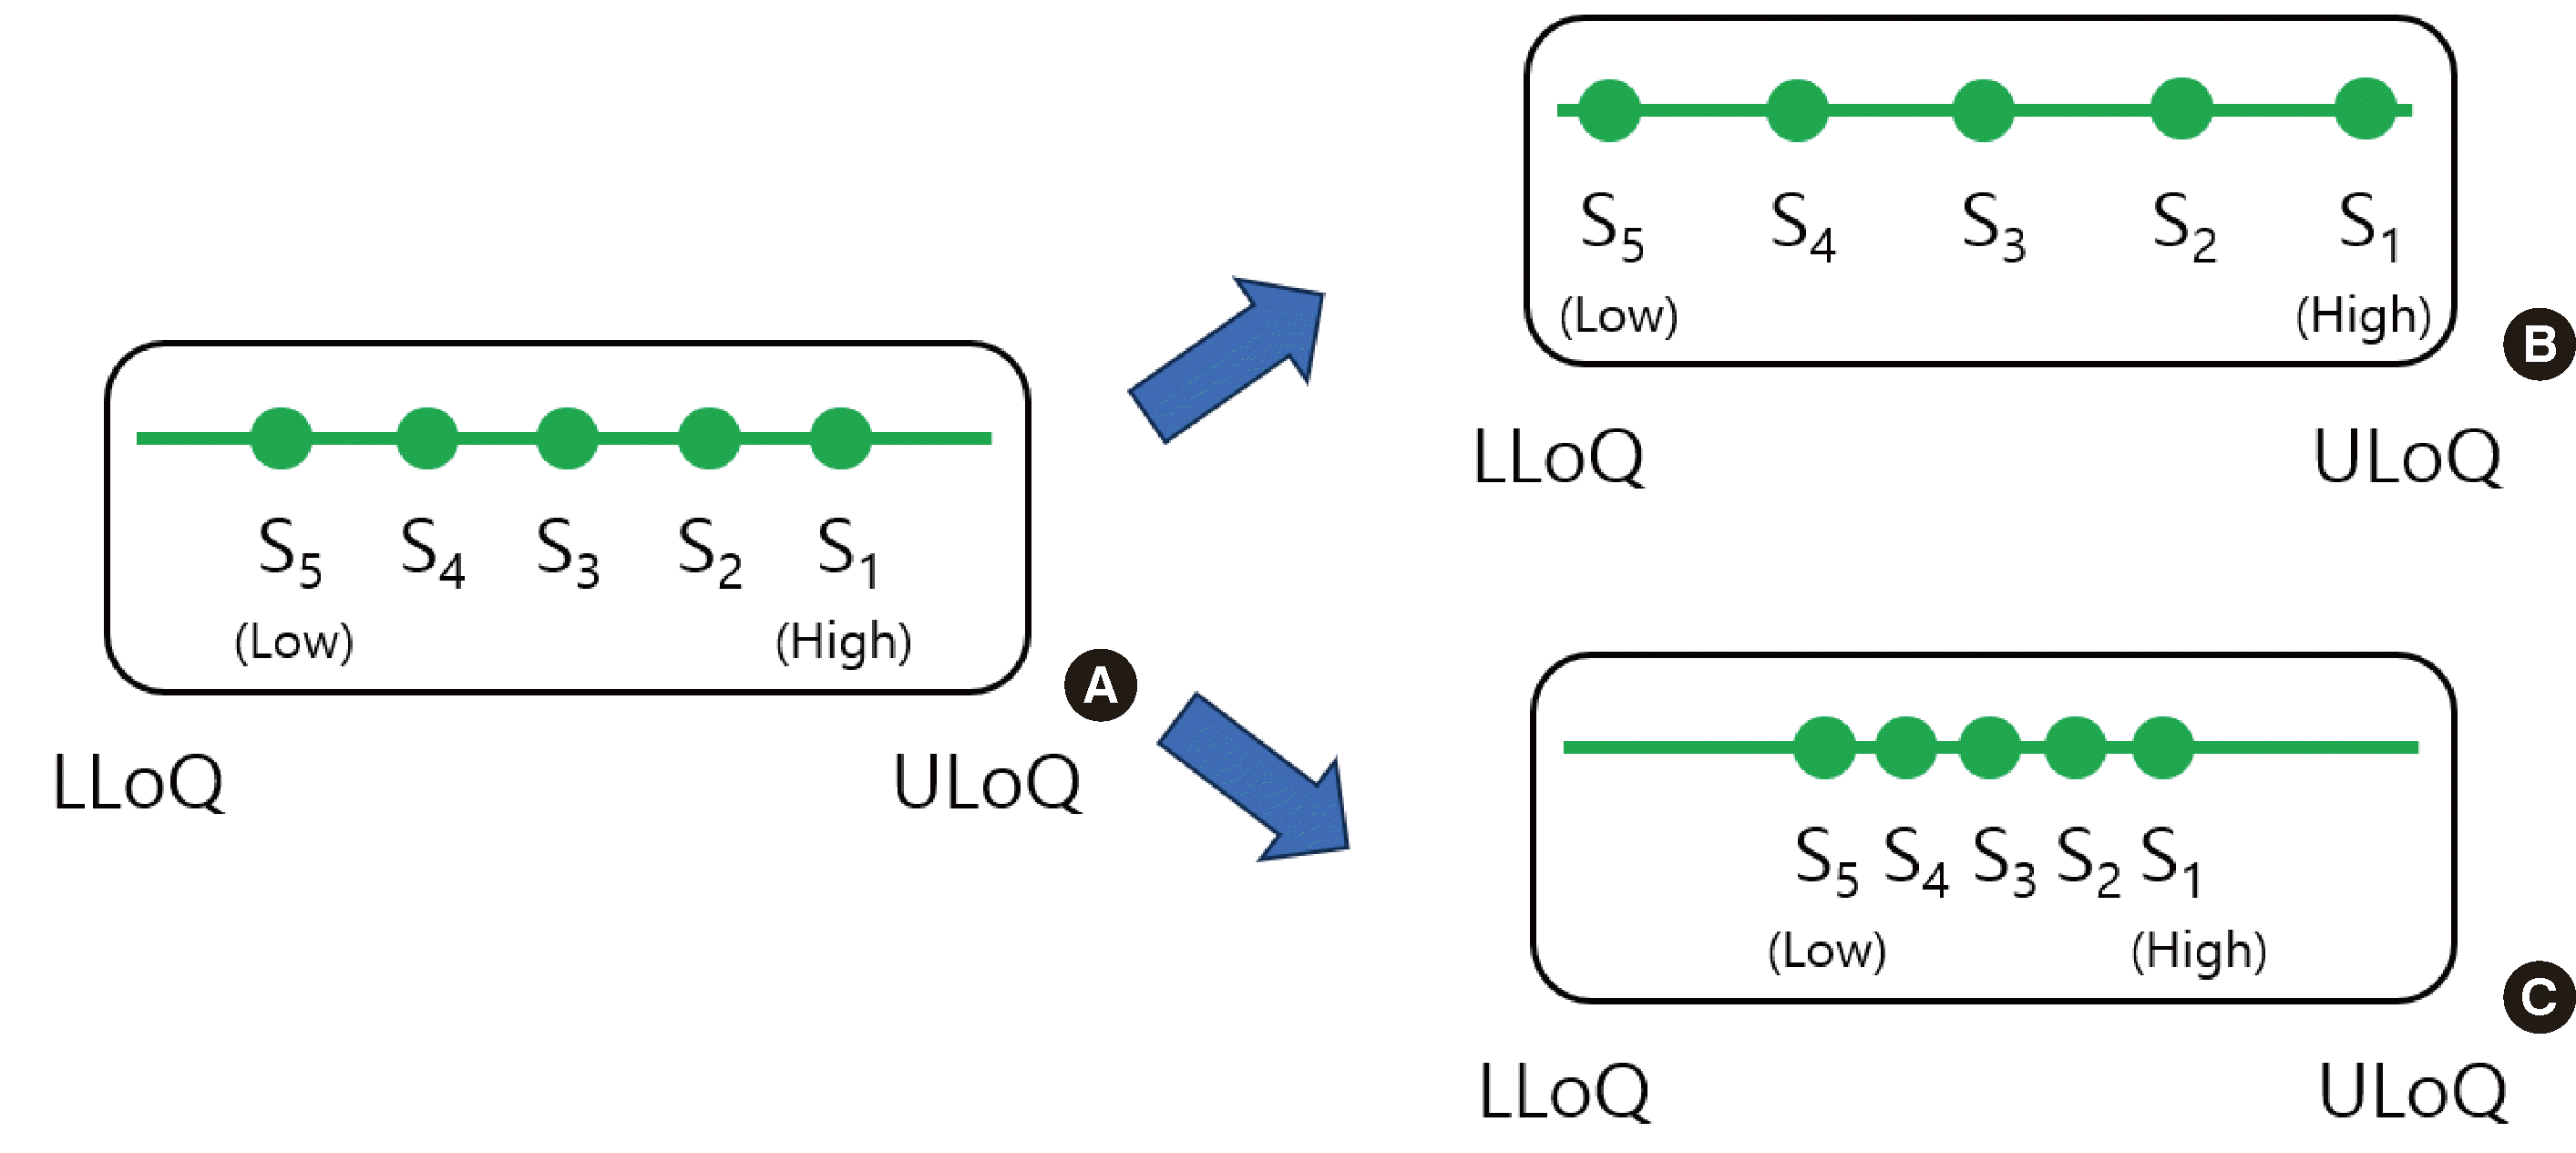
직선구간의 검정에서는 5, 6개 검체를 최소 2회 이상 반복 측정하는 것을 권장한다. 5개 직선성 평가 검체 모두가 LI와 관계없이 LLoQ와 ULoQ 사이에 있으면 되는데, 최저농도과 최고농도가 각각 얼마나 LLoQ와 ULoQ에 근접해야 하는지는 Supplementary Table 2와 같이 해당 검사법의 비정밀도에 따라 다르다[12]. Fig. 4와 같이 평가대상 검사법의 비정밀도 혹은 %CV가 낮을수록 AMI의 상한과 하한(=ULoQ와 LLoQ)에 근접한 농도의 검체를 사용할 수 있으나, 검사법의 비정밀도 혹은 %CV가 낮으면 AMI의 상한과 하한보다 훨씬 좁은 농도 범위의 검체를 사용해야 하며 이럴 경우 검정되는 LI의 범위는 좁아질 수 밖에 없다.
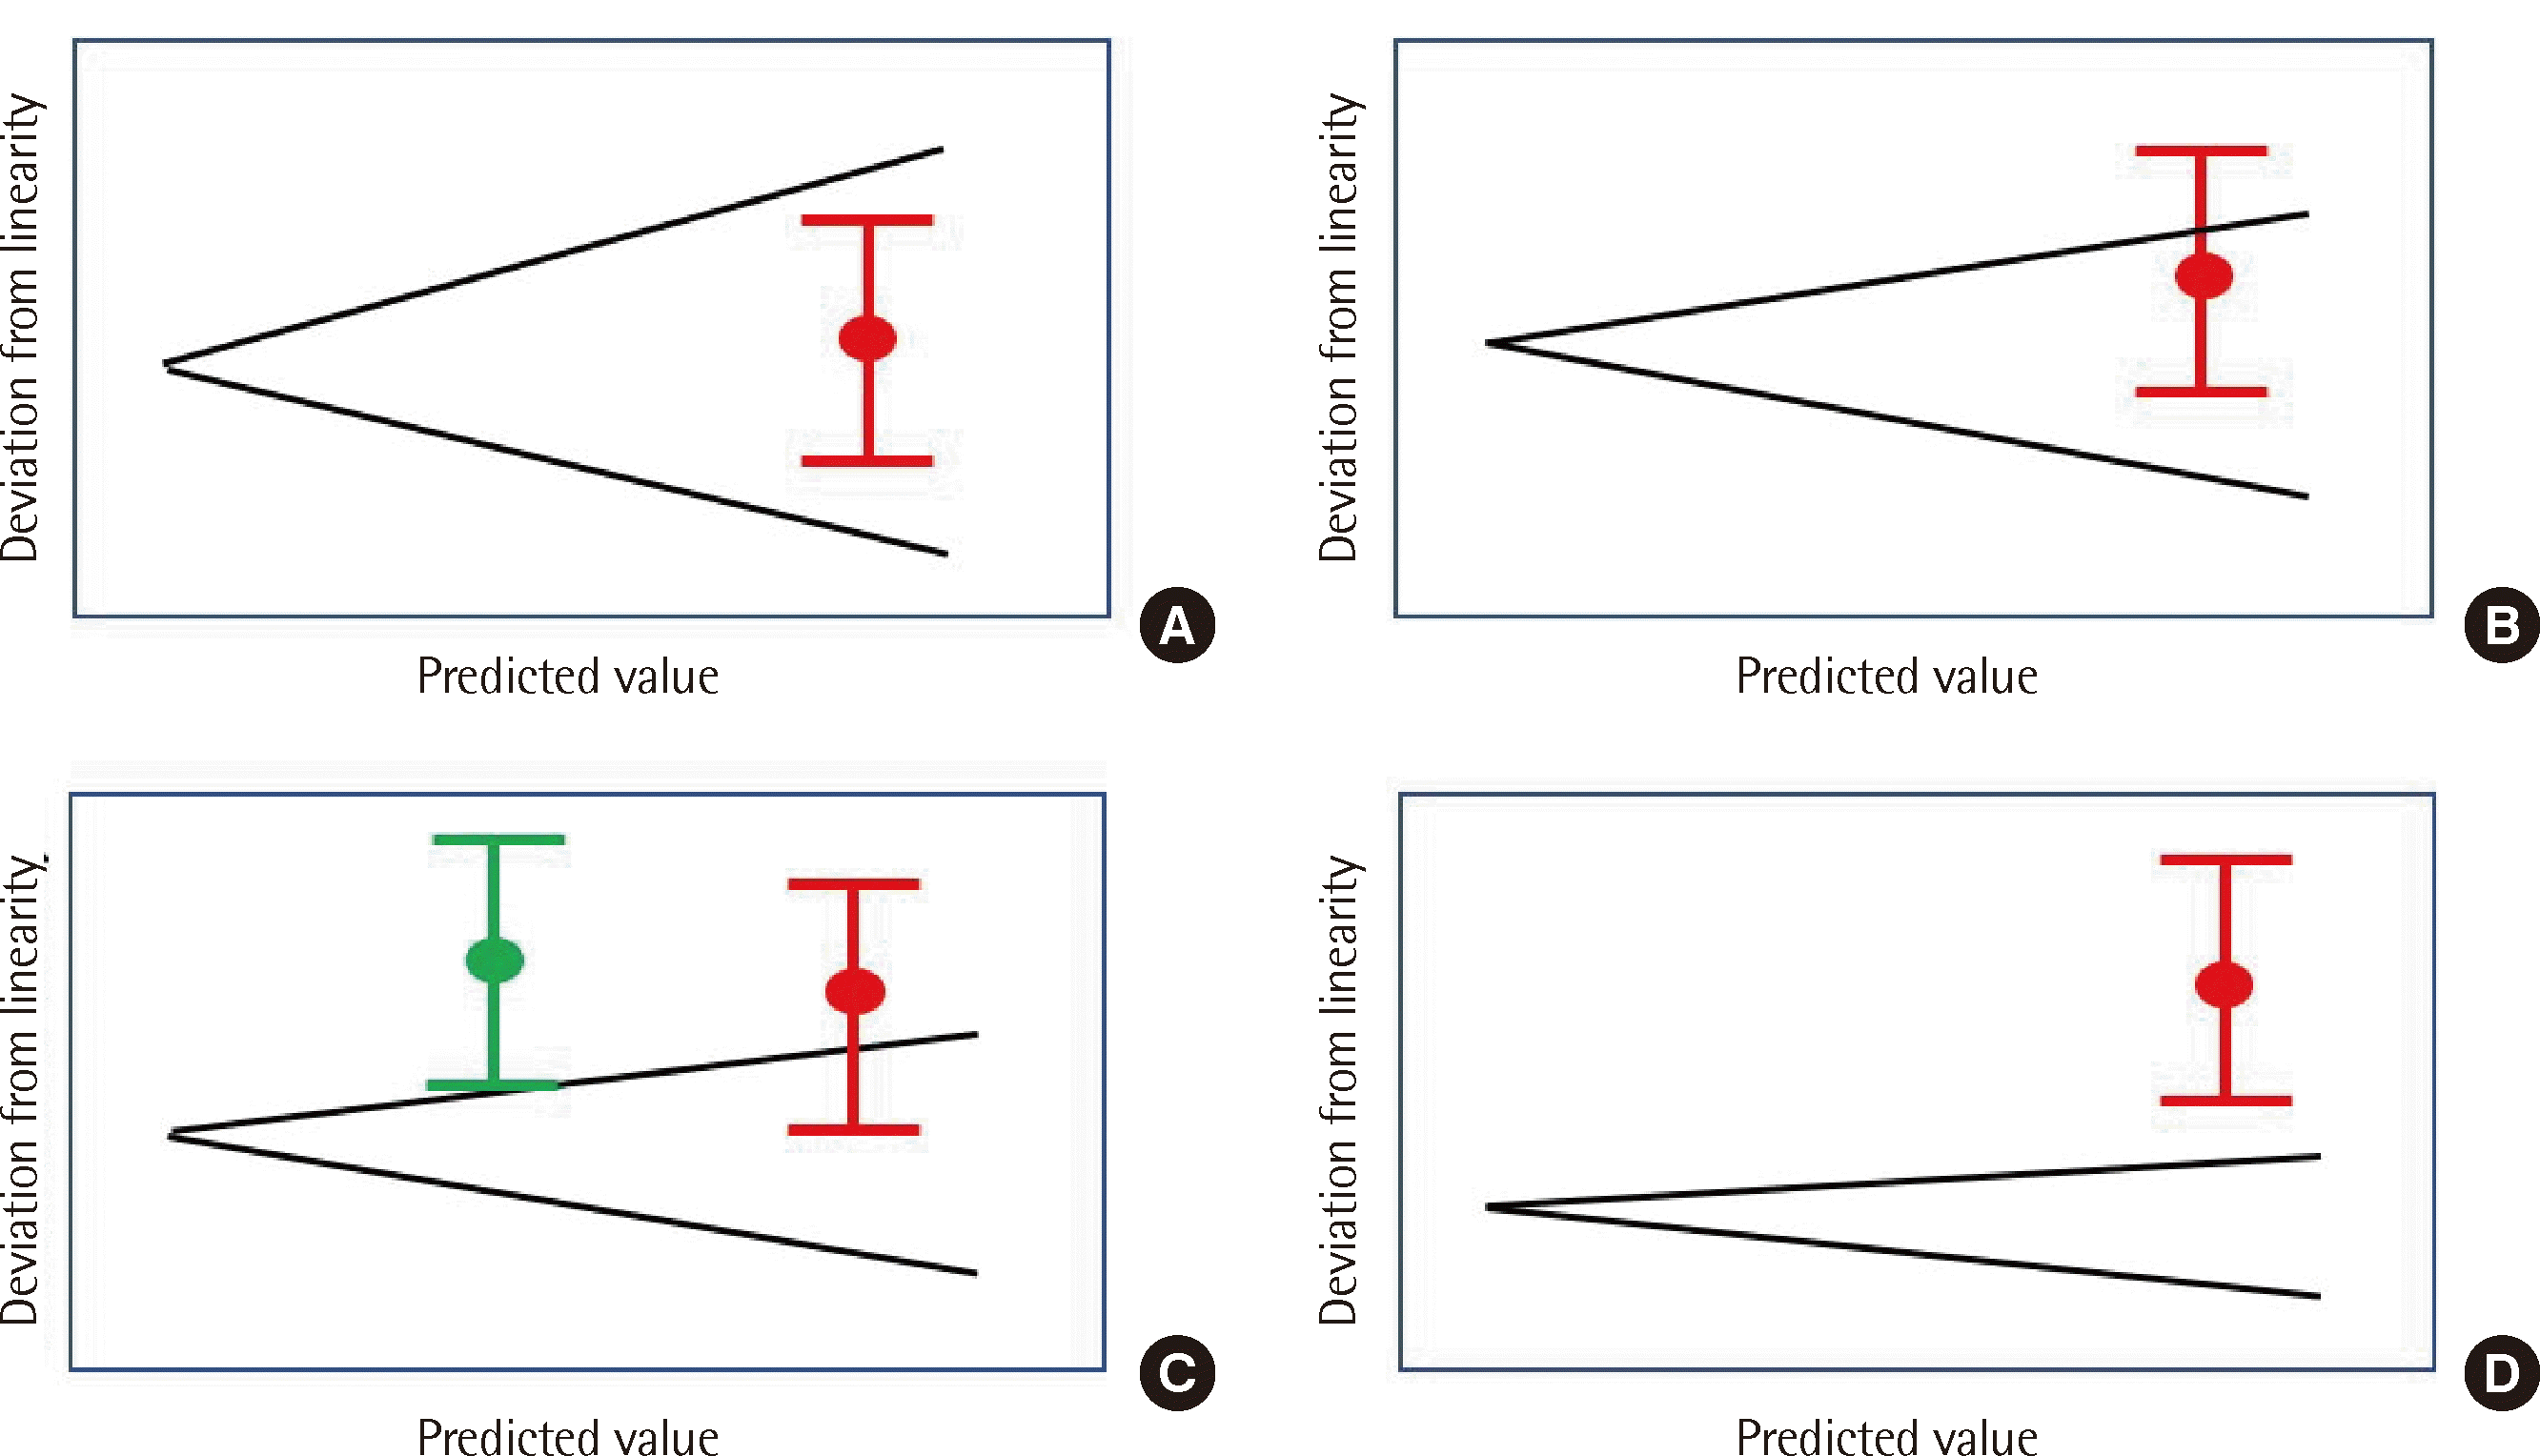
직선성 검정에서는 고농도 검체와 저농도 검체를 이용하여 패널을 구성하기에 평가에서 상대농도가 아닌 PH를 이용한다. EP06-ED2 [12] 지침에 의한 직선성 검정 평가 예시를 Table 3에 제시하였다. 최종적으로 각 검체의 편차와 이에 대한 90% confidence interval (CI, 신뢰구간)을 산출하였고, 90% 신뢰구간의 상한과 하한이 ±ADL (=±%ADL·각 검체의 평균값)과 조금이라도 중첩(overlap)하면 적합 판정을 내릴 수 있는데, 90% 신뢰구간과 ±ADL에 따른 판정 기준을 Fig. 5에 제시하였다. CLSI 지침을 제공하는 eCLIPSE 홈페이지에서는[35] 2022년에 EP06-ED2에 대한 implementation guideline [36]과 Microsoft Excel 파일 형태의 workbook [37]을 제공하고 있는데, 이를 통해 검사의 기본 정보, ADL, 그리고 데이터만 입력하면 이를 자동으로 계산하여 직선성을 손쉽게 검정할 수 있으며, 시각화된 그래프도 제공해 준다. 다만 eCLIPSE 계정을 보유하고 있거나 CLSI 문서를 구매한 경우에 한해서 로그인 및 접근이 가능하며 검증에 대해서는 workbook이 제공되지 않는다.

확장측정구간의 평가 및 설정

1. 확장측정구간 관련 용어 정의 및 변천 과정

검체희석(sample dilution)을 통해 측정가능범위를 확장하여 보고가능범위를 확장할 수 있는데, Clinical Laboratory Improvement Amendments of 1988 (CLIA)에서는 ‘검사실이 측정 기기 또는 시스템의 정확성을 확립하거나 확인할 수 있는 값의 범위’라고 보고가능범위(reportable range, RR)를 정의하였다[38].
보고가능범위는 크게 둘로 나눌 수 있는데, College of American Pathologists (CAP)에서는 분석측정범위(analytical measurement range, AMR) [22]라는 용어를 통해 ‘희석, 농축, 전처치 등을 거치지 않고 검체의 값을 보고할 수 있는 범위’를 명시하였고[39], 임상보고가능범위(clinically reportable range, CRR) [22]라는 용어를 통해 ‘AMR의 범위를 벗어나지만, 검체의 희석을 통해 확장하여 보고 가능한 구간’을 추가적으로 규정하였다[4, 40].
EP34-ED1 [19]에서는 해당 용어들이 개정되었는데, 기존의 AMR와 CRR은 각각 측정가능구간(AMI)과 확장측정구간(extended measuring interval, EMI)으로, 기존의 RR은 보고가능구간(RI)으로 개정되었다. Fig. 6에 AMI, EMI, RI의 관계를 도식화하여 설명하였다.

2. 희석배수 평가의 기본 고려사항

희석은 환자 검체의 기질과는 다른 희석액을 사용하기 때문에 부득이하게 환자 검체의 기질을 변화시킬 수 있고, 분석물질과 단백 간 결합, 효소 활성, 세포 구성요소 등의 변화가 발생할 가능성이 있다. 이상적으로는 희석액이 원 검체의 기질과 같아야 하지만 생리식염수나 탈이온수의 기질 효과는 미미하고, 각 제조사에서 사전 검증된 전용 희석액도 사용 가능하다[19]. 특정 검사법이나 기기에서 희석배수를 설정하고 확장측정구간을 검증 및 검정하는 것은 기질 효과에 영향을 유의미하게 받지 않고 검사의 정확성 및 신뢰성을 입증하기 위해 꼭 필요한 절차이다[41]. 또한 같은 제조사에서의 동일 제품이라 할지라도 각 검사실에서의 AMI 검정 혹은 희석배수 검정에 따라 같은 검사라도 EMI가 다를 수 있으므로 이는 중요한 절차이다[15]. EP34-ED1에 제시된 희석배수 평가 전 사전 준비사항은 다음과 같다[19].
  • (1) ULoQ의 75–100%에 해당하는 농도의 검체를 사용하여 단계적으로 희석 후 각 농도에서의 비정밀도를 EP05 [42] 또는 EP15 [43]에 의거하여 평가하여 목표 변이계수 이상을 만족하는 최저 농도를 사전에 확립한다.

  • (2) 확립 이후에는 희석 평가에서 희석 후의 농도가 해당 최저 농도 이상이 되도록 희석 배수를 조정한다.

  • (3) 고농도의 검체를 희석한 샘플의 측정 결과가 LLoQ와 ULoQ 사이, 즉 AMI 범위 이내에 드는지를 확인한다.

  • (4) 후크효과(hook effect) 때문에 극히 높은 농도의 검체의 측정값이 AMI 이내의 값으로 측정되는 오류를 방지하기 위해서 최소 4개 이상의 검체를 이용하여 후크효과 여부를 평가하고 만일 후크효과가 발생 시 추가적인 희석 연구가 필요할 수도 있다.

  • (5) 추가적으로 부피 측정 오류로 인해 실제 의도한 희석배수와는 다른 희석이 이루어질 수 있는데, 계단 희석의 경우 부피 측정 오류를 줄일 수는 있으나 과정상 오류가 누적되어 한번에 높은 희석배수로 희석하는 것보다 오류가 더 크게 발생할 가능성이 있으니 주의해야 한다.

3. 희석배수의 설정

희석배수의 설정 방식은 EP34-ED1 지침을 따른다[19]. 검체는 농도값을 사전에 알고 있으면서 그 농도가 해당 검사의 ULoQ 이상인 검체를 사용하며, 최소 3개 이상의 검체를 사용하는데 검체 수가 많으면 많을수록 평가 결과가 실제 검사의 성능을 반영할 확률이 높아진다. 다만, 앞서 밝혔듯이 희석 후의 농도값은 LLoQ와 ULoQ 사이에 있어야 한다. 각 검체마다 희석전 측정값을 원검체의 목표값으로 하고, 희석배수의 역수를 곱한 값을 각 희석배수에서의 목표값으로 한다. 그리고 Table 4와 같이 원검체 및 각 희석배수에서의 %회수율을 구하고 이를 바탕으로 통계 처리한다. 희석배수의 설정에서 주의해야 할 점은 다른 유형의 평가들과는 달리 %회수율의 평균이 목표% 이내이면 적합 판정을 내리는 것이 아니라, 추가적으로 95% confidence limit (CI, 신뢰한계)를 산출하여 2.5% 신뢰하한과 97.5% 신뢰상한 모두가 목표% 이내여야 한다는 점이다. 신뢰한계를 모두 만족하는 최대 희석배수를 권장 최대 희석배수로 설정할 수 있다.

4. 첨가 회수율 연구

첨가(spiking) 실험은 제조사가 측정법의 기본적인 정확도 문제를 진단하는 데에 유용한 평가 요소로서, 첨가를 위해서는 적어도 3개 이상, 권장 5개 농도의 검체가 필요하고[44], 첨가-회수율 방법을 이용하여 적합성을 판정한다[45]. 첨가 평가 시 기질 효과를 최소화하기 위해 첨가 물질(혹은 용액)의 부피는 원 검체 부피의 10% 이하이어야 한다[11]. Table 5에 첨가 회수율 평가의 예를 제시하였다. 농도가 A mg/dL인 첨가용액 B mL를 C mL 혈청에 첨가할 경우의 예상되는 농도 증가폭은 A·B/(B+C)이다. 대상 혈청을 분주하여 한 쪽에는 첨가용액을 B mL 첨가하고, 다른 쪽에는 첨가물질이 들어있지 않은 순수 용매(solvent)를 B mL 첨가한다. 이 둘에서의 분석물질(analyte) 농도를 측정하여 그 차이를 구하고, %회수율=100·(실제 측정된 농도 차이)/(예상되는 농도 증가폭)으로 계산하여, 전체 검체에서의 평균 %회수율이 목표% 이내인지를 통해 첨가 실험의 적합성 여부를 판정한다[19].

5. 희석배수의 검증 및 검정

제조사에 의해 설정된 희석배수를 검증하기 위한 방법은 다음과 같다[19]. 농도값을 사전에 알고 있으면서 그 농도가 EMI 범위 내에 있는 검체를 최소 5개 이상 준비하되 이들의 농도는 EMI 전반에 걸쳐 있는 것이 권장된다. 자동희석(automated dilution)의 경우 2대 이상의 서로 다른 검사장비에서 각 샘플을 각각 4회 반복측정하고(5 검체×장비 2대×4회 반복=40회), 수동희석(manual dilution)의 경우 2명의 검사자가 수행하지만 수기 희석에 따른 오류를 최소화기 위해 검체를 둘로 분주하여 각각 따로 희석하고 이를 2회씩 반복측정한다(5검체×검사자 2명×희석방식 2개×2회 반복=40회) [19]. 이들의 추정치(=측정치·희석배수)를 구하고, %회수율(=100·추정치/원검체값)의 평균이 목표% 이내에 들면 해당 희석배수는 검증된 것이라 할 수 있다. Table 6에 희석배수 검증의 예를 제시하였다.
희석배수의 검정은 ULoQ의 75–100%에 해당하는 농도의 검체를 최소 3개 이상(권장 5개) 사용하여 시행하며, 이 역시 %회수율의 평균이 목표% 이내에 드는지 여부로 적합성 여부를 판정한다[19]. CLSI 지침을 제공하는 eCLIPSE 홈페이지에서는[35] 역시 2022년에 EP34-ED1에 대한 implementation guideline [46]과 Microsoft Excel 파일 형태의 workbook [47]을 제공하고 있는데, 3–5개 검체를 1–3회 반복측정한 값을 입력할 수 있고, 엑셀 파일의 각 탭을 통해 각각 원검체와 수기희석의 비교, 정도관리물질의 할당값(assigned value)과 자동희석의 비교, 원검체와 자동희석의 비교, 자동희석과 수기희석의 비교를 할 수 있다. 다만 이 역시 eCLIPSE 계정을 보유하고 있거나 CLSI 문서를 구매한 경우에 한해 로그인 및 접근이 가능하며 검증에 대해서는 workbook이 제공되지 않는다.

결 론

본 종설에서는 직선성 및 희석배수 평가를 통해 직선구간과 확장측정구간을 검증 및 검정하는 과정에 대한 전반을 다루었다. 본 종설을 통해 각 임상 검사실 및 관련 업계에서 직선성 및 희석배수에 대한 이해를 넓히고 보다 쉽게 이를 평가함으로서 국내의 진단검사 품질을 향상시키는 데에 기여할 수 있을 것으로 기대된다.

감사의 글

본 종설은 저자가 대한임상화학회 검사법평가위원회의 검토를 받아 2023년 대한임상화학회 추계학술대회 검사법평가 워크숍에서 발표한 내용을 바탕으로 작성하였습니다.

Notes

이해관계

저자는 본 연구와 관련하여 어떠한 이해관계도 없음을 밝힙니다.

REFERENCES

1. International Organisation for standardization. 2017. General requirements for the competence of testing and calibration laboratories. International Organisation for standardization;Geneva: ISO/IEC 17025. DOI: 10.3403/02033502u.
2. Pharmaceutical Standardization Division, Drug Evaluation Department, National Institute of Food, Drug Safety Evaluation. 2015. Validation guidelines of analytical procedures and method validation for drugs and biologics. [식품의약품안전평가원 의약품심사부 의약품규격과. 의약품등 시험방법 밸리데이션 가이드라인].
3. Oh HB. 2015. Clinical evaluation and approval of in vitro diagnostic medical devices. 2nd ed. Korea Medical Book Publishing Company;[오흥범. 체외진단용 의료기기의 임상평가와 인허가, 제2판. 고려의학].
4. Killeen AA, Long T, Souers R, Styer P, Ventura CB, Klee GG. 2014; Verifying performance characteristics of quantitative analytical systems: calibration verification, linearity, and analytical measurement range. Arch Pathol Lab Med. 138:1173–81. DOI: 10.5858/arpa.2013-0051-CP. PMID: 25171699.
5. Laboratory Medicine Foundation. Accreditation checklists (Updated on Jan 2024). [진단검사의학재단 우수검사실 신임인증 체크리스트].
6. Kroll MH, Emancipator K, Floering D, Tholen D. 1999; An algorithm for finding the linear region in a nonlinear data set. Comput Biol Med. 29:289–301. DOI: 10.1016/S0010-4825(99)00011-6. PMID: 10463796.
7. Jhang JS, Chang CC, Fink DJ, Kroll MH. 2004; Evaluation of linearity in the clinical laboratory. Arch Pathol Lab Med. 128:44–8. DOI: 10.5858/2004-128-44-EOLITC. PMID: 14692813.
8. Magari RT, Rodriguez L. 2004; Linearity evaluation of analytical methods that count particles. Clin Chem Lab Med. 42:215–21. DOI: 10.1515/CCLM.2004.039. PMID: 15061364.
9. Paulson R, Wachtel M. 1995; Using linearity assessment in the laboratory. Lab Med. 26:526–32. DOI: 10.1093/labmed/26.8.526.
10. National Committee for Clinical Laboratory Standards. 1986. Evaluation of the linearity of quantitative analytical methods: proposed guideline. National Committee for Clinical Laboratory Standards;Villanova, PA: NCCLS publication EP6-P.
11. Clinical, Laboratory Standards Institute. 2003. Evaluation of the linearity of quantitative measurement procedures: a statistical approach; approved guideline. Clinical and Laboratory Standards Institute;Wayne, PA: CLSI document EP06-A.
12. Clinical, Laboratory Standards Institute. 2020. Evaluation of linearity of quantitative measurement procedures. 2nd ed. Clinical and Laboratory Standards Institute;Wayne, PA: CLSI document EP06-ED2.
13. Korean Society for Laboratory Medicine. 2013. Evaluation of the linearity of quantitative measurement procedures: a statistical approach; approved guideline. IB Planning Co.;CLSI document EP06-A. [대한진단검사의학회 편. 정량적 측정 절차의 직선성 평가: 통계적 접근; 승인 지침. CLSI 지침서 EP06-A. 도서출판 아이비기획].
14. Korean Society for Laboratory Medicine. 2022. Evaluation of linearity of quantitative measurement procedures. IB Planning Co.;CLSI document EP06-ED2. [대한진단검사의학회 편. 정량적 측정 절차의 직선성 평가. CLSI 지침서 EP06-ED2. 도서출판 아이비기획].
15. Korean Society for Laboratory Medicine. 2021. Laboratory Medicine. 6th ed. Panmun Education;Seoul, Korea: [대한진단검사의학회 편. 진단검사의학, 제6판. 범문에듀케이션]. DOI: 10.1016/s0272-2712(21)00062-7.
16. Korean Society for Laboratory Medicine. 2021. Practical Handbook of Laboratory Medicine. 1st ed. Panmun Education;Seoul, Korea: [대한진단검사의학회 편. 진단검사의학 실무핸드북, 제1판. 범문에듀케이션].
17. International Organisation for Standardization. 2022. Medical laboratories - Requirements for quality and competence. International Organisation for Standardization;Geneva: ISO 15189. DOI: 10.3403/02769708u.
18. Andreasson U, Perret-Liaudet A, Blennow K, Chiasserini D, Engelborghs S, et al. van Waalwijk van Doorn LJC. 2015; A practical guide to immunoassay method validation. Front Neurol. 6:179. DOI: 10.3389/fneur.2015.00179. PMID: 26347708. PMCID: PMC4541289. PMID: d941d9232ecb495eb426ac077775327b.
19. Clinical, Laboratory Standards Institute. 2018. Establishing and verifying an extended measuring interval through specimen dilution and spiking. 1st ed. Clinical and Laboratory Standards Institute;Wayne, PA: CLSI document EP34-ED1.
20. Korean Society for Laboratory Medicine. 2020. Establishing and verifying an extended measuring interval through specimen dilution and spiking. IB Planning Co.;CLSI document EP34-ED1. [대한진단검사의학회 편. 검체 희석과 첨가를 통한 확정측정구간 설정 및 검정. CLSI 지침서 EP34-ED1. 도서출판 아이비기획].
21. Cho J, Rim JH, Kim J. 2024; Current status of method evaluation procedures used by clinical laboratories in Korea. Lab Med Online. 230:41.
22. Korean Society for Laboratory Medicine. 2019. Laboratory Medicine Terminology. 2nd ed. Academya;Seoul, Korea: [대한진단검사의학회 편. 개정판 진단검사의학 용어집. 도서출판 아카데미아].
23. Kroll MH, Emancipator K. 1993; A theoretical evaluation of linearity. Clin Chem. 39:405–13. DOI: 10.1093/clinchem/39.3.405. PMID: 8448849.
24. Hsieh E, Liu JP. 2008; On statistical evaluation of the linearity in assay validation. J Biopharm Stat. 18:677–90. DOI: 10.1080/10543400802071378. PMID: 18607801.
25. Ross HA, Sweep CG. 2003; An improved procedure for testing for assay linearity. Ann Clin Biochem. 40:75–8. DOI: 10.1258/000456303321016204. PMID: 12542914.
26. Emancipator K, Kroll MH. 1993; A quantitative measure of nonlinearity. Clin Chem. 39:766–72. DOI: 10.1093/clinchem/39.5.766. PMID: 8485866.
27. Kim Y, Park HI, Lee HK, Nam HS, Lee YW, Lee SG, et al. 2019; Development of statistical software for the Korean Laboratory Accreditation Program using R language: LaboStats. Ann Lab Med. 39:552–60. DOI: 10.3343/alm.2019.39.6.552. PMID: 31240883. PMCID: PMC6660338.
28. Liu JP, Chow SC, Hsieh TC. 2009; Deviations from linearity in statistical evaluation of linearity in assay validation. J Chemometrics. 23:487–94. DOI: 10.1002/cem.1242.
29. Kroll MH, Praestgaard J, Michaliszyn E, Styer PE. 2000; Evaluation of the extent of nonlinearity in reportable range studies. Arch Pathol Lab Med. 124:1331–8. DOI: 10.5858/2000-124-1331-EOTEON. PMID: 10975932.
30. Hsieh E, Hsiao CF, Liu JP. 2009; Statistical methods for evaluating the linearity in assay validation. J Chemom. 23:56–63. DOI: 10.1002/cem.1194.
31. Clinical, Laboratory Standards Institute. 2018. Measurement procedure comparison and bias estimation using patient samples. 3rd ed. Clinical and Laboratory Standards Institute;Wayne, PA: CLSI document EP09c-ED3.
32. Jeong TD, Kim SK, Kim S, Lim CY, Chung JW. 2022; Comparison between polynomial regression and weighted least squares regression analysis for verification of analytical measurement range. Clin Chem Lab Med. 60:989–94. DOI: 10.1515/cclm-2022-0018. PMID: 35531706.
33. The International Bureau of Weights, Measures (BIPM). 2012. International vocabulary of metrology - basic and general concepts and associated terms (VIM). 3rd ed. The International Bureau of Weights and Measures;Sèvres: JCGM 200:2012. DOI: 10.59161/jcgm200-2012.
34. Clinical, Laboratory Standards Institute. 2015. A framework for using CLSI documents to evaluate clinical laboratory measurement procedures. 2nd ed. Clinical and Laboratory Standards Institute;Wayne, PA: CLSI document EP19-ED2.
35. Clinical, Laboratory Standards Institute. eCLIPSE Ultimate Access. https://clsi.org/get-involved/eclipse-ultimate-access. Last accessed on May 2024.
36. Clinical, Laboratory Standards Institute. 2022. User verification of linearity implementation guide. Clinical and Laboratory Standards Institute;Wayne, PA: CLSI document EP06-ED2-IG.
37. Clinical, Laboratory Standards Institute. 2022. User verification of linearity workbook. Clinical and Laboratory Standards Institute;Wayne, PA: CLSI document EP06-ED2-WB. DOI: 10.1007/0-387-28094-4_7.
38. Centers for Disease Control, Prevention. CLIA law & regulations. https://www.ecfr.gov/current/title-42/chapter-IV/subchapter-G/part-493. Last accessed on May 2024.
39. College of American Pathologists. 2012. Commission on Laboratory Accreditation. Chemistry and Toxicology Checklist. College of American Pathologists;Northfield, IL: DOI: 10.1093/oso/9780195162127.003.0013.
40. Westgard JO. 2003. Basic Method Validation. 2nd ed. Westgard QC, Inc.;Madison, WI:
41. Lee JW, Devanarayan V, Barrett YC, Weiner R, Allinson J, Fountain S, et al. 2006; Fit-for-purpose method development and validation for successful biomarker measurement. Pharm Res. 23:312–28. DOI: 10.1007/s11095-005-9045-3. PMID: 16397743.
42. Clinical, Laboratory Standards Institute. 2014. Evaluation of precision of quantitative measurement procedures; approved guideline-3rd ed. Clinical and Laboratory Standards Institute;Wayne, PA: CLSI document EP05-A3.
43. Clinical, Laboratory Standards Institute. 2014. User verification of precision and estimation of bias; approved guideline-3rd ed. Clinical and Laboratory Standards Institute;Wayne, PA: CLSI document EP15-A3.
44. Valentin MA, Ma S, Zhao A, Legay F, Avrameas A. 2011; Validation of immunoassay for protein biomarkers: bioanalytical study plan implementation to support pre-clinical and clinical studies. J Pharm Biomed Anal. 55:869–77. DOI: 10.1016/j.jpba.2011.03.033. PMID: 21530130.
45. Jarantow SW, Pisors ED, Chiu ML. 2023; Introduction to the use of linear and nonlinear regression analysis in quantitative biological assays. Curr Protoc. 3:e801. DOI: 10.1002/cpz1.801. PMID: 37358238.
46. Clinical, Laboratory Standards Institute. 2022. Verification of an extended measuring interval implementation guide. Clinical and Laboratory Standards Institute;Wayne, PA: CLSI document EP34-ED1-IG. DOI: 10.5040/9781350262119.part-004.
47. Clinical, Laboratory Standards Institute. 2022. Verification of an extended measuring interval workbook. Clinical and Laboratory Standards Institute;Wayne, PA: CLSI document EP34-ED1-WB.

Fig. 1
The relationships between the measured values and the expected values. (A) Each measured value is precise, and both the measured values and the expected values show a straight linear trajectory; (B) Each measured value is not precise and does not show a straight linear trajectory, but is it is close to the expected values; (C) Each measured value is not precise, but the mean values are close to the expected values and show a straight linear trajectory. Blue dots represent the measured values from the duplicate measurements, and red dots represent the expected values by the calculation using the ratios of low and high-level samples.
lmo-14-3-163-f1.tif
Fig. 2
Study designs for linearity validation. (A) Design A (recommended): Intermediate samples are prepared by mixing high-level sample and blank sample (a straight line linear with no intercept); (B) Design B: Intermediate samples are prepared by mixing high-level sample and low-level sample (a straight line linear with a non-zero intercept).
RC (relative concentration): The relative ratio of the value of the intermediate sample compared to the value of the high-level sample. The RC of the high-level sample is 1, the RC of the blank sample is 0, and the RC of the intermediate sample prepared by mixing the high-level sample and blank sample in a volume of 1:1 is 0.5.
PH (the proportion of high-level sample): The relative fraction of high-level sample in the intermediate sample. In an intermediate sample prepared by mixing a high-level sample and a low-level sample in a volume of 8:2, the value of the intermediate sample is calculated by Value(S)=0.8∙Value (H)+0.2∙Value(L). (Reprinted with permission from Clinical and Laboratory Standards Institute from: CLSI. Evaluation of Linearity of Quantitative Measurement Procedures. 2nd ed. CLSI guideline EP06. Clinical and Laboratory Standards Institute, 2020 [12]).
lmo-14-3-163-f2.tif
Fig. 3
Composition of nine samples according to the values in the linearity validation panel of study design (A) and (B). In study design A, if the low-sample (S9) is not available, the blank sample can replace S9 if all four of the following conditions are satisfied: 1) The absolute value of ADL is less than LLoQ; 2) Numeric values (including negative values) should be provided for the measurement of the blank samples; 3) LLLI is equal to or greater than ADL; 4) S8 is both close to and larger than LLoQ. (Reprinted with permission from Clinical and Laboratory Standards Institute from: CLSI. Evaluation of Linearity of Quantitative Measurement Procedures. 2nd ed. CLSI guideline EP06. Clinical and Laboratory Standards Institute, 2020 [12]).
Abbreviations: LLLI, lower limit of linearity interval; ULLI, upper limit of linearity interval; LLoQ, lower limit of quantitation; ULoQ, upper limit of quantitation; ADL, allowable deviation from linearity.
lmo-14-3-163-f3.tif
Fig. 4
Composition of five samples according to the values in the linearity verification panel (A). If both the CVs% for the imprecision at the level of LLoQ and repeatability are low, the samples close to near LLoQ and ULoQ are available and verified AMI can be extended (B). However, the CVs% are high, the samples near LLoQ and ULoQ are not available and verified AMI can be narrowed. (Reprinted with permission from Clinical and Laboratory Standards Institute from: CLSI. Evaluation of Linearity of Quantitative Measurement Procedures. 2nd ed. CLSI guideline EP06. Clinical and Laboratory Standards Institute, 2020 [12]).
Abbreviations: LLoQ, lower limit of quantitation; ULoQ, upper limit of quantitation; CV, coefficient of variation; AMI, analytical measuring interval.
lmo-14-3-163-f4.tif
Fig. 5
The relationships between the ADLs and 90% CIs of the calculated deviations. (A) Acceptable: Both the deviation and 90% CIs are within the ADL; (B) Acceptable: The deviation is with the ADL, and the 90% CIs overlap with the ADL despite in spite of either upper or lower limit being is out of the ADL; (C) Acceptable: The deviation is out of the ADL, but either upper or lower limit of 90% CIs overlaps with the ADL (red). Even if the upper or lower limit of 90% CIs is the same as the ADL, it is determined as acceptable (green); (D) Unacceptable: The deviation is out of the ADL, and there is no overlap between the ADL and the 90% CIs.
Abbreviations: ADL, allowable deviation from linearity; CI, confidence interval.
lmo-14-3-163-f5.tif
Fig. 6
The relationship between AMI, EMI, and RI. For example, if a measurement procedure has performance characteristics of LLoD=1 ng/mL, LLoQ=2 ng/mL, ULoQ=10 ng/mL, and a maximally recommended dilution factor of 5, the AMI is 2-10 ng/mL, the EMI is 10-50 ng/mL, and the RI is 1-100 ng/mL. (Reprinted with permission from Clinical and Laboratory Standards Institute from: CLSI. Establishing and Verifying an Extended Measuring Interval Through Specimen Dilution and Spiking. 1st ed. CLSI guideline EP34. Wayne, PA: Clinical and Laboratory Standards Institute, 2018 [19]).
Abbreviations: AMI, analytical measuring interval; EMI, extended measuring interval; RI, reportable interval; LLoD, lower limit of detection; LLoQ, lower limit of quantitation; ULoQ, upper limit of quantitation.
lmo-14-3-163-f6.tif
Table 1
Comparison of EP06-A [11] and EP06-A2 [12] guidelines for evaluating linearity
Variable EP06-A (2003) EP06-ED2 (2020)
Validation and verification Not clearly separated Clearly separated
Requirements for validation 7–11 samples and 2–4 replicates 9 samples (recommended) and at least 4 replicates
Requirements for verification 5–7 samples and duplicates At least 5 samples and at least 2 replicates
Concentration ranges of samples Not specified Validation: relatively specified according to LI and AMI
Verification: differentiated according to the %CV
How to prepare linearity panels Mixing the low and high-level samples by considering the ratio Equal volume mixing, proportional mixing, or serial dilution
Method for analyzing the linearity* Best-fit polynomial regression
lmo-14-3-163-t1f1.tif
Weighted first-order (linear) regression
lmo-14-3-163-t1f2.tif
Acceptance criteria |%bias|≤%target
(or, absolute bias ≤absolute target in the low level)
Validation: |%deviation|≤%ADL
(%deviation: between measured mean value and predicted value after applying the weight)
Verification: if any of the upper and lower limits of 90% CIs of the %deviation overlaps with ADL

*The images were modified from the Laboratory Medicine, 6th ed. (Korean Society for Laboratory Medicine, 2021 [15]).

Abbreviations: LI, linearity interval; ADL, allowable deviation from linearity; AMI, analytical measuring interval; CV, coefficient of variation; CI, confidence interval.

Table 2
An example of linearity validation
Level RC Measured value Expected value (E)* Weight (W) Product 1 W∙Y∙E Product 2 W∙E2 Predicted value (P)§ Deviation|| %Deviation Within ±ADL?++
#1 #2 #3 #4 #5 Mean (Y)** SD
1 1 550.1 547.7 555.4 557.6 541.1 550.38 5.84 550.38 0.1464 44,362.03 44,362.03 536.70 13.68 2.5 Yes
2 0.9 465.2 455.1 450.6 460.1 465.5 459.30 5.78 495.34 0.1495 34,013.66 36,682.77 483.03 -23.73 -4.9 Yes
3 0.75 412.5 406.3 401.1 412.3 398.5 406.14 5.70 412.79 0.1541 25,841.06 26,263.85 402.53 3.61 0.9 Yes
4 0.6 321.2 318.1 320.0 321.1 325.6 321.20 2.47 330.23 0.8218 87,170.64 89,620.75 322.02 -0.82 -0.3 Yes
5 0.5 270.1 277.6 266.1 268.1 271.2 270.62 3.90 275.19 0.3285 24,462.58 24,875.68 268.35 2.27 0.8 Yes
6 0.4 208.1 207.5 210.1 215.5 207.8 209.80 2.99 220.15 0.5585 25,797.53 27,070.43 214.68 -4.88 -2.3 Yes
7 0.25 135.8 130.1 131.1 134.5 136.9 133.68 2.65 137.60 0.7141 13,135.35 13,520.04 134.18 -0.50 -0.4 Yes
8 0.15 85.1 86.3 82.3 83.5 84.1 84.26 1.36 82.56 2.6847 18,675.51 18,298.05 80.51 3.75 4.7 Yes
9 0.08 48.5 47.6 45.5 47.5 43.0 46.42 1.97 44.03 1.2868 2,630.08 2,494.69 42.94 3.48 8.1 Yes
10 0.05 29.0 30.1 29.9 26.2 26.5 28.34 1.67 27.52 1.7944 1,399.46 1,358.91 26.84 1.50 5.6 Yes
11 0.03 16.5 14.5 15.0 16.6 17.1 15.94 1.01 16.51 4.9485 1,302.41 1,349.10 16.10 -0.16 -1.0 Yes
SUM >278,790.31 >285,896.32
A 0.9751

*Expected value (E): the calculated value using the value of the high-level sample and RC. E=RC∙Y; W =R/(SD)2; A=(Sum of Product 1)/(Sum of Product 2); §Predicted value (P): the value after applying the weight. P=A∙E; ||Deviation=Y–P; %Deviation=100∙(Deviation)/P; **Mean (Y): mean of measured values for each level; ++If the ADL is 10% in this example, all of %deviation meets the goal.

Abbreviations: RC, relative concentration; SD, standard deviation; ADL, allowable deviation from linearity; R, replicate.

Table 3
An example of linearity verification
Level PH Measured value σ value Weight Predicted value (P) Deviation 90% CI ±ADL Overlaps with ±ADL
#1 #2 #3 Mean (M) SD Lower limit Upper limit
1 1 3,250 3,393 3,301 3,314.7 72.473 70.658 1/(70.658)2 3,234.93 79.74 -17.36 176.83 ±161.75 Acceptable
2 0.75 2,502 2,401 2,378 2,427.0 65.962 51.736 1/(51.736)2 2,435.03 -8.03 -79.12 63.06 ±121.75 Acceptable
3 0.5 1,619 1,650 1,639 1,636.0 15.716 34.874 1/(34.874)2 1,635.13 0.87 -47.05 48.79 ±81.76 Acceptable
4 0.25 788 790 799 792.3 5.859 16.890 1/(16.890)2 835.24 -42.90 -66.11 -19.69 ±41.76 Acceptable
5 0.1 331 340 342 337.7 5.859 7.198 1/(7.198)2 355.30 -17.63 -27.52 -7.74 ±17.76 Acceptable
6 0 35 36 35 35.3 0.577 1/(0.577)2 35.34 0.00 -0.80 0.79 ±1.77 Acceptable
A(WLS) 3,199.6 B(WLS) 35.336

Construct a function with no intercept: Y=S∙X (X-axis: M; Y-axis: SD)

When calculating the slope S using Microsoft Excel, use the command ‘LINEST((SD region), (M region),0)’ instead of the command ‘slope’ because it presupposes that there is a non-zero intercept.

Then, σ=S∙M

Construct a function of the least square linear regression: Y=A∙X+B (X-axis: PH, Y-axis: M)

When calculating the slope A using Microsoft Excel, use the command ‘LINEST((M region), (PH region)^2)’. And when calculating the intercept B using Microsoft Excel, use the command “SQRT(SUMSQ(Level 6 data)/3), where 3 is the number of replicates in this example.

Then, P=A∙PH+B

Deviation=M–P; 90% CI=Deviation±Z1α2αR;±ADL=M∙% ADL (in this example, the target %ADL was set to 5%)

Abbreviations: PH, the proportion of the high-level sample; SD, standard deviation; CI, confidence interval; ADL, allowable deviation from linearity; WLS, weighted linear square regression.

Table 4
An example of establishing the dilution factor
Sample Dilution factor % Sample Neat
100
1/2
50
1/4
25
1/10
10
1/20
5
A Observed 391.1 200.9 91.1 36.2 22.1
Target 391.1 195.6 97.8 39.1 19.6
%Recovery 100.0 102.7 93.2 92.6 113.0
B Observed 306.0 151.9 79.4 33.1 16.2
Target 306.0 153.0 76.5 30.6 15.3
%Recovery 100.0 99.3 103.8 108.2 105.9
C Observed 357.4 185.2 85.8 39.9 20.1
Target 357.4 178.7 89.4 35.7 17.9
%Recovery 100.0 103.6 96.0 111.6 112.5
D Observed 361.2 171.1 83.4 39.1 16.5
Target 361.2 180.6 90.3 36.1 18.1
%Recovery 100.0 94.7 92.4 108.3 91.4
E Observed 388.6 190.1 95.9 35.8 21.2
Target 388.6 194.3 97.2 38.9 19.4
%Recovery 100.0 97.8 98.7 92.1 109.1
Mean %Recovery 100.0 99.6 96.8 102.5 106.4
SD of %Recovery 0.00 3.64 4.64 9.42 8.87
N 5 5 5 5 5
t-test 2.776 2.776 2.776 2.776 2.776
SE 0.00 1.63 2.07 4.21 3.97
Upper 97.5% CL 100.0 104.2 102.6 114.2 117.4
Lower 2.5% CL 100.0 95.1 91.1 90.9 95.4

Target value=(Value of neat sample)∙(Dilution factor); %Recovery=100∙(Observed value)/(Target value).

Mean and SD %Recovery are the values calculated using the %recoveries of 5 samples in each dilution factor.

From Appendix B of EP34-ED1 [19], the t-test value for N=5 is 2.776.

SE=SD/(√n); Upper 97.5% CL=mean %recovery+SE∙(t-test value); Lower 2.5% CL=mean %recovery–SE∙(t-test value).

If the goal of %recovery is 10%, the mean %recovery for all dilution factors satisfies the goal. However, in this example, the 97.5 upper CL or the 2.5 lower CL in 1/10 and 1/20 dilutions do not satisfy the goal. Therefore, 1/10 and 1/20 dilution factors cannot be used, and the maximum dilution factor established is 1/4.

Abbreviations: SD, standard deviation; SE, standard error; CL, confidence limit.

Table 5
An example of spiking-recovery study
Sample Test Rep #1 Rep #2 Mean Diff %Recovery Mean %Recovery
A Spiked with pure solvent 10.7 11.3 11.0 1.90 95.0 93.3
Spiked with spiking solution 12.7 13.1 12.9
B Spiked with pure solvent 10.8 10.9 10.9 1.75 87.5
Spiked with spiking solution 12.5 12.7 12.6
C Spiked with pure solvent 11.1 11.4 11.3 1.95 97.5
Spiked with spiking solution 13.1 13.3 13.2

This example was extracted from the 1st edition of ‘Practical Handbook of Laboratory Medicine’ [16].

For example, when 0.05 mL of a 40-mg/dL spiking solution is added to 0.95 mL of serum, the added concentration of analyte is 40∙(0.05/1)=2 mg/dL.

Perform multiple measurements on each test sample (samples spiked with pure solvent, and samples spiked with spiking solution), and calculate the difference between the sample spiked with spiking solution and the sample spiked with pure solvent. In this example, the %recovery=100∙(calculated difference) / (expected difference), and the expected difference is 2 mg/dL. Then, compare the mean %recovery to the target %recovery.

Table 6
Examples of the validation of EMI for (A) automated dilution and (B) manual dilution
(A) Dilution factor Instrument Replicates Sample 1
100.1
Sample 2
95.5
Sample 3
120.3
Sample 4
106.7
Sample 5
110.00
1/10 Instrument 1 Rep #1 10.5 8.8 11.1 11.5 12.0
Rep #2 9.8 8.5 11.5 11.7 11.8
Rep #3 9.2 8.2 12.0 11.8 11.7
Rep #4 9.7 8.9 12.1 11.1 11.5
Instrument 2 Rep #1 8.9 8.7 12.5 11.6 12.1
Rep #2 9.1 8.6 13.1 11.7 11.0
Rep #3 9.3 9.0 12.8 12.0 11.8
Rep #4 9.9 9.1 12.9 11.0 11.6
Mean 9.55 8.73 12.25 11.55 11.69
Estimate 95.5 87.3 122.5 115.5 116.9
Reference value 100.1 95.5 120.3 106.7 110.0
%Recovery 95.4 91.4 101.8 108.2 106.3
(B) Dilution factor Inspector Dilution Replicates Sample 1
100.5
Sample 2
220.7
Sample 3
506.1
Sample 4
731.2
Sample 5
987.6
1/10 Inspector 1 Dilution 1 Rep #1 11.1 23.5 50.6 70.1 91.7
Rep #2 10.8 22.1 49.8 71.1 93.1
Dilution 2 Rep #1 10.6 20.9 48.5 72.6 92.9
Rep #2 11.3 21.1 49.1 70.9 91.8
Inspector 2 Dilution 1 Rep #1 10.9 20.5 51.2 69.7 90.2
Rep #2 10.6 22.1 52.1 68.9 90.9
Dilution 2 Rep #1 11.1 20.6 50.1 69.1 93.6
Rep #2 11.4 20.8 50.2 69.5 92.5
Mean 10.98 21.45 50.20 70.24 92.09
Estimate 109.8 214.5 502.0 702.4 920.9
Reference value 100.5 220.7 506.1 731.2 987.6
%Recovery 109.2 97.2 99.2 96.1 93.2

Abbreviation: EMI, extended measuring interval.

TOOLS
Similar articles