Journal List > Anat Cell Biol > v.57(2) > 1516087509

Ndou, Perry, and Dlamini: Diabetes disrupts osteometric and trabecular morphometric parameters in the Zucker Diabetic Sprague–Dawley rat femur

Abstract

Type 2 diabetes mellitus is increasingly becoming more prevalent worldwide together with hospital care costs from secondary complications such as bone fractures. Femoral fracture risk is higher in diabetes. Therefore, this study aimed to assess the osteometric and microarchitecture of the femur of Zucker Diabetic Sprague–Dawley (ZDSD) femur. Ten-week-old male rats (n=38) consisting of 16 control Sprague–Dawley (SD) and 22 ZDSD rats were used. The rats were terminated at 20 weeks and others at 28 weeks of age to assess age, diabetes duration effects and its severity. Bilateral femora were taken for osteometry, bone mass measurements and micro-focus X-ray computed tomography scanning to assess the trabecular number (TbN), thickness (TbTh), spaces (TbSp), bone tissue volume to total volume (BV/TV) and volume (BV). Diabetic rats had shorter (except for 20-weeks-old), lighter, narrower, and less robust bones than SD controls that wered more robust. Although cortical area was similar in all diabatic and control rats, medullary canal area was the largest in ZDSD rats. This means that the diabetic rats bones were short, light and hollow. Diabetic rats aged 20 weeks had reduced BV, BV/TV, TbN with more spacing (TbSp). In contrast, the 28 weeks old diabetic rats only showed reduced BV and TbN. Discriminant function analysis revealed, for the first time, that osteometric parameters and TbTh, TbN, and TbSp were affected by diabetes. This knowledge is valuable in the management of diabetic complications.

Introduction

Diabetes mellitus is a long-lasting condition characterized by persistent hyperglycemia consequent of a syndrome of metabolic disorders [1]. The global diabetes prevalence is projected to rise from 9.3% (463 million people) to reach 10.9% (700 million) by 2045 [2, 3]. Diabetes mellitus is classified into several subtypes such as gestational, type 1, type 2 diabetes mellitus, with the latter being most common at 90%–95% of all those diagnosed with diabetes [1]. Despite being non-communicable and preventable, type 2 diabetes mellitus remains among the sources of immense financial liabilities on health and social services especially in developing countries [4] as the complications require multidisciplinary treatment and management.
Complications of type 2 diabetes mellitus involve multiple organs, resulting in cardiovascular disease [5, 6], retinopathy [7], polyneuropathy [8], nephropathy [5], and skeletopathy [5, 9]. Despite evidence pointing towards the link between hyperglycemia and susceptibility to osteoporosis, fractures, mal-unions and non-unions [5, 10], diabetic skeletopathy has received negligible research [5, 11].
Various, studies elucidate the association between type 2 diabetes mellitus and increased fracture risk [12-14]. These studies analyse bone strength using 3 point bending tests, micro-focus X-ray computed tomography (Micro CT) and various osteometric tools to study the effect of type 2 diabetes mellitus on bone [9, 15, 16]. Research has consistently been shown that toughness of cortical bone decreases as diabetes progresses [16]. An early age onset of diabetes impairs bone growth and maintains structural deficit in later stages of diabetes [9]. This results in bone fragility is due to poor bone mineral density, and alteration of bone geometry, trabecular microarchitecture, and bone mechanical properties [15]. Previous studies tend to omit bone mass and robusticity when assessing bone strength. These parameters are included in the present study because whole bone structural strength is influenced by its mass, shape and size, and micro architectural organization [16-19].
We have previously reported on the diabatic bone perturbation of osteoblastic activity which elucidate how diabetes compromises bone health [20]. This involves as increase in osteolysis through an elevated number of osteocytes. This is accompanied by low expression of the osteogenic cytokine, transforming growth factor β-1 with more of the antagonistic morphogenic protein-3 which reduces osteoblastogenesis [20].
This study aimed to evaluate the microarchitecture of the femur of Zucker Diabetic Sprague–Dawley (ZDSD) rats at 20 and 28 weeks of age. This was done by assessing bone osteometry, midshaft cortical and medullary canal areas as well as femoral head trabecular morphological parameters. Further investigations were undertaken understand if perturbations caused by type 2 diabetes mellitus are age dependent, by comparing femora of 20-week with those from 28-week-old rats.

Materials and Methods

Ethics clearance

Ethics approval for the study has been granted by the University of the Witwatersrand Animal Ethics Committee (AESC 2015/07/28/C) and their guidelines for animal handling and care were followed.

Study rats

In this study, 38 male rats consisting of 16 Sprague–Dawley (SD) and 22 ZDSD rats were used. The SD rats, which served as controls were sourced from the Central Animal Services (CAS) University of the Witwatersrand. The ZDSD rats came from PreClinomics, Indianapolis, Indiana, USA. The SD rats were used as the non-diabetic controls because they are the parental strains of the ZDSD rats [15]. All rats were housed one per cage, maintained under pathogen free conditions, in a temperature-controlled environment of 23°C±2°C under a 12-hour light and dark cycle.

Grouping

The rats were grouped according to strain and age at termination. SD (n=8) and ZDSD (n=7) rats were terminated at 20 weeks of age. These were designated as SD20WK and ZDSD20WK, respectively. Another batch of SD rats (n=8) designated SD28WK, and 15 ZDSD rats were terminated at 28 weeks of age. The latter were further divided into moderate diabetes (ZDSD28WK-MOD, n=9) and severe diabetes (ZDSD28WK-SVD, n=6) groups as follows: 1) moderately diabetic (ZDSD28WK-MOD) rats terminated at 28 weeks of age that had >8.0 mmol/L fasting blood glucose. 2) Severely diabetic rats (ZDSD28WK-SVD) had >11.2 mmol/L fasting blood glucose.

Rat diet

All rats were given water and fed ad libitum a standard Purina 5008 chow (Lab diet), ad libitum. At 15 weeks, the ZDSD rats were changed into a high fat diet (5SCA; Test diet) for 6 weeks to synchronize the onset of hyperglycemia in the ZDSD rats [15].

Blood tests

Fasting blood glucose

Rats were fasted for 12 hours overnight prior to blood glucose measurements. A glucometer (Performa Accutrend; Roche Diagnostics) was used to measure fasting blood glucose every 2 weeks.

Insulin test

Intracardiac blood was aspirated at termination and collected into serum separating tubes, then centrifuged at 3,000 rpm for 10 minutes. Serum was decanted into aliquots that were stored at –80°C for serum analysis of insulin by ELISA (Insulin ELISA kit; Elabscience).

Statistical analysis

The data were managed in Microsoft Excel Office 365 (Microsoft) and analysed using SPSS® version 28 (IBM Co.). ANOVA with LSD post-hoc was used for multiple group comparisons of means in respect of the blood glucose, insulin, osteometric, trabecular morphometric parameters as well as the cortical and medullary midshaft areas. Discriminant function analysis (DFA) was conducted to detect group separation based on age and diabetic status and to determine the rat femora variables are most affected by diabetes mellitus. Data were reported as mean and standard deviation. Significance level was set at P<0.05.

Termination and bone harvesting

Animals were injected with a lethal intraperitoneal dose of phenobarbital. Femora were removed, and muscles and ligamentous attachments cleaned out. Individual bones were then stored in 10% buffered formalin for fixation until further processing.

Micro-focus X-ray computed tomography

For Micro CT, bilateral femora were scanned using a Nikon XTH 225/320 LC X-ray microtomography scanner. The bones were mounted in low density Styrofoam that allows X-rays to penetrate the sample with negligible absorption. The mounted sample was positioned on a 360 degrees rotating manipulator in the scanning chamber. The scanning voltage was 70 kv, the X-ray current was 400 μa, with a frame averaging of 4 and a resolution of 18 μm, taking approximately 8 minutes per scan.

Parts of the femur and trabecular morphometry parameters studied

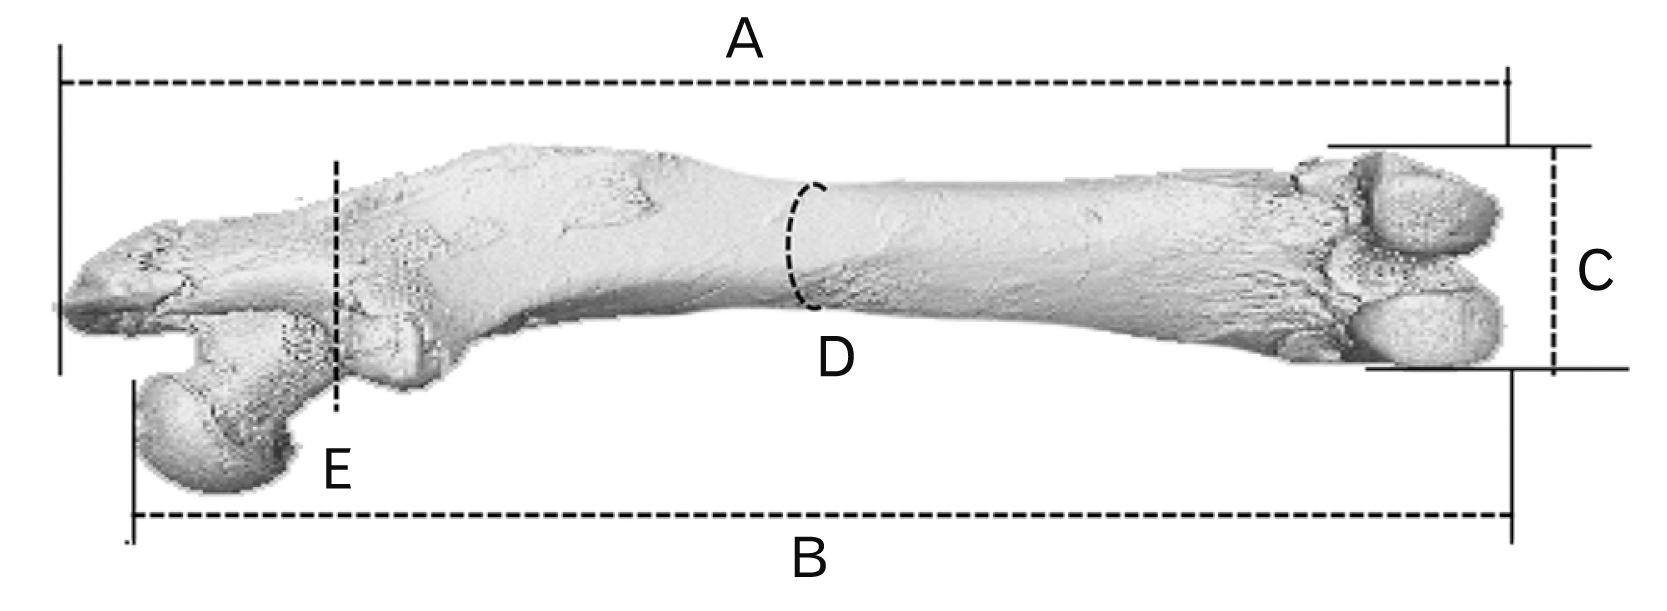
Bones were weighed and a digital calliper was used to measure femoral osteometric parameters (Fig. 1 and Table 1). Following reconstruction, VG studio Max® 3.2 (Volume Graphics GmbH) was used for data analysis as previously described [21]. The trabecular morphometric parameters were studied in the proximal epiphysis of the bone (Fig. 1 and Table 2).

Results

Fasting blood glucose

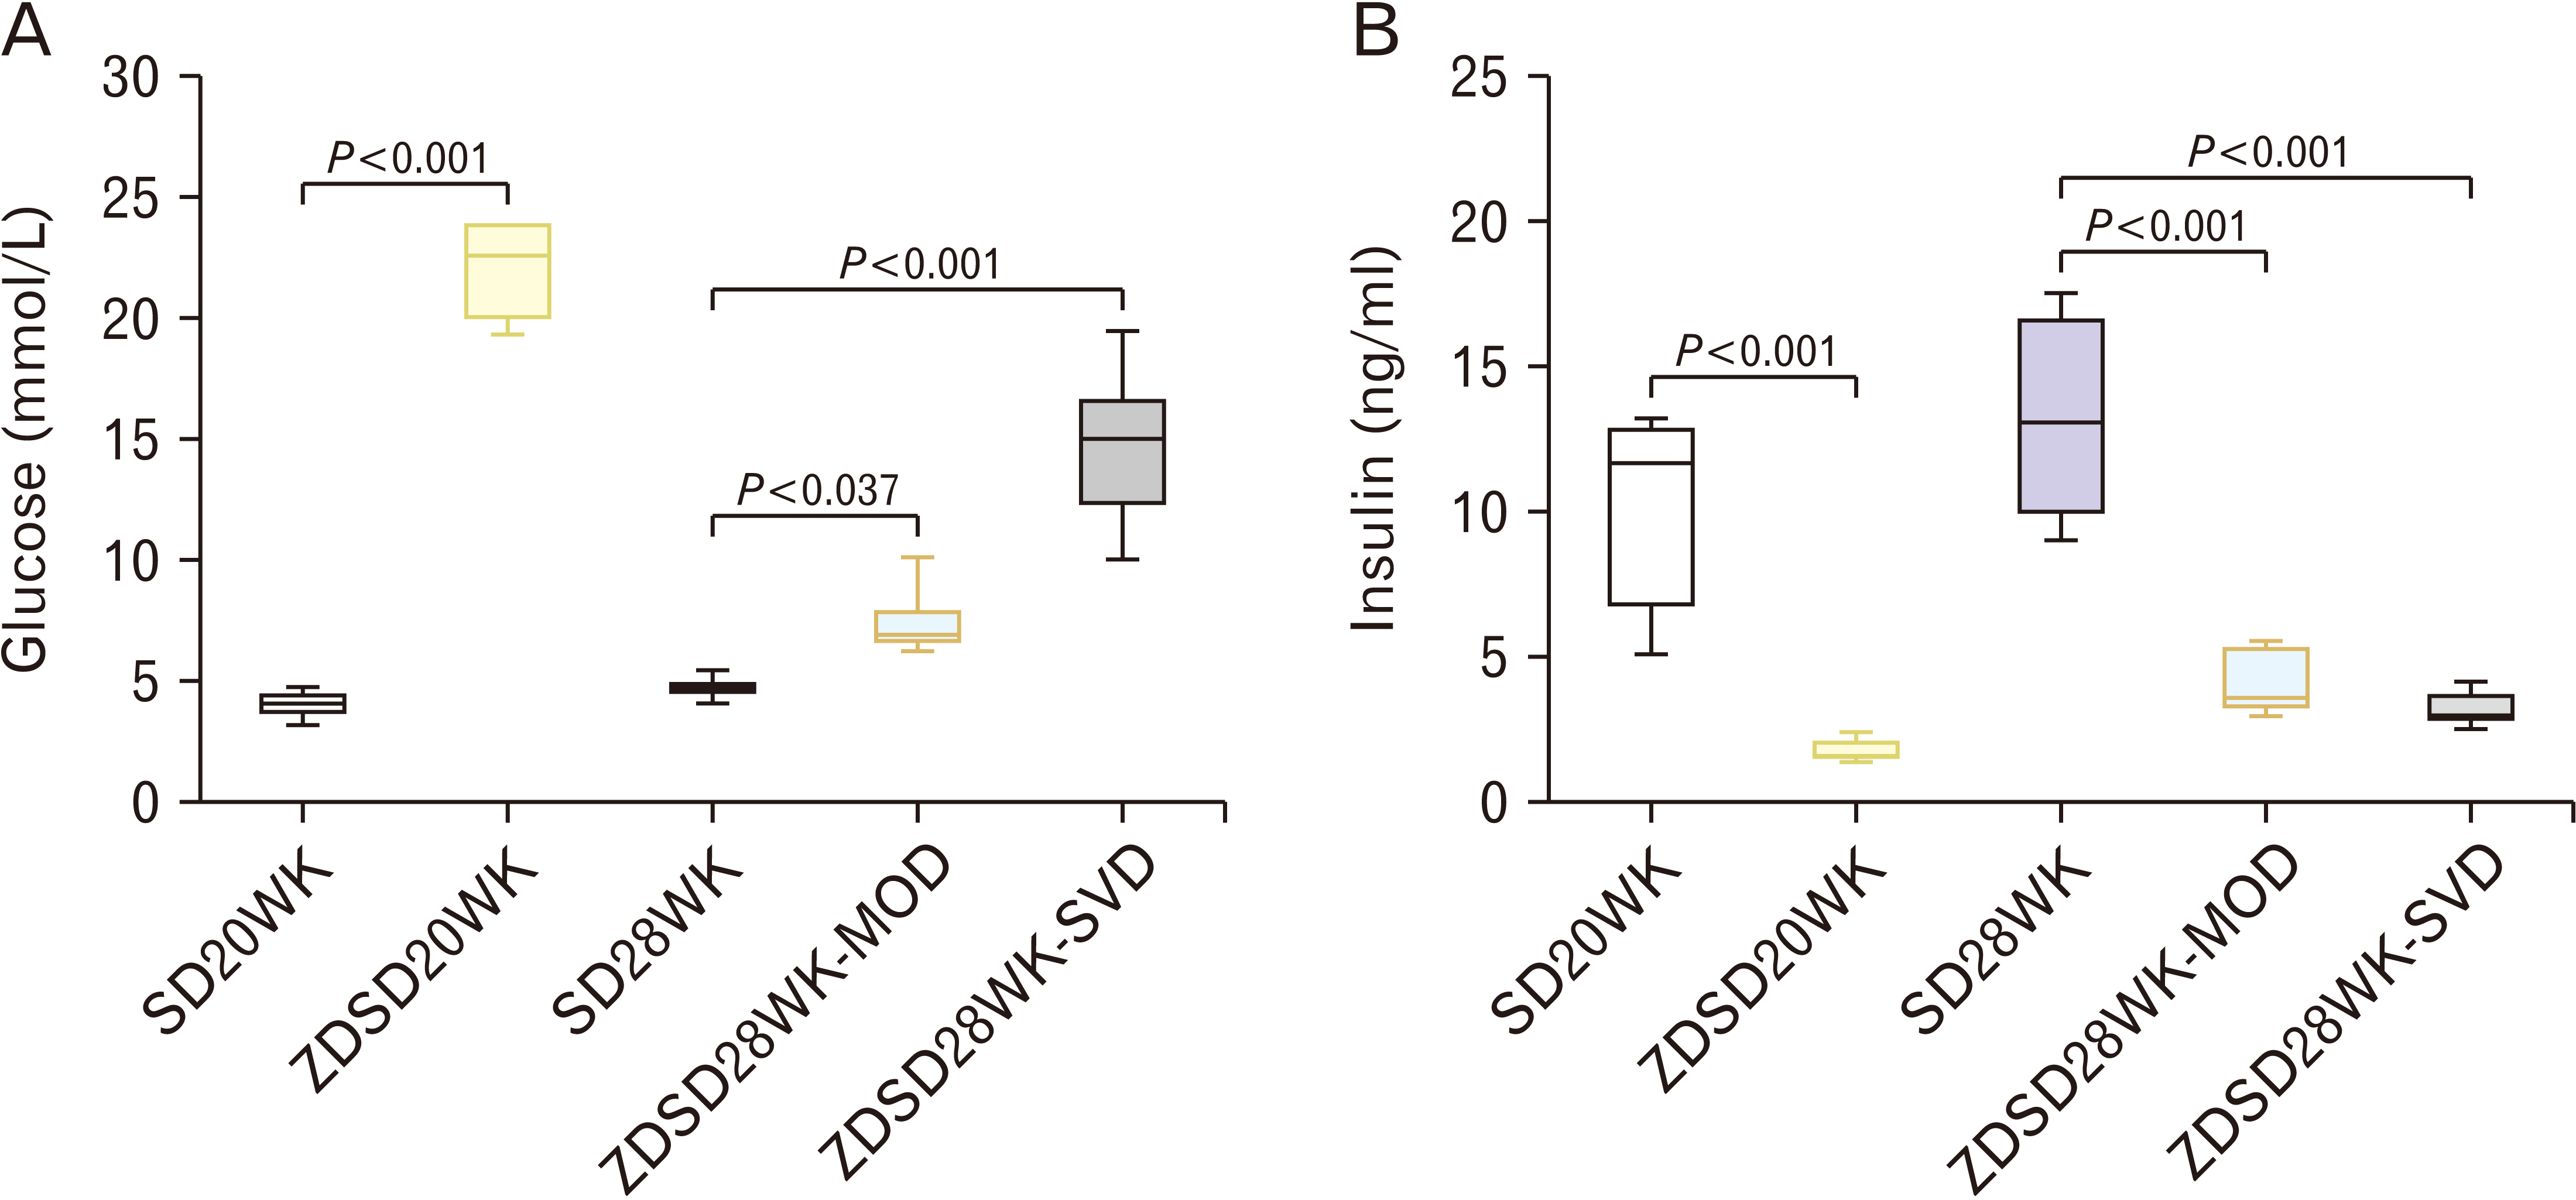
Significant differences were observed between the 20-week controls (5.7 mmol/L) and their age matched diabetic group (7.70 mmol/L) from week 12 (P=0.001) until week-20, with the diabetic group (22.07 mmol/L) exhibiting higher numbers compared to their controls (4.07 mmol/L) (P<0.001) (Fig. 2A). The 28-week controls (5.1±0.41 mmol/L) exhibited lower values compared to moderately diabetic (8.1±0.57 mmol min/dl) and severely diabetic (8.55±1.66 mmol/L) (P<0.001 for both) at week-12 (Fig. 2B). The same trend is shown at week-28, with 28-week controls (4.99±0.31 mmol/L) recording lower glucose levels compared to moderately diabetic (7.11±0.13 mmol/L) and severely diabetic (13.38±1.61 mmol/L) (P=0.019, P<0.001, respectively) (Fig. 2A).

Insulin levels

The 20-week controls (10.45±3.66 ng/ml) exhibited significantly higher insulin levels compared to their age matched diabetic group (1.70±0.48, 10.45 ng/ml) (P<0.001) (Fig. 2B). This trend is repeated at 28 weeks, with the controls (13.24±3.63 ng/ml) recording higher insulin levels relative to moderately diabetic (4.07±1.20, 10.45 ng/ml) and severely diabetic group (3.10±0.70, 10.45 ng/ml) (P<0.001 respectively) (Figs. 2B, 3).

Femur osteometry at week-20 and week-28

Bone mass

At 20 weeks of age, the ZDSD femora weighed significantly less than their SD controls (P<0.001) (Table 3). The same trend was observed at week-28, with the moderately diabetic and the severely diabetic group recording significantly lower values than their SD controls (P=0.005 and P<0.001, respectively.). The SD controls exhibited age related differences, with bones of older rats (age of 28 weeks) weighing significantly less than the 20-week-olds (P<0.001) (Table 3). Similarly, ZDSD femora weighed less at 28 weeks (moderately and severely diabetic groups) compared to those of 20-week-old ZDSDs (P=0.020 and P=0.014, respectively).

Full bone length

Similarities in full femoral length were observed among 20-week-old rats between the ZDSDs and SD controls (P=0.545) (Table 3). In contrast, at the age of 28 weeks, both the moderately and severely diabetic groups exhibited significantly shorter lengths compared to their SD controls (P<0.001, for both comparisons). Age differences were observed in SD controls between rats aged 20 and those aged 28 weeks, younger (20 weeks) SDs had shorter bones than older rats (P=0.001) (Table 3). In contrast, ZDSD full femoral length was similar at 20 weeks of age compared to the 28-week-old groups (moderately diabetic P=0.354 and severely diabetic P=0.059).

Biomechanical length

There were similarities in biomechanical length values between 20-week-old rats when comparing SD controls with ZDSDs (P=0.584) (Table 3). In contrast, among the 28-week-old rats, the moderately and severely diabetic groups exhibited shorter biomechanical lengths than their SD controls (P<0.001 and P=0.003, respectively). Similarities in biomechanical length were observed in 20-week-old SDs and 28-week-old SDs (P=0.105) (Tables 3 and 4). On the contrary, age differences were observed between the moderately and severely diabetic groups, with younger (20-week-old) ZDSDs having longer biomechanical lengths (P=0.024 and P<0.001, respectively).

Midshaft mediolateral diameter

At 20 weeks of age, midshaft mediolateral diameters were significantly larger in ZDSDs compared to SD controls (P<0.001) (Table 3). Similarly, 28-week-old rats showed that both the moderately and severely diabetic groups exhibited larger measurements when compared with 28-week-old SD controls (P<0.001 for both comparisons). No age-related differences were observed between 20-week-old and 28-week SD controls (P=0.188) (Table 3). On the contrary, 20-week-old ZDSDs exhibited wider diameters when compared with the moderately and severely diabetic groups in this region (P<0.001 for both comparisons).

Bicondylar width

At week-20, ZDSDs exhibited significantly shorter bicondylar widths compared to SD controls (P<0.001) (Table 3). This significant trend of shorter bicondylar widths continued and was observed at week-28 when comparing the moderately and severely diabetic (P=0.003 and P<0.001, respectively) with their SD controls. Age related differences were observed between the SD groups, where younger SDs (20-week-olds) had wider condyles than the 28-week-old SDs (P<0.001) (Table 3). Younger ZDSDs (20-week group) exhibited bicondylar width similar to older groups (moderately and severely diabetic P=0.200 and P=0.051, respectively).

Robusticity Index

At week-20, the SD controls were significantly more robust than the ZDSDs (P=0.002) (Table 3). This trend was maintained at week-28, where SD controls were more robust than the moderately and severely diabetic groups (P<0.001 for both comparisons). Younger (20-week-old) SDs were significantly more robust than older (28-week-old) SDs (P=0.003) (Table 3). The same trend was observed in the ZDSD group, where younger (20-week-old) ZDSDs were more robust than older rats (28-week-old moderately and severely diabetic P<0.001 for both comparisons).

Proximal femur trabecular morphometry at week-20 and week-28

Bone volume (BV)

At 20 weeks of age, the ZDSDs exhibited lower bone volume (BV) ratios than their SD controls (P<0.001) (Table 4). The same trend was observed with the moderately and severely diabetic groups recording significantly lower values than their SD controls (P=0.002 for both comparisons) No age-related differences were observed in BV between 20-week-old and 28-week SD controls (P=0.116) (Table 4). This trend of similar BV ratios was also observed in ZDSD groups, when comparing 20-week-old ZDSDs with 28-week-old ZDSD groups (moderately diabetic P=0.505 and severely diabetic P=0.604).

Bone tissue volume to total volume (BV/TV)

The 20-week-old ZDSDs had lower bone tissue volume to total volume (BV/TV) ratios when compared with their SD controls (P<0.001) (Table 4). In contrast, similarities with SD controls were observed in 28-week-old rats for both the moderately and severely diabetic groups (P=0.944, P=0.955, respectively). Older (28-week-old) SDs had lower BV/TV ratios when compared with 20-week-old SD controls (P<0.001) (Table 4). On the contrary, ZDSD BV/TV ratios were similar at 20-weeks of age compared to the 28-week-old groups (moderately diabetic P=0.828 and severely diabetic P=0.936).

Trabecular thickness

Similarities were observed in trabeculae thickness when comparing 20-week-old ZDSDs with their age matched SD controls (P=0.692) (Table 4 and Fig. 3). In contrast, among the 28-week-old rats, the moderately and severely diabetic groups exhibited thinner trabeculae than their SD controls (P=0.002 and P=0.001, respectively). Age differences were observed in SD controls between animals aged 20 and those aged 28 weeks), with younger (20 weeks) having thinner trabeculae (P=0.001) (Table 4). On the contrary, trabecular thickness was similar among ZDSDs when comparing 20-weeks with 28-week-old groups (moderately diabetic P=0.403 and severely diabetic P=0.842).

Trabecular number

The 20-week-old ZDSDs had fewer trabeculae numbers when compared with their SD controls (P<0.001) (Table 4 and Fig. 3). In contrast, similarities with SD controls were observed in 28-week-old rats for both the moderately and severely diabetic groups (P=0.884, P=0.368 respectively). Older (28-week-old) SDs had fewer trabeculae when compared with 20-week-old SD controls (P<0.001) (Table 4 and Fig. 3). On the contrary, ZDSD trabeculae numbers were similar at 20-weeks of age compared to the 28-week-old groups (moderately diabetic P=0.639 and severely diabetic P=0.740).

Trabeculae spacing

The 20-week-old ZDSDs had more trabeculae spaces (TbSp) when compared with their SD controls (P=0.050) (Table 4 and Fig. 3). In contrast, similarities with SD controls were observed in 28-week-old rats for both the moderately and severely diabetic groups (P=0.851, P=0.858, respectively). Older (28-week-old) SDs had more TbSp when compared with 20-week-old SD controls (P<0.001) (Table 4 and Fig. 3). On the contrary, ZDSD trabeculae numbers were similar at 20-weeks of age compared to the 28-week-old groups (moderately diabetic P=0.115 and severely diabetic P=0.143) (Table 4 and Fig. 3).

Femoral mid diaphysis cortical area and medullary canal area at week-20 and week-28

Cortical area

The 20-week-old ZDSDs had a similar cortical area when compared with their SD controls (P=0.056) (Table 4). The same trend was observed in 28-week-old SD controls when compared with the moderately and severely diabetic groups (P=0.164, P=0.635, respectively). No age-related differences were observed in cortical area between 20-week-old and 28-week SD controls (P=0.619) (Table 5). This trend of a similar area was also observed in when comparing 20-week-old ZDSDs with 28-week-old moderately diabetic (P=0.226), but not the severely diabetic (P=0.005) that had a larger cortical area.

Medullary canal area

At week-20, the ZDSDs had a larger medullary canal area when compared with their SD controls (P<0.001) (Table 4). The same trend was observed when comparing 28-week-old SD controls with the moderately diabetic (P=0.011). However, the severely diabetic (P=0.146) showed similarities to 28-week-old SD controls (Table 4). No age-related differences were observed in medullary canal area between 20-week-old and 28-week SD controls (P=0.161) (Table 4). This trend of similar medullary canal area was also observed in ZDSD groups, when comparing 20-week-old ZDSDs with 28-week-old ZDSD groups (moderately and severely diabetic groups, P=0.733 and P=0.202, respectively).

Parameters of the femur most affected by age, diabetes, and its duration

DFA was conducted to determine the femoral variables that are influenced by age, diabetes, and its duration. The structure matrix showed that robusticity index, midshaft mediolateral diameter, bicondylar width (mm), midshaft medullary area, bone mass, midshaft cortical area and trabeculae thickness (TbTh) were the main factors influenced (Table 5).
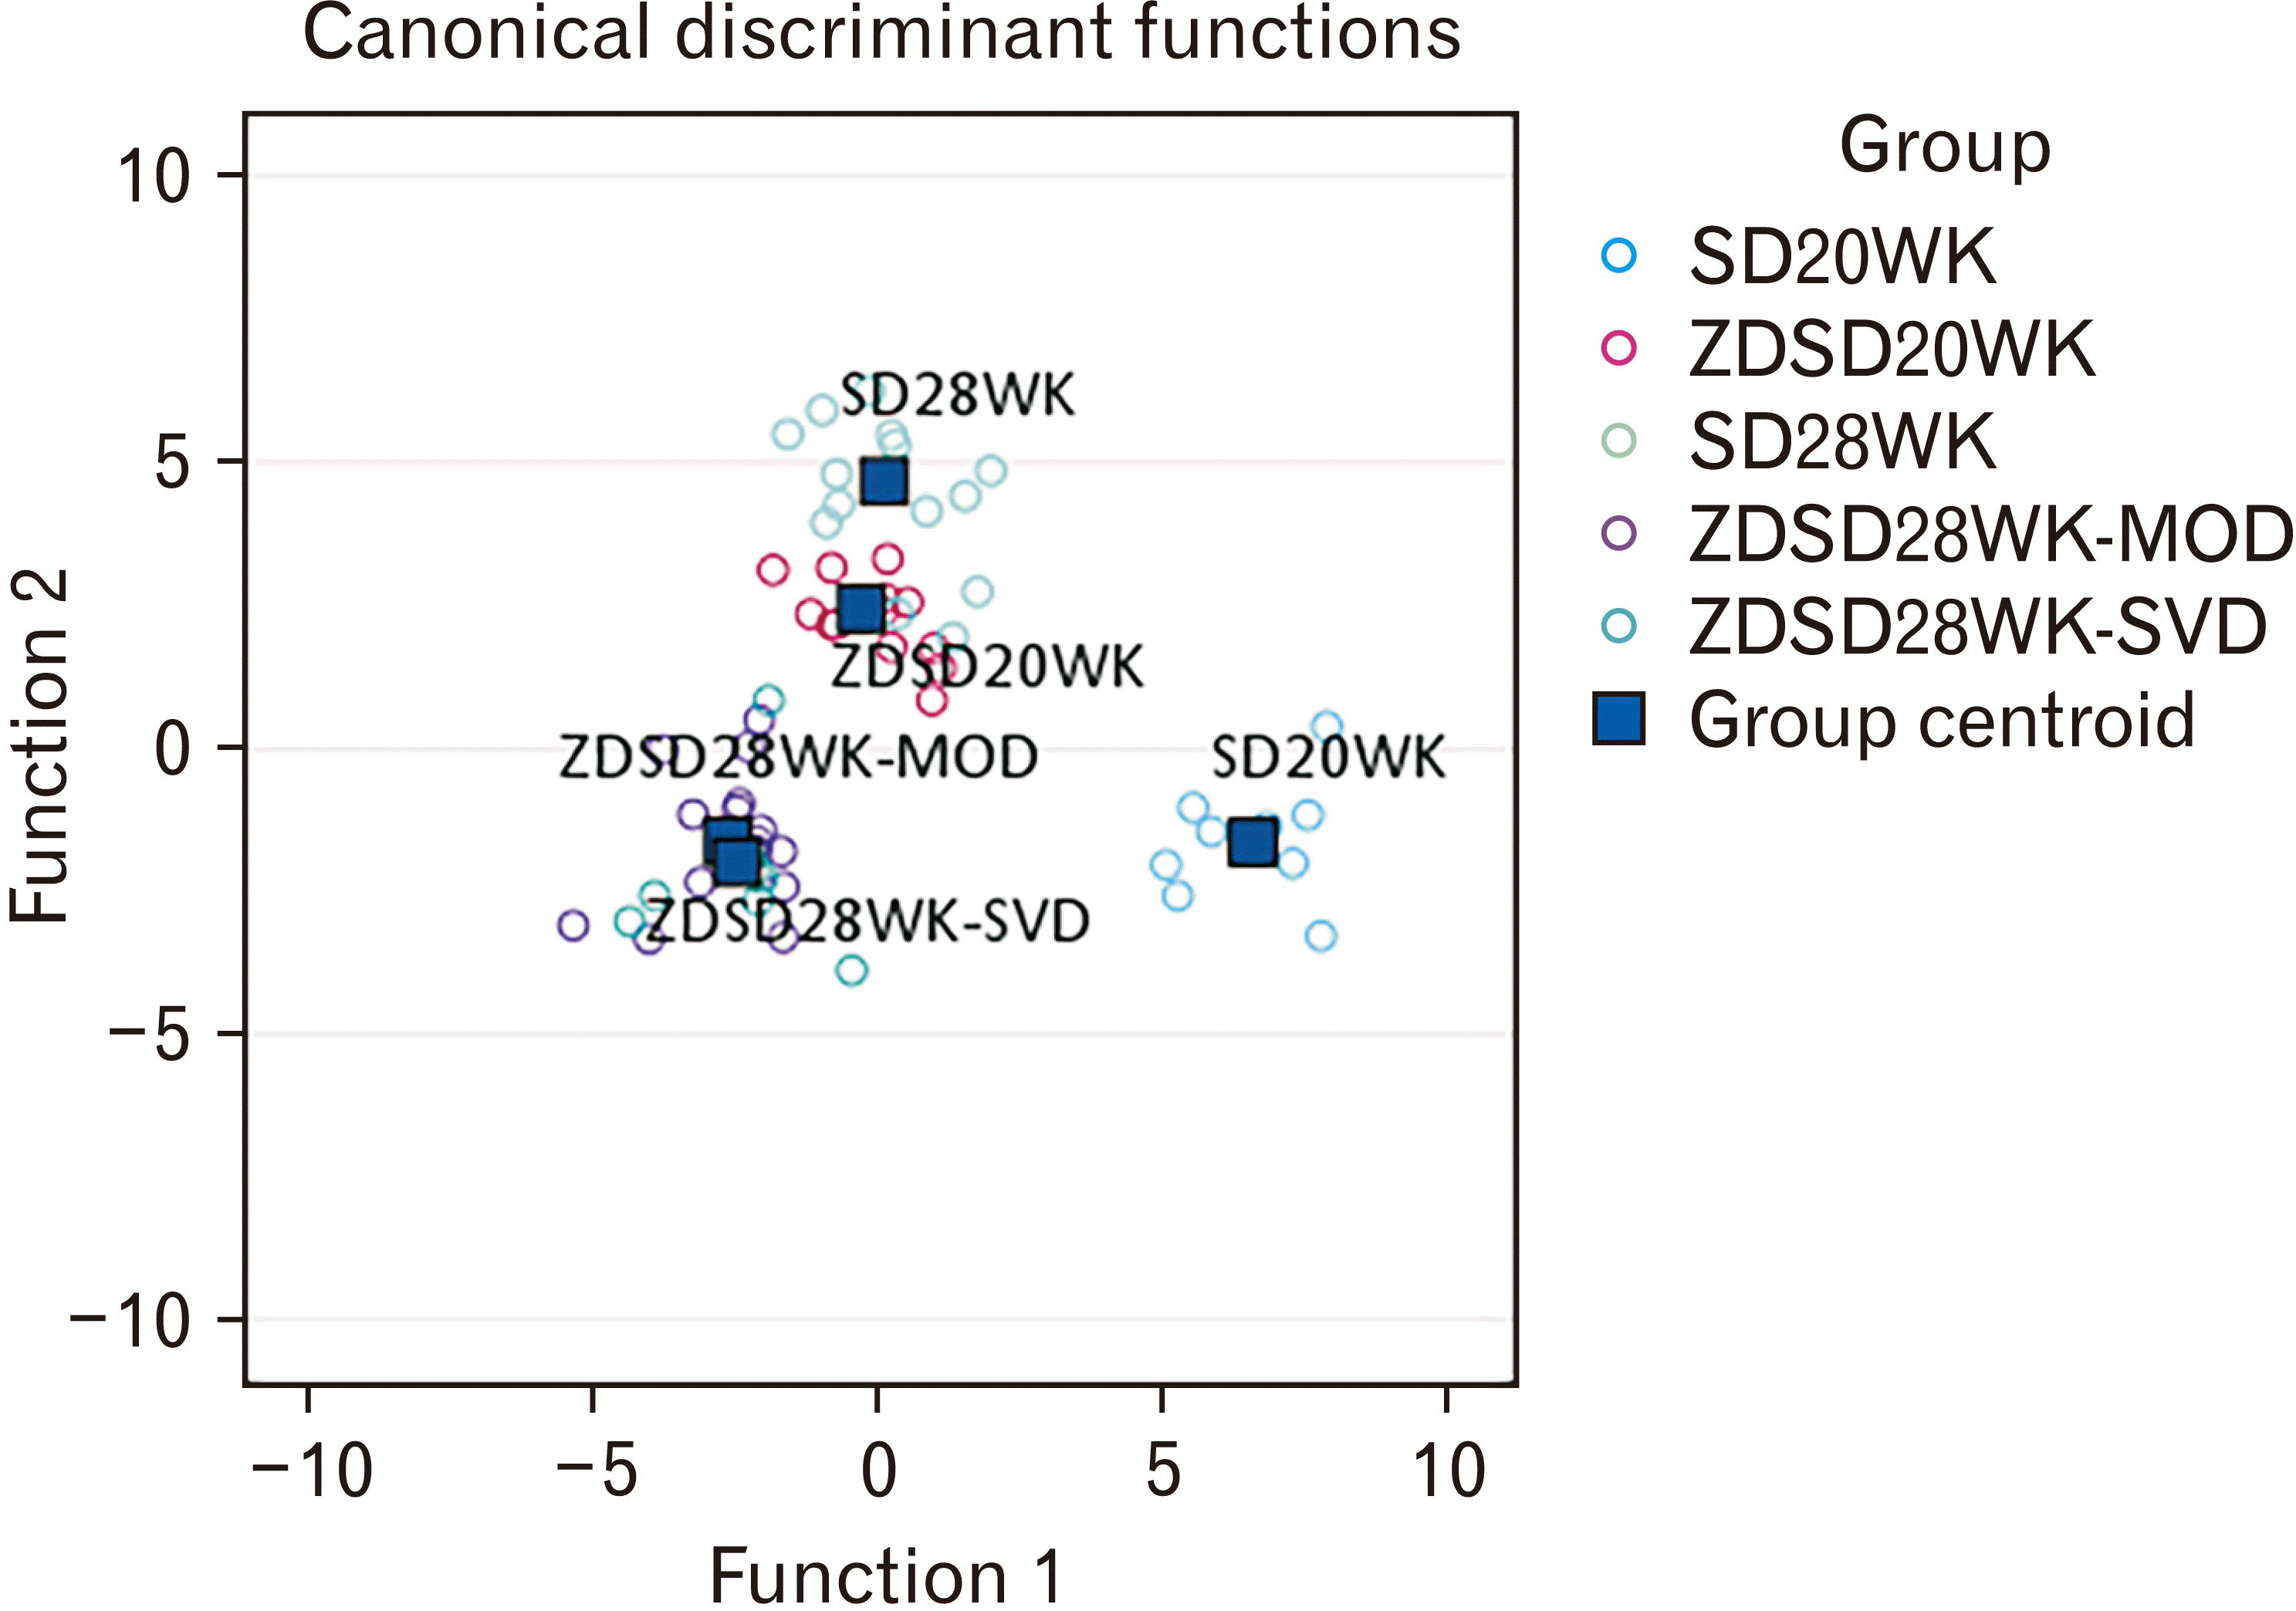
The discriminant analysis yielded 4 functions, although the Wilk’s lambda results indicate a good fit for only functions 1, 2, and 3 (Wilk’s lambda=0.003, 0.038, 0.314 for functions 1, 2, and 3, respectively) (P<0.001). Function 4 was not significant (P=0.091). Function 1 accounted for 58.7% of the variability, function 2 accounted for 33.4% whereas function 3 accounted for only 6.1% (Table 5). For the cross-validated classification, 79.4% of femora were correctly classified according to their diabetic (ZDSD) and control (SD) group status as well as age in the respective groupings. Among the SD control groups, the model correctly classified 100% of the femora as belonging to the 20-week control group (SD20WK) and 85.7% as belonging to the 28-week control group (SD28WK) (Table 6 and Fig. 4). Among the diabetic groups, the model could correctly classify all (100%) of the femora belonging to the 20-week diabetic group (ZDSD20WK), nearly two thirds (64.7%) of the femora being correctly classified as belonging to the moderately diabetic group (ZDSD28WK-MOD) and 50% for the severely diabetic (ZDSD28WK-SVD) (Table 6 and Fig. 4).

Discussion

This study investigated whether diabetes would affect osteometric measurements, midshaft cortical and medullary canal areas as well as proximal femoral epiphysis trabecular morphological parameters. Further investigations assessed whether perturbations caused by diabetes mellitus were dependent on diabetes severity status or age. Diabetic rats had shorter (except for 20-weeks-old), lighter, narrower, and less robust bones compared to SD controls that exhibited more robust bones. This observation suggests a diabetes induced loss of growth in length and girth of the femur with duration of diabetes. Although cortical area was similar in all diabatic and control rats, medullary canal area were the largest in ZDSD rats. This means that the diabetic rats bones were short, light and hollow. Diabetic rats aged 20 weeks had reduced BV, BV/TV, trabecular number (TbN) with more spacing (TbSp). In contrast, the 28 weeks old diabetic rats only showed reduced BV and TbN. DFA revealed, for the first time, that osteometric parameters of the rat femur were affected by age, diabetes, and its duration.

Osteometric aspects

The femora had similar biomechanical and full lengths at the age of 20 weeks when comparing the diabetic group with controls, although the ZDSDs had a smaller midshaft mediolateral and bicondylar widths. More pronounced changes occurred among the 28-week-old groups in which femora were shorter in the diabetic groups, smaller bone lengths, as well as smaller midshaft mediolateral and bicondylar widths. This suggests that the effect of diabetes on osteometric dimensions worsened with prolonged untreated hyperglycemia. The osteometric measurements gave an estimate of size which was corroborated by mass, that was lower in both diabetic rats, at the age of 20 weeks and later at 28 weeks. This means that diabetes adversely affected bone size. Previous studies on diabetic ZDSD and ZDF rats also observed similarities in bone structure for younger rats (early stages of diabetes) [15], and reduced femoral bone size and mass with disease progression [9, 15].
Robusticity was considered as referring to the thickness of the femurs relative to the length. An extensive review of the scientific literature has indicated that this is the first study that has investigated the robusticity of diabetic rat humeri. The rational for assessing femoral robusticity is our supposition that a shorter bone with a wide shaft would be stronger than a thin long bone. Our results showed a lower robusticity index in diabetic bones at both 20 and 28 weeks. This supports previous literature that has shown that diabetic bones are weaker [9]. The low robusticity could be a contributing factor to the diabetic bone weakness.

Trabecular morphometry

The BV was consistently lower at the age of 20 weeks and among 28-week-old rats. This shows that diabetic groups had smaller femora, meaning that diabetes had reduced overall femoral size. However, bone tissue volume ratio (BV/TV) was lower in the diabetic group at only 20 weeks of age. The lack of significant difference in BV/TV among 28-week-old rats suggests that there may have been compensatory means to maintain osseous tissues quantity as diabetes progressed. Bone tissue adapts by consolidating under prolonged stress [22-24].
Among the trabecular morphometric parameters, TbTh was unaffected in 20-week-old rats, but was reduced in late stages of diabetes (28-week-old). In contrast, TbN was significantly lower in 20-week-old diabetic rats, but similar among the 28-week-old groups. This means that in instances when trabecular number was reduced, the thickness was unaffected. This observation may be related to compensatory mechanisms to maintain bone structural integrity in the diabetic state. This would prevent a situation where trabeculae thickness and trabeculae number are reduced simultaneously. Otherwise, the bone quality would be quickly compromised in diabetes. Previous studies report an unchanged bone tissue volume fraction and trabeculae thickness in 22-week-old ZDSDs, but significantly reduced trabeculae thickness in 29-week-old ZDSDs [15]. Studies on male Fischer rats reported a decrease in trabeculae number, increase in TbSp, and increased trabeculae thinning with age [25].
The ZDSDs and SD controls had a similar midshaft cortical area when compared with their SD controls irrespective of age group. However, the medullary canal area was larger in the diabetic groups, though only the severely diabetic in case of the 28 weeks old rats. This contrasts thereduction in cortical area reported in previous studies [9]. This phenomenon of medullary canal area is thought to contribute the diabetic bone weakness [17]. The observed increased medullary canal area in the present study may be attributed to diabetic induced endosteal bone resorption as bone marrow area expansion is linked to increased bone resorption by endosteal cells [17]. A reduction in cortical area combined with an increased medullary canal area, would compromise the structural strength of the bone. These results align with the observed bone weakness reported in human studies [12-14].

Aspects of femoral parameters most affected by age, diabetes, and its duration

Parameters related to osteometry, and trabecular morphometry were among the most affected by age, diabetes and its duration as shown by the outcome of the DFA. These parameters were, robusticity index, midshaft mediolateral diameter, bicondylar width (mm), midshaft medullary area, bone mass, midshaft cortical area and TbTh. They could reliably distinguish the controls from the diabetic groups. No similar study was found in the literature to compare with these findings reported in the present study.
In conclusion, this study shows that diabetes mellitus results in lighter, smaller, shorter hollow bones, as well as exhibit unfavourable TbTh, TbN, and TbSp in the ZDSD rat. These perturbations occur early and late in the disease. Early intervention is recommended in controlling hyperglycemia, to reduce femoral head and neck fractures in diabetic patients. The ZDSD rat is also recommended as a suitable translational model that can be extrapolated to humans, as it shares a similar diabetes progression as humans.

Acknowledgements

Ms Hasiena Ali provided technical assistance and the staff of the CAS at the University of the Witwatersrand provided animal husbandry. The views and opinions expressed are those of the authors and do not necessarily represent the official views of the SA MRC.

Notes

Author Contributions

Conceptualization: RN. Data acquisition: VP, GFD. Data analysis or interpretation: RN, VP, GFD. Drafting of the manuscript: GFD. Critical revision of the manuscript: RN, VP. Approval of the final version of the manuscript: all authors.

Conflicts of Interest

No potential conflict of interest relevant to this article was reported.

References

1. Regufe VMG, Pinto CMCB, Perez PMVHC. 2020; Metabolic syndrome in type 2 diabetic patients: a review of current evidence. Porto Biomed J. 5:e101. DOI: 10.1097/j.pbj.0000000000000101. PMID: 33299950. PMCID: PMC7721212.
crossref
2. Saeedi P, Petersohn I, Salpea P, Malanda B, Karuranga S, Unwin N, Colagiuri S, Guariguata L, Motala AA, Ogurtsova K, Shaw JE, Bright D, Williams R. IDF Diabetes Atlas Committee. Global and regional diabetes prevalence estimates for 2019 and projections for 2030 and 2045: results from the international diabetes federation diabetes atlas, 9th edition. Diabetes Res Clin Pract. 2019; 157:107843. DOI: 10.1016/j.diabres.2019.107843. PMID: 31518657.
crossref
3. Sun H, Saeedi P, Karuranga S, Pinkepank M, Ogurtsova K, Duncan BB, Stein C, Basit A, Chan JCN, Mbanya JC, Pavkov ME, Ramachandaran A, Wild SH, James S, Herman WH, Zhang P, Bommer C, Kuo S, Boyko EJ, Magliano DJ. 2022; IDF Diabetes Atlas: global, regional and country-level diabetes prevalence estimates for 2021 and projections for 2045. Diabetes Res Clin Pract. 183:109119. DOI: 10.1016/j.diabres.2021.109119. PMID: 34879977. PMCID: PMC11057359.
crossref
4. Blakytny R, Spraul M, Jude EB. 2011; Review: the diabetic bone: a cellular and molecular perspective. Int J Low Extrem Wounds. 10:16–32. DOI: 10.1177/1534734611400256. PMID: 21444607.
crossref
5. Hamann C, Goettsch C, Mettelsiefen J, Henkenjohann V, Rauner M, Hempel U, Bernhardt R, Fratzl-Zelman N, Roschger P, Rammelt S, Günther KP, Hofbauer LC. 2011; Delayed bone regeneration and low bone mass in a rat model of insulin-resistant type 2 diabetes mellitus is due to impaired osteoblast function. Am J Physiol Endocrinol Metab. 301:E1220–8. DOI: 10.1152/ajpendo.00378.2011. PMID: 21900121.
crossref
6. Ismawati , Mukhyarjon , Asni E, Romus I. 2019; The effect of alpha-lipoic acid on expression of VCAM-1 in type 2 diabetic rat. Anat Cell Biol. 52:176–82. DOI: 10.5115/acb.2019.52.2.176. PMID: 31338234. PMCID: PMC6624340.
crossref
7. Peterson RG, Jackson CV, Zimmerman K, de Winter W, Huebert N, Hansen MK. 2015; Characterization of the ZDSD rat: a translational model for the study of metabolic syndrome and type 2 diabetes. J Diabetes Res. 2015:487816. DOI: 10.1155/2015/487816. PMID: 25961053. PMCID: PMC4415477.
crossref
8. Starup-Linde J, Vestergaard P. 2016; Biochemical bone turnover markers in diabetes mellitus - a systematic review. Bone. 82:69–78. DOI: 10.1016/j.bone.2015.02.019. PMID: 25722065.
crossref
9. Reinwald S, Peterson RG, Allen MR, Burr DB. 2009; Skeletal changes associated with the onset of type 2 diabetes in the ZDF and ZDSD rodent models. Am J Physiol Endocrinol Metab. 296:E765–74. DOI: 10.1152/ajpendo.90937.2008. PMID: 19158319. PMCID: PMC2670632.
crossref
10. Bonds DE, Larson JC, Schwartz AV, Strotmeyer ES, Robbins J, Rodriguez BL, Johnson KC, Margolis KL. 2006; Risk of fracture in women with type 2 diabetes: the women's health initiative observational study. J Clin Endocrinol Metab. 91:3404–10. DOI: 10.1210/jc.2006-0614. PMID: 16804043.
crossref
11. Oei L, Zillikens MC, Dehghan A, Buitendijk GH, Castaño-Betancourt MC, Estrada K, Stolk L, Oei EH, van Meurs JB, Janssen JA, Hofman A, van Leeuwen JP, Witteman JC, Pols HA, Uitterlinden AG, Klaver CC, Franco OH, Rivadeneira F. 2013; High bone mineral density and fracture risk in type 2 diabetes as skeletal complications of inadequate glucose control: the Rotterdam study. Diabetes Care. 36:1619–28. DOI: 10.2337/dc12-1188. PMID: 23315602. PMCID: PMC3661786.
12. Janghorbani M, Van Dam RM, Willett WC, Hu FB. 2007; Systematic review of type 1 and type 2 diabetes mellitus and risk of fracture. Am J Epidemiol. 166:495–505. DOI: 10.1093/aje/kwm106. PMID: 17575306.
crossref
13. Valderrábano RJ, Linares MI. 2018; Diabetes mellitus and bone health: epidemiology, etiology and implications for fracture risk stratification. Clin Diabetes Endocrinol. 4:9. DOI: 10.1186/s40842-018-0060-9. PMID: 29721333. PMCID: PMC5918531.
crossref
14. Vestergaard P, Rejnmark L, Mosekilde L. 2009; Diabetes and its complications and their relationship with risk of fractures in type 1 and 2 diabetes. Calcif Tissue Int. 84:45–55. DOI: 10.1007/s00223-008-9195-5. PMID: 19067021.
crossref
15. Creecy A, Uppuganti S, Merkel AR, O'Neal D, Makowski AJ, Granke M, Voziyan P, Nyman JS. 2016; Changes in the fracture resistance of bone with the progression of type 2 diabetes in the ZDSD rat. Calcif Tissue Int. 99:289–301. DOI: 10.1007/s00223-016-0149-z. PMID: 27209312. PMCID: PMC4961536.
crossref
16. Prisby RD, Swift JM, Bloomfield SA, Hogan HA, Delp MD. 2008; Altered bone mass, geometry and mechanical properties during the development and progression of type 2 diabetes in the Zucker diabetic fatty rat. J Endocrinol. 199:379–88. DOI: 10.1677/JOE-08-0046. PMID: 18755885.
crossref
17. Jepsen KJ, Silva MJ, Vashishth D, Guo XE, van der Meulen MC. 2015; Establishing biomechanical mechanisms in mouse models: practical guidelines for systematically evaluating phenotypic changes in the diaphyses of long bones. J Bone Miner Res. 30:951–66. DOI: 10.1002/jbmr.2539. PMID: 25917136. PMCID: PMC4794979.
crossref
18. Martin RM, Correa PH. 2010; Bone quality and osteoporosis therapy. Arq Bras Endocrinol Metabol. 54:186–99. DOI: 10.1590/S0004-27302010000200015. PMID: 20485908.
crossref
19. Sikdar A, Mushrif-Tripathy V. 2023; A comparative study of robusticity indices of long bones among hunter-gatherers and early agro-pastoral groups of India. Am J Biol Anthropol. 182:93–108. DOI: 10.1002/ajpa.24793. PMID: 37283202.
crossref
20. Dlamini GF, Ndou R. 2023; Osteoblastogenesis and osteolysis in the Zucker Diabetic Sprague Dawley rat humerus head. Anat Cell Biol. 56:552–61. DOI: 10.5115/acb.23.166. PMID: 37788886. PMCID: PMC10714090.
crossref
21. Bouxsein ML, Boyd SK, Christiansen BA, Guldberg RE, Jepsen KJ, Müller R. 2010; Guidelines for assessment of bone microstructure in rodents using micro-computed tomography. J Bone Miner Res. 25:1468–86. DOI: 10.1002/jbmr.141. PMID: 20533309.
crossref
22. Iwaniec UT, Turner RT. 2016; Influence of body weight on bone mass, architecture and turnover. J Endocrinol. 230:R115–30. DOI: 10.1530/JOE-16-0089. PMID: 27352896. PMCID: PMC4980254.
crossref
23. Turner CH, Burr DB. 1993; Basic biomechanical measurements of bone: a tutorial. Bone. 14:595–608. DOI: 10.1016/8756-3282(93)90081-K. PMID: 8274302.
crossref
24. Tyrovola JB. 2015; The "mechanostat theory" of frost and the OPG/RANKL/RANK system. J Cell Biochem. 116:2724–9. DOI: 10.1002/jcb.25265. PMID: 26096594.
crossref
25. Uppuganti S, Granke M, Makowski AJ, Does MD, Nyman JS. 2016; Age-related changes in the fracture resistance of male Fischer F344 rat bone. Bone. 83:220–32. DOI: 10.1016/j.bone.2015.11.009. PMID: 26610688. PMCID: PMC4724327.
crossref

Fig. 1
Three-dimensional reconstruction of a femur showing the parts that were investigated. (A) Full femur length, (B) biomechanical length, (C) bicondylar breadth, (D) 50th percentile (midshaft) mark, (E) femoral head width. Image by Vaughan Perry and Robert Ndou.
acb-57-2-294-f1.tif
Fig. 2
(A) Fasting blood glucose and (B) serum insulin concentration. Box-and-whisker plots show insulin levels in various study groups. The line inside the box represents the mean, whereas the bottom and top lines of the box show the 25th and 75th percentiles, respectively. The whiskers below and above the box show the minimum and maximum values, respectively. SD20WK and SD28WK; SD rats aged 20 and 28 weeks, respectively. ZDSD20WK, ZDSD28WK-MOD and ZDSD28WK-SVD; ZDSD rats aged 20 weeks, and aged 28 weeks MOD and SVD, respectively. SD, Sprague–Dawley; ZDSD, Zucker Diabetic Sprague–Dawley; MOD, moderately diabetic; SVD, severely diabetic.
acb-57-2-294-f2.tif
Fig. 3
Representative micro-focus X-ray computed tomography images of the proximal femur. Among the 20-week-old rats, SD20WK show more BV/TV and TbN, with more TbSp in the ZDSD20WK rats. When the comparing the 28-week-old rats, TbTh was higher in the SD28WK, with marginally more spacing (TbSp) in the ZDSD28WK-MOD and ZDSD28WK-SVD. Older controls (SD28WK) show less BV/TV and TbTh but more spacing than younger ones (SD20WK). BV/TV, bone volume to bone tissue volume ratio; TbTh, trabecular thickness; TbN, trabecular number; TbSp, trabecular spacing; SD, Sprague–Dawley; ZDSD, Zucker Diabetic Sprague–Dawley; MOD, moderately diabetic; SVD, severely diabetic. Scale bar represents 1 mm and applies to all images.
acb-57-2-294-f3.tif
Fig. 4
Illustrated discriminant function analysis of predicted group membership. The controls are clearly separated from the diabatic groups. SD, Sprague–Dawley; ZDSD, Zucker Diabetic Sprague–Dawley; MOD, moderately diabetic; SVD, severely diabetic.
acb-57-2-294-f4.tif
Table 1
Femur osteometric parameters
Parameter Description
Full femur length The maximum length measured between the top of the greater trochanter and the bottom of the farthest condyle.
Biomechanical length The distance between the medial most and lateral most points on the epicondyles.
Bicondylar width The distance between the medial most and lateral most points on the epicondyles.
Midshaft mediolateral diameter Distance between bulgiest parts in a mediolateral direction at the 50th percentile.
Robusticity index Mediolateral midshaft diameter divided by length of the femur and multiplied by 100.
Femoral head width Between the highest and lowest point on the articular margin.
Femoral neck superoinferior distance Distance between the bulgiest part of the neck in the superoinferior direction.
Table 2
Femur trabecular assessment parameters
Parameter Definition
BV/TV Represents the ratio of material (bone) volume to total volume.
TbTh The material (bone), calculated as follows: TbTh=2/BS/BV
Where BS/BV is the ratio of BS to BV.
TbN Shows the mean number of trabecular (column-like) structures per unit length, calculated as follows: TbN=BV/TV/TbTh.
TbSp Indicates the mean distance between trabecular (column-like) structures, calculated as follows: TbSp=1/TbN−TbTh.
Midshaft medullary cavity area The area of a slice taken encompassing the medullary canal at the 50th percentile mark.
Midshaft cortical area The area of a slice taken from the margins of cortical bone encompassing the shaft at the 50th percentile marks.

BV/TV, bone tissue volume to total volume; TbTh, trabecular thickness; BS, bone surface; BV, bone volume; TbN, trabecular number; TbSp, trabecular spacing.

Table 3
Osteometric measurements of the femur
Property Week-20 P-value Week-28 P-value
SD (n=12) ZDSD (n=12) SD (n=12) ZDSD-MOD (n=12) ZDSD-SVD (n=12)
Bone mass (g) 1.35±0.09 1.19±0.04 <0.001 1.26±04 1.25±0.06 1.16±0.11 0.005, <0.001a)
<0.001b)
0.020c)
0.014
Full length (mm) 39.71±0.83 39.57±0.37 0.545 40.45±0.31 39.37±0.28 39.13±0.85 <0.001a)
0.001b)
0.354c)
0.059
Biomechanical length (mm) 38.59±0.53 38.43±0.41 0.584 39.03± 0.53 37.85±0.68 37.18±0.47 <0.001, 0.003a)
0.105b)
0.024c)
<0.001
Midshaft mediolateral diameter (mm) 5.13±0.17 4.75±0.17 <0.001 5.05±0.26 3.61±0.35 3.83±0.44 <0.001a)
0.188b)
<0.001c)
Bicondylar width (mm) 7.78±0.26 6.91±0.19 <0.001 7.14±0.21 7.11±0.07 6.85±0.25 0.003, <0.001a)
<0.001b)
0.200c)
0.051
Robusticity index (%) 22.49±1.17 21.13±0.44 0.002 21.21±0.85 16.65±1.39 16.71±1.04 <0.001a)
0.003b)
<0.001c)

Values are presented as mean±standard deviation. SD, Sprague–Dawley; ZDSD, Zucker Diabetic Sprague–Dawley; MOD, moderately diabetic; SVD, severely diabetic. a)Respective comparison of SD28WK with ZDSD28WK-MOD and ZDSD28WK-SVD. b)P-value comparing SD20WK against SD28WK, c)P-value comparing ZDSD20WK against ZDSD28WK-MOD and ZDSD28WK-SVD, respectively.

Table 4
Micro-focus X-ray computed tomography evaluation of the proximal femur at week-20 and week-28 of age
Property Week-20 P-value Week-28 P-value
SD (n=12) ZDSD (n=12) SD (n=12) ZDSD-MOD (n=12) ZDSD-SVD (n=12)
BV (mm3) 30.90±8.45 26.69±3.55 0.039 34.08±2.96 27.93±3.01 27.73±2.87 0.002a)
0.116b)
0.505, 0.604c)
BV/TV (%) 26±2 18±5 <0.001 19±9 19±2 18±2 0.944, 0.955a)
<0.001b)
0.828, 0.936c)
TbTh (mm) 0.33±0.14 0.31±0.04 0.692 0.46±0.10 0.35±0.08 0.32±0.07 0.002, 0.001a)
0.001b)
0.403, 0.842c)
TbN 2.40±1.25 0.57±0.18 <0.001 0.39±0.20 0.43±0.21 0.67±0.98 0.884, 0.368a)
<0.001b)
0.639, 0.740c)
TbSp (mm) 0.39±0.62 1.59±.0.61 0.050 2.50±1.66 2.50±1.66 2.61±1.36 0.851, 0.858a)
0.001b)
0.115, 0.143c)
Cortical area (50th percentile, mm2) 19.97±2.58 18.26±0.71 0.056 20.41±2.09 19.26±2.37 20.83±1.56 0.164, 0.635a)
0.619b)
0.226, 0.005c)
Medullary area (50th percentile, mm2) 9.39±0.67 12.48±2.66 <0.001 9.39±0.67 10.34±1.02 11.43±1.34 0.146, 0.011a)
0.161b)
0.733, 0.202c)

Values are presented as mean±standard deviation. BV/TV, bone volume to bone tissue volume ratio; TbTh, trabecular thickness; TbN, trabecular number; TbSp, trabecular spacing; SD, Sprague–Dawley; ZDSD, Zucker Diabetic Sprague–Dawley; MOD, moderately diabetic; SVD, severely diabetic. a)Respective comparison of SD28WK with ZDSD28WK-MOD and ZDSD28WK-SVD. b)P-value comparing SD20WK against SD28WK, c)P-value comparing ZDSD20WK against ZDSD28WK-MOD and ZDSD28WK-SVD respectively.

Table 5
Discriminant function analysis of the femur
Structure matrix
Parameter Function
1 2 3
Robusticity index 0.57a) 0.45a) –0.35a)
Midshaft mediolateral diameter 0.51a) 0.46a) –0.08
Bicondylar width (mm) 0.36a) –0.39a) 0.07
TbN 0.29 –0.15 0.00
BV/TV 0.28 –0.13 0.06
Midshaft medullary area (mm2) 0.17 0.01 0.31a)
Biomechanical length (mm) 0.15 0.26 0.04
Bone mass (g) 0.14 –0.31a) –0.04
Full length (mm) 0.08 0.22 0.16
Midshaft cortical area (mm2) 0.01 –0.03 0.32a)
TbTh –0.01 0.15 0.34a)
TbSp –0.16 0.04 0.18
Bone volume –0.18 0.01 0.24
Percentage of variance (%) 58.7 33.4 6.1

TbN, trabecular number; BV/TV, bone volume to bone tissue volume ratio; TbTh, trabecular thickness; TbSp, trabecular spacing. a)The contributing variables are arranged in descending order according to function 1, with major contributors (above ±0.3).

Table 6
Discriminant function analysis of predicted group membership
Classification results
Group Predicted group membership
SD20WK ZDSD20WK SD28WK ZDSD28WK-MOD ZDSD28WK-SVD
Cross-validated Count (%) SD20WK 12 (100) 0 (0) 0 (0) 0 (0) 0 (0)
ZDSD20WK 0 (0) 13 (100) 0 (0) 0 (0) 0 (0)
SD28WK 0 (0) 2 (14.3) 12 (85.7) 0 (0) 0 (0)
ZDSD28WK-MOD 0 (0) 0 (0) 0 (0) 11 (64.7) 6 (35.3)
ZDSD28WK-SVD 0 (0) 1 (8.3) 0 (0) 5 (41.7) 6 (50.0)

79.4% of cross-validated grouped cases correctly classified. SD, Sprague–Dawley; ZDSD, Zucker Diabetic Sprague–Dawley; MOD, moderately diabetic; SVD, severely diabetic.

TOOLS
Similar articles