Introduction
Materials and Methods
Animals
Ovariectomized mice
Bone metabolism marker measurements
Bone histomorphometry
Immunofluorescence staining of the femurs
Western blot analysis
X-ray micro-computed tomography analysis of femurs
Statistical analyses
Results
Effect of ovariectomized on body weight and uterus weight
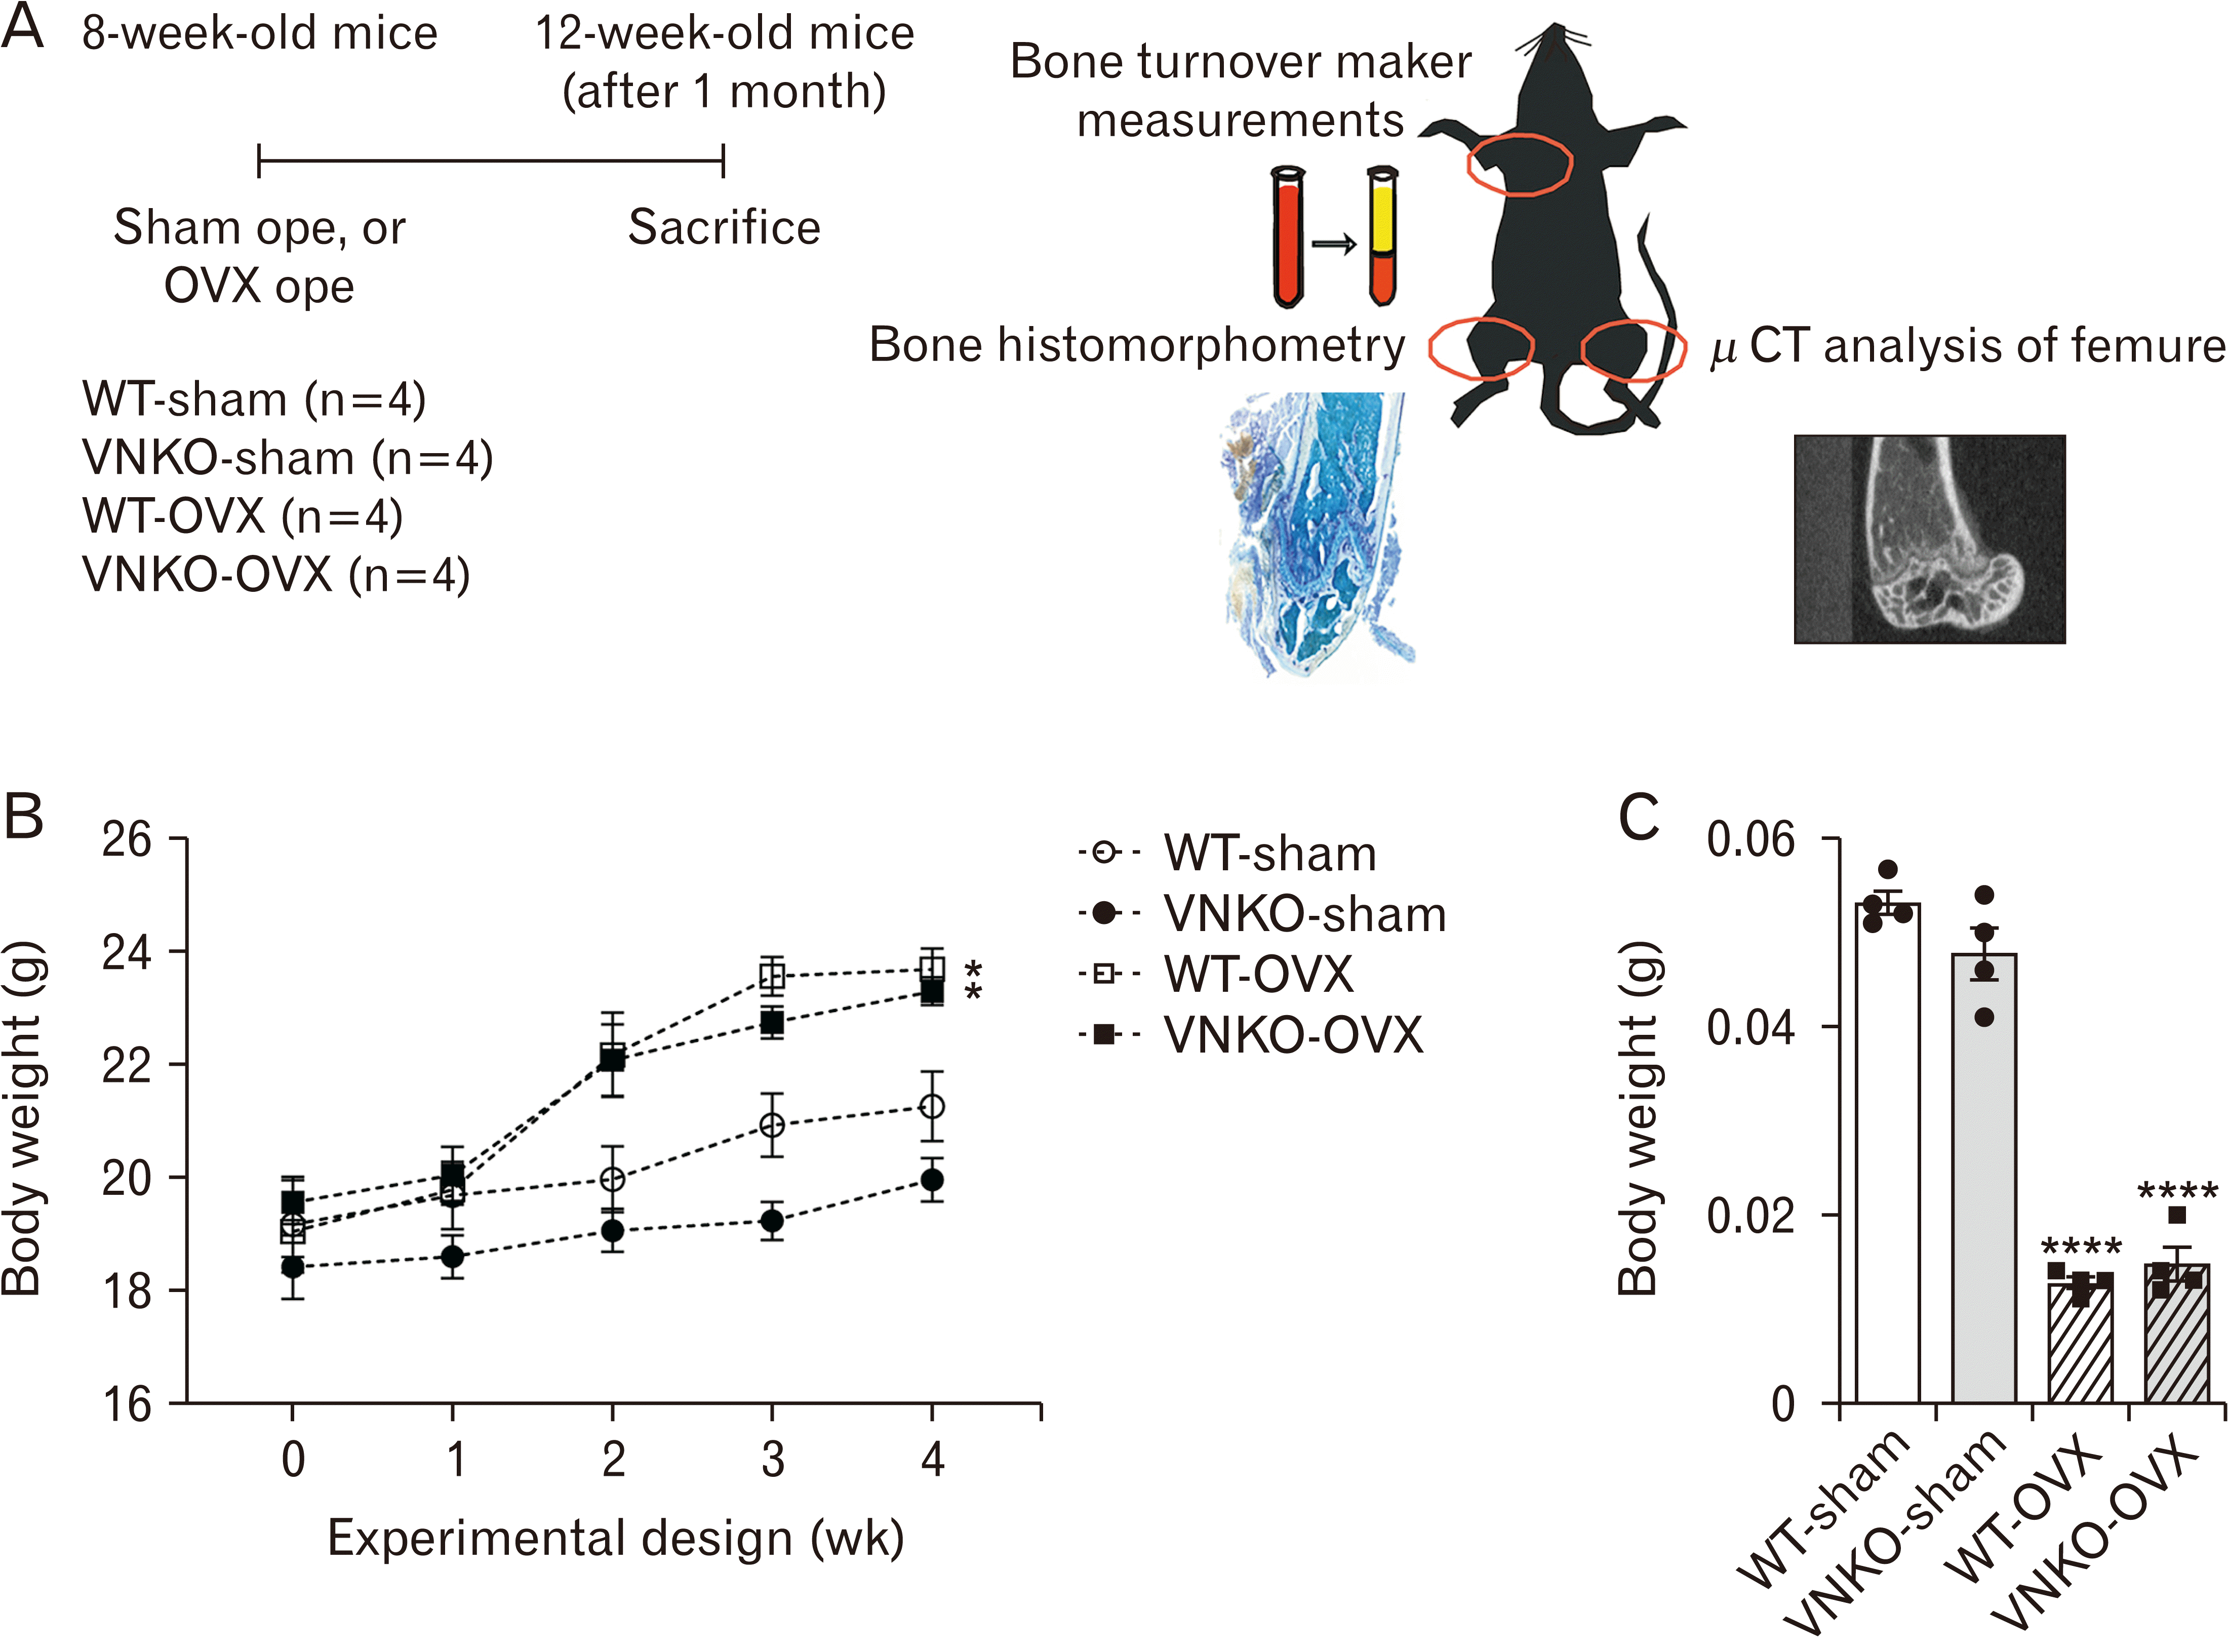
 | Fig. 1Effects of ovariectomy on the body and uterine weights of ovariectomized (OVX) mice. (A) Experimental design of this study. Wild-type (WT) female C57BL/6J mice and vitronectin (VN) knockout (KO) female mice were randomly divided into four groups (n=4 mice/group), namely sham-operated WT group (WT-sham), sham-operated VNKO group (VNKO-sham), OVX WT group (WT-OVX), and OVX+VNKO group (VNKO-OVX). The sham and OVX operations were performed in 8-week-old mice, which were sacrificed at 4 weeks after surgery. Plasma was separated from blood by centrifugation and stored at –20°C. The right femur was stored at –20°C for micro-computed tomography (micro-CT) analysis, whereas left femur was fixed in 4% paraformaldehyde at 4°C overnight and subjected to histomorphometry. (B) Body weight change in sham-operated or OVX-operated mice. Body weight was measured in WT-sham, VNKO-sham, WT-OVX, and VNKO-OVX. Data represent the mean±SEM, n=4. Statistics used one-way ANOVA and Tukey–Kramer test, P-value: *P<0.05 vs. sham-operated group. (C) Uterine weights of sham- or OVX-operated mice. The uterine weight was measured in WT-sham, VNKO-sham, WT-OVX, and VNKO-OVX groups. Data represent the mean±SEM, n=4. Statistics used one-way ANOVA and Tukey–Kramer test, P-value: ****P<0.0001 vs. sham-operated group. Dots indicate the results from each animal. |
Expression and localization of vitronectin in the bone matrix and serum of ovariectomized mice
 | Fig. 2Localization and expression of vitronectin (VN) in bone remodeling. (A) Immunofluorescent images of femur sections of sham- or ovariectomized (OVX)-operated mice. Top panels: VN (green) and tartrate-resistant acid phosphatase type 5 (TRACP5) (red) expression in the femur sections, with merged images indicating areas of overlap. The arrowheads indicate the sites where VN is close to osteoclasts. Bottom panels: VN (green) and runt related transcription factor 2 (RUNX2) (red) expression in the femur sections. 4’,6-diamidino-2-phenylindole (grey) was used for nuclear counterstaining. Scale bar: 5 μm. (B) Western blot analysis of VN expression in the sera of sham- or OVX-operated mice. Fifty micrograms of protein was loaded into each lane. Relative expression levels of VN protein in wild-type (WT) mice. Data are presented as mean±SEM, n>2. The results were analyzed using the t-test. WT-sham, sham-operated WT group; WT-OVX, OVX WT group; A.U., arbitrary unit; n.s., not significant. |
Effect of vitronectin deficiency on bone metabolism in ovariectomized mice
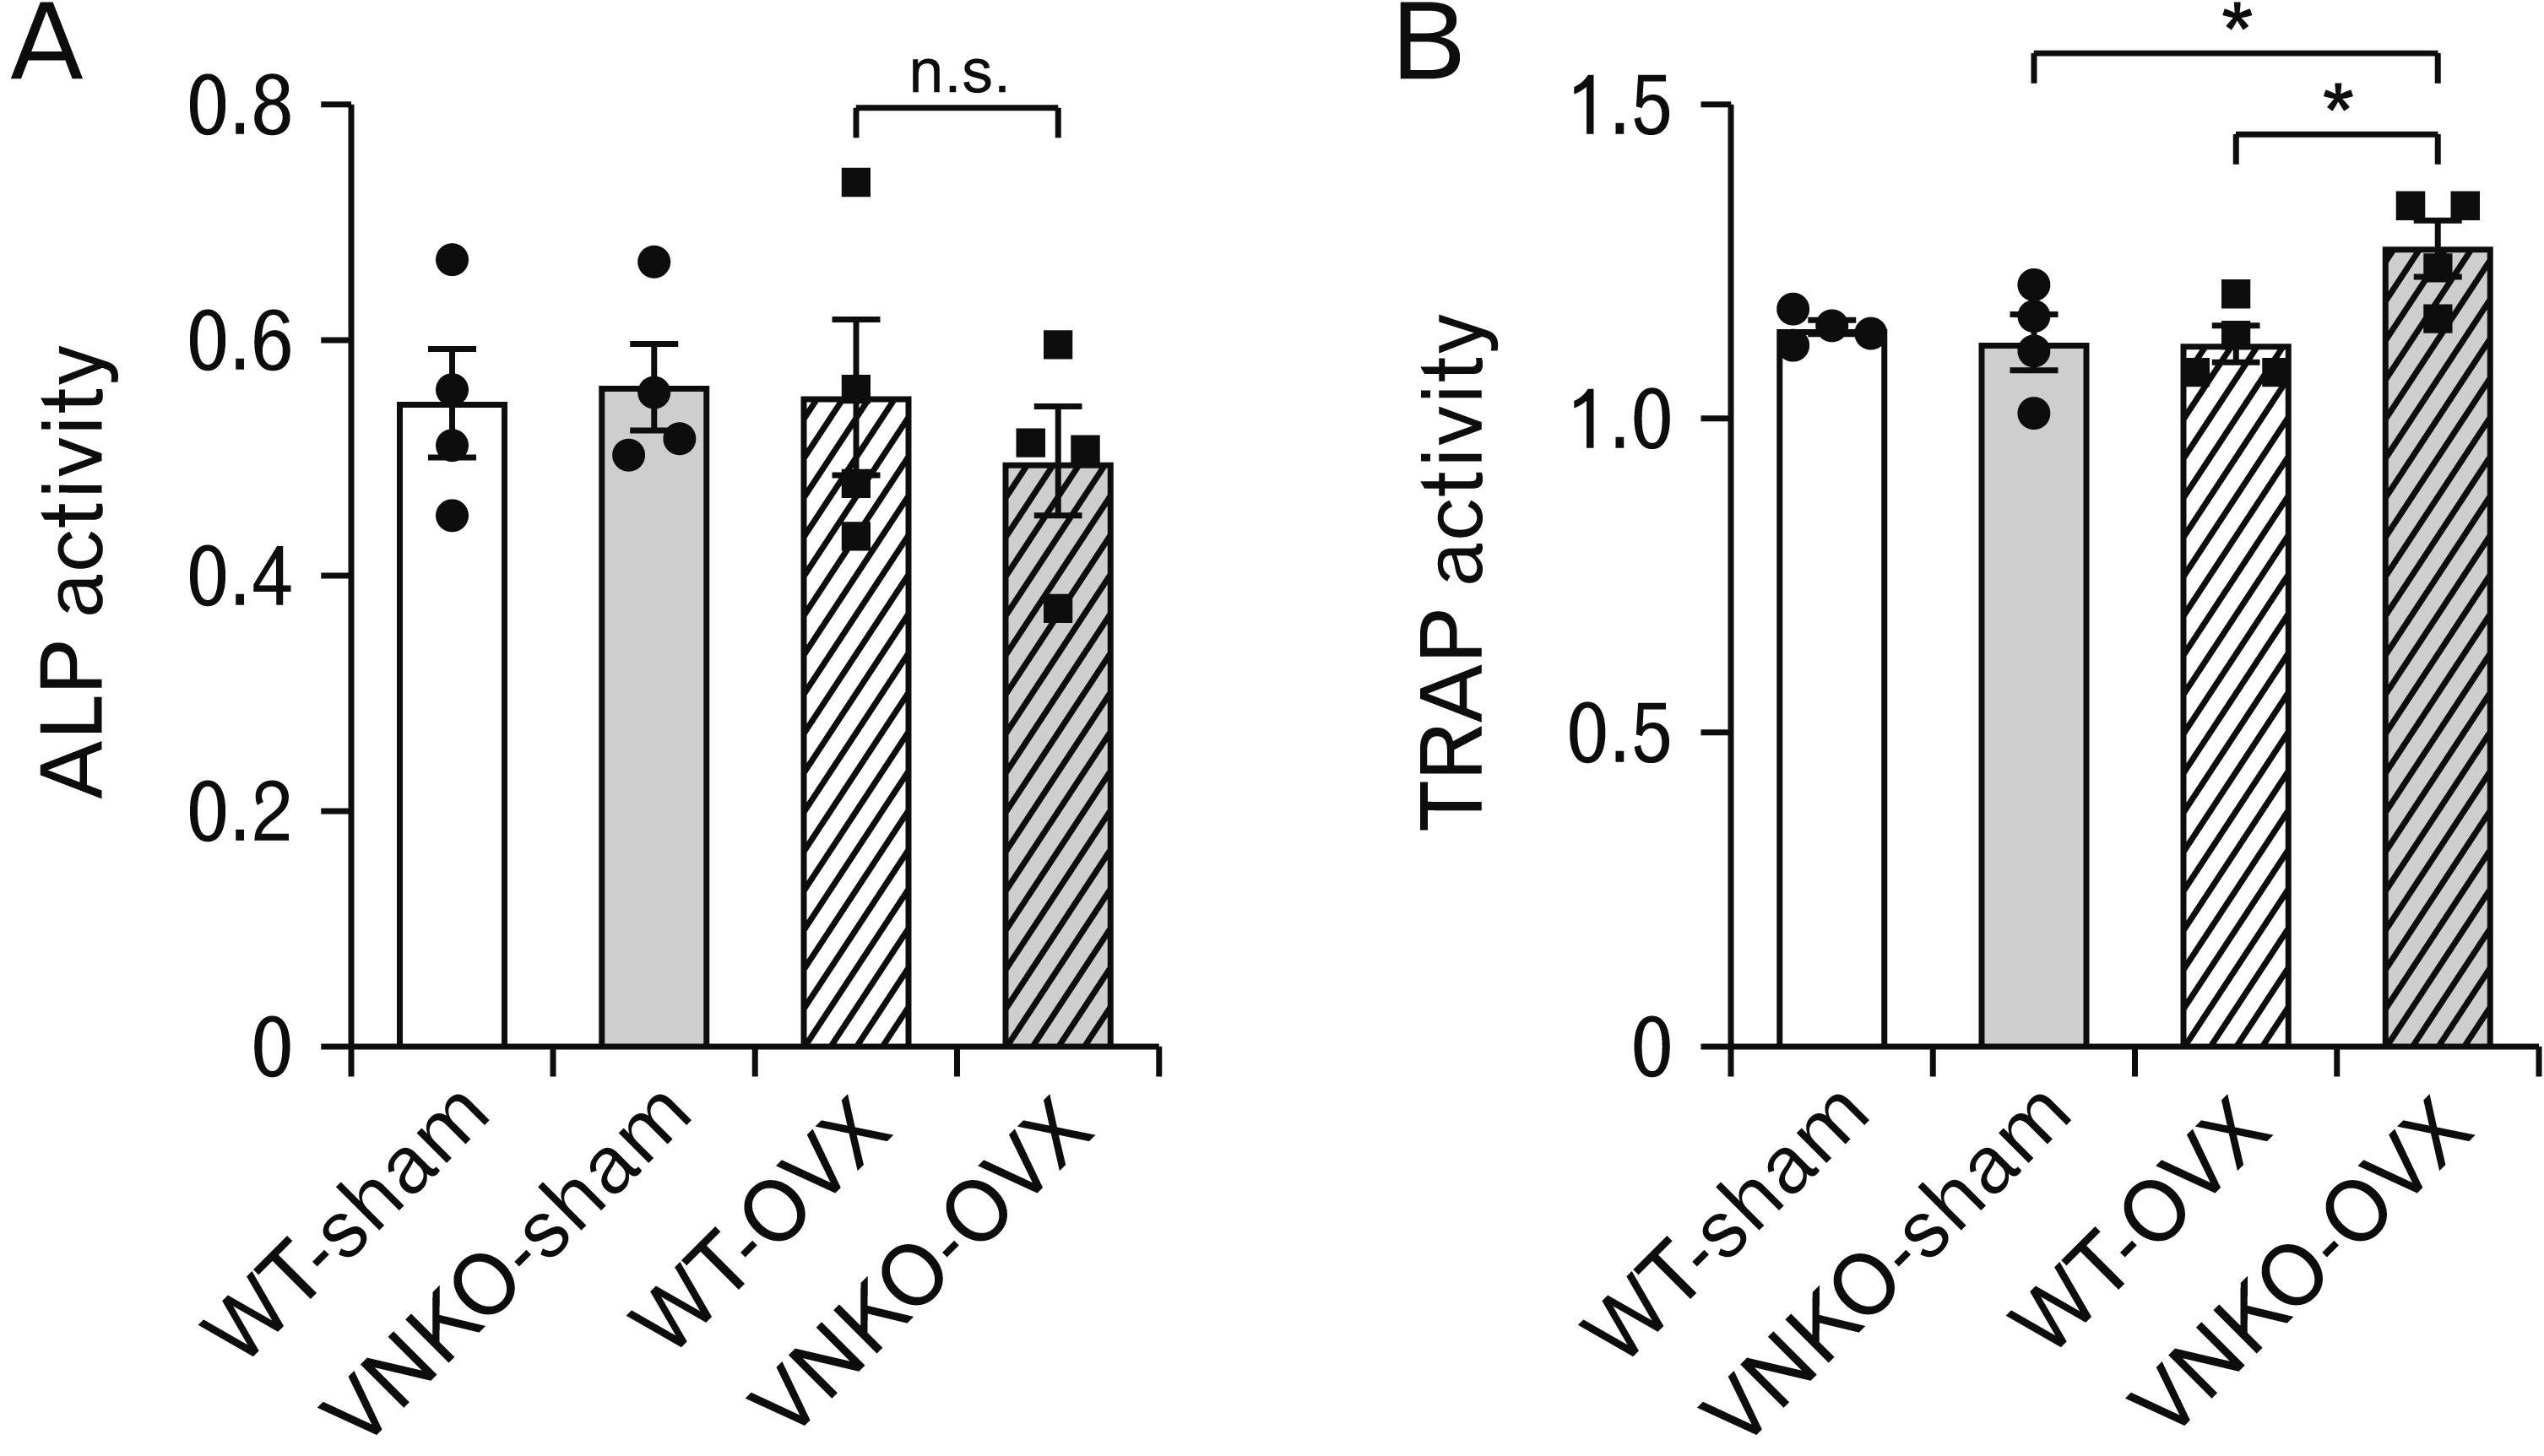
 | Fig. 3Effects of vitronectin (VN) deficiency on bone metabolism markers in sham- or ovariectomized (OVX)-operated mice. (A) The activity of plasma alkaline phosphatase (ALP), marker for osteoblasts, in sham- or OVX-operated mice. Data represent the mean±SEM, n=4. Statistics used one-way ANOVA. Dots indicate the results from each animal. (B) The activity of plasma tartrate-resistant acid phosphatase (TRAP), marker for osteoclasts, in sham- or OVX-operated mice. Data represent the mean±SEM, n=4. Statistics used one-way ANOVA and Tukey–Kramer test, P-value: *P<0.05 vs. OVX+VNKO group (VNKO-OVX). Dots indicate the results from each animal. VNKO, vitronectin knockout; n.s., not significant. |
Effect of vitronectin deficiency on osteoclastogenesis in ovariectomized mice
 | Fig. 4Alkaline phosphatase (ALP) and tartrate-resistant acid phosphatase (TRAP) staining of femur sections from sham- or ovariectomized (OVX)-operated mice. (A) ALP staining images of the femurs in OVX-operated groups. Scale bar: 100 μm. (B) Bone formation was assessed by measuring the ratio of ALP-positive osteoblast perimeter to bone perimeter (Ob.Pm/B.Pm) in an area 1.0 mm from the growth plate in the distal metaphysis of the femur. Data represent the mean±SEM, n=3. Statistics used one-way ANOVA. Dots indicate the results from each animal. (C) TRAP staining images of the femurs in OVX-operated groups. The arrowheads indicate the activity of osteoclasts. Scale bar: 100 μm. (D) Bone resorption was assessed by measuring the number of TRAP-positive osteoclasts (n>3 nuclei) per bone perimeter (N.Oc/B.Pm) in an area 1.0 mm from the growth plate in the distal metaphysis of the femur. Data represent the mean±SEM, n=3. Statistics used one-way ANOVA and Tukey–Kramer test, P-value: *P<0.05 vs. WT-OVX, **P<0.01 vs. WT-sham or VNKO-sham. Dots indicate the results from each animal. WT-sham, sham-operated WT group; VNKO-sham, sham-operated VNKO group; WT-OVX, OVX WT group; VNKO-OVX, OVX+VNKO group; VNKO, vitronectin knockout; n.s., not significant. |
X-ray micro-computed tomography analysis in sham and ovariectomized groups
 | Fig. 5Micro-computed tomography (CT) analysis of femurs in sham- or ovariectomized (OVX)-operated mice. (A) Micro-CT images of the distal femurs obtained after sham- or OVX-operation. Sham-operated wild-type (WT) group (WT-sham), sham-operated VNKO group (VNKO-sham), OVX-operated WT group (WT-OVX), and OVX-operated vitronectin knockout (VNKO) group (VNKO-OVX) were compared; the trabecular bone (orange), the cortical bone (red), and the cortical pore (green). (B, C) Quantitative micro-CT analysis of femurs from sham- or OVX-operated mice. (B) The graph shows parameters of trabecular area of femurs; bone volume (BV), total volume (TV), trabecular thickness (Tb.Th), trabecular separation (Tb.Sp), trabecular number (Tb.N), marrow area (Ma.Ar), degree of anisotropy (DA), and the structural model index (SMI). Data represent the mean±SEM, n>3. Statistics used one-way ANOVA and Tukey–Kramer test, P-value: *P<0.05 vs. WT-OVX, **P<0.01 vs. VNKO-sham, †P<0.05 vs. WT-sham, ††P<0.01 vs. WT-OVX, †††P<0.001 vs. VNKO-sham. Dots indicate the results from each animal. (C) The graph shows parameters of cortical bone area (Ct.Ar) of femurs; Ct.Ar, total cross-sectional area (Tt.Ar), cortical thickness (Ct.Th), and the ratio of Ct.Ar to Tt.Ar. Data represent the mean±SEM, n=4. Statistics used one-way ANOVA and Tukey–Kramer test, P-value: **P<0.01 vs. WT-sham, ***P<0.001 vs. VNKO-sham. Dots indicate the results from each animal. |
Discussion
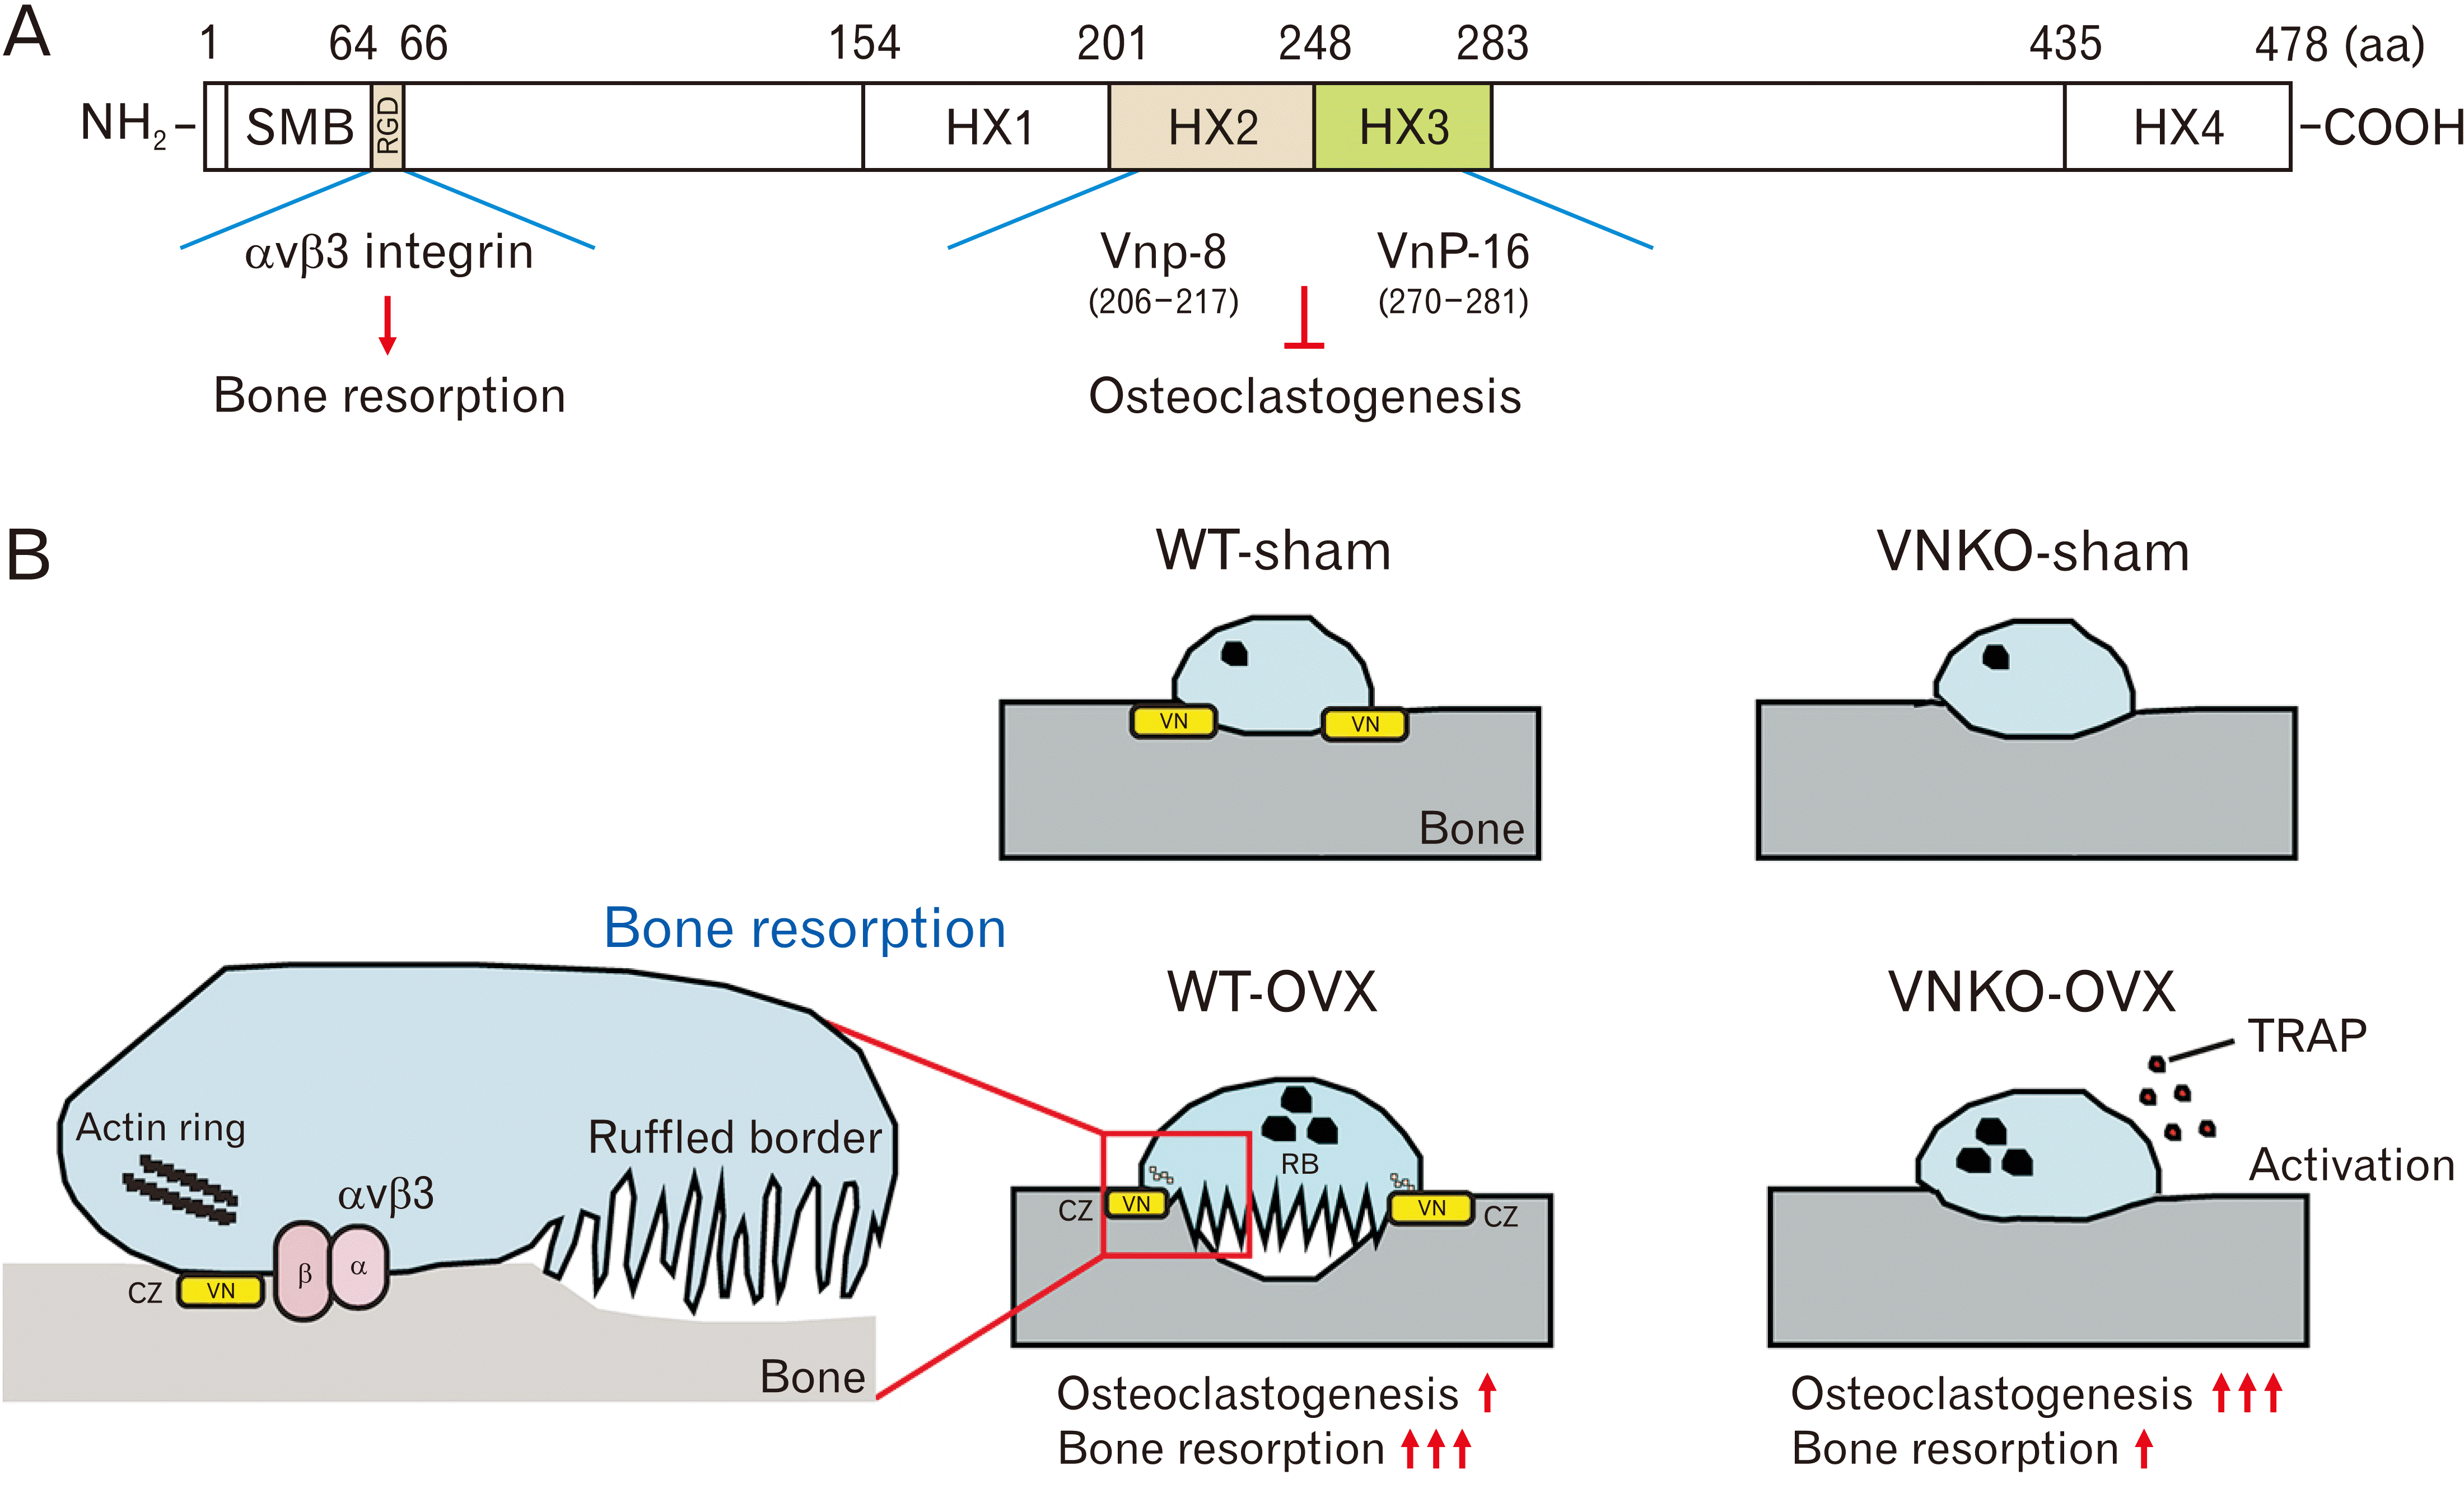
 | Fig. 6Functional regions of vitronectin (VN) and the roles in osteoclastogenesis and bone resorption. (A) The amino acid (aa) positions and the domain structure of full-length VN are indicated. The schematic delineates specific regions of VN peptides (VnP-8: residues 206–217 and VnP-16: residues 270–281 in human VN), which are known to inhibit osteoclastogenesis. In contrast, the RGD motif (residues 64–66) is suggested to facilitate the attachment of osteoclasts to VN via αvβ3 integrin on the bone matrix, potentially augmenting bone resorption (B) Diagrams showing the role of VN in osteoclastogenesis and bone resorption in WT-OVX or VNKO-OVX mice. VN regulates osteoclastogenesis and the adhesion of osteoclast to bone surface. In VNKO-OVX mice, VN deficiency increased the activity of tartrate-resistant acid phosphatase (TRAP) and osteoclastogenesis. On the other hand, VN also suppresses osteoclastogenesis. However, VN deficiency suppressed bone resorption in VNKO-OVX mice. VN may regulate the attachment of osteoclasts to bone surface via αvβ3 integrins and induce the actin-rich clear zone (CZ) formation. Furthermore, VN may induce the formation of ruffled borders (RB), leading to bone resorption in WT-OVX mice. WT, wild-type; OVX, ovariectomized; WT-OVX, OVX-operated WT group; VNKO-OVX, OVX-operated vitronectin knockout group; WT-sham, sham-operated WT group; VNKO-sham, sham-operated VNKO group; RGD, Arg-Gly-Asp. |


 PDF
PDF Citation
 Print
Print


 XML Download