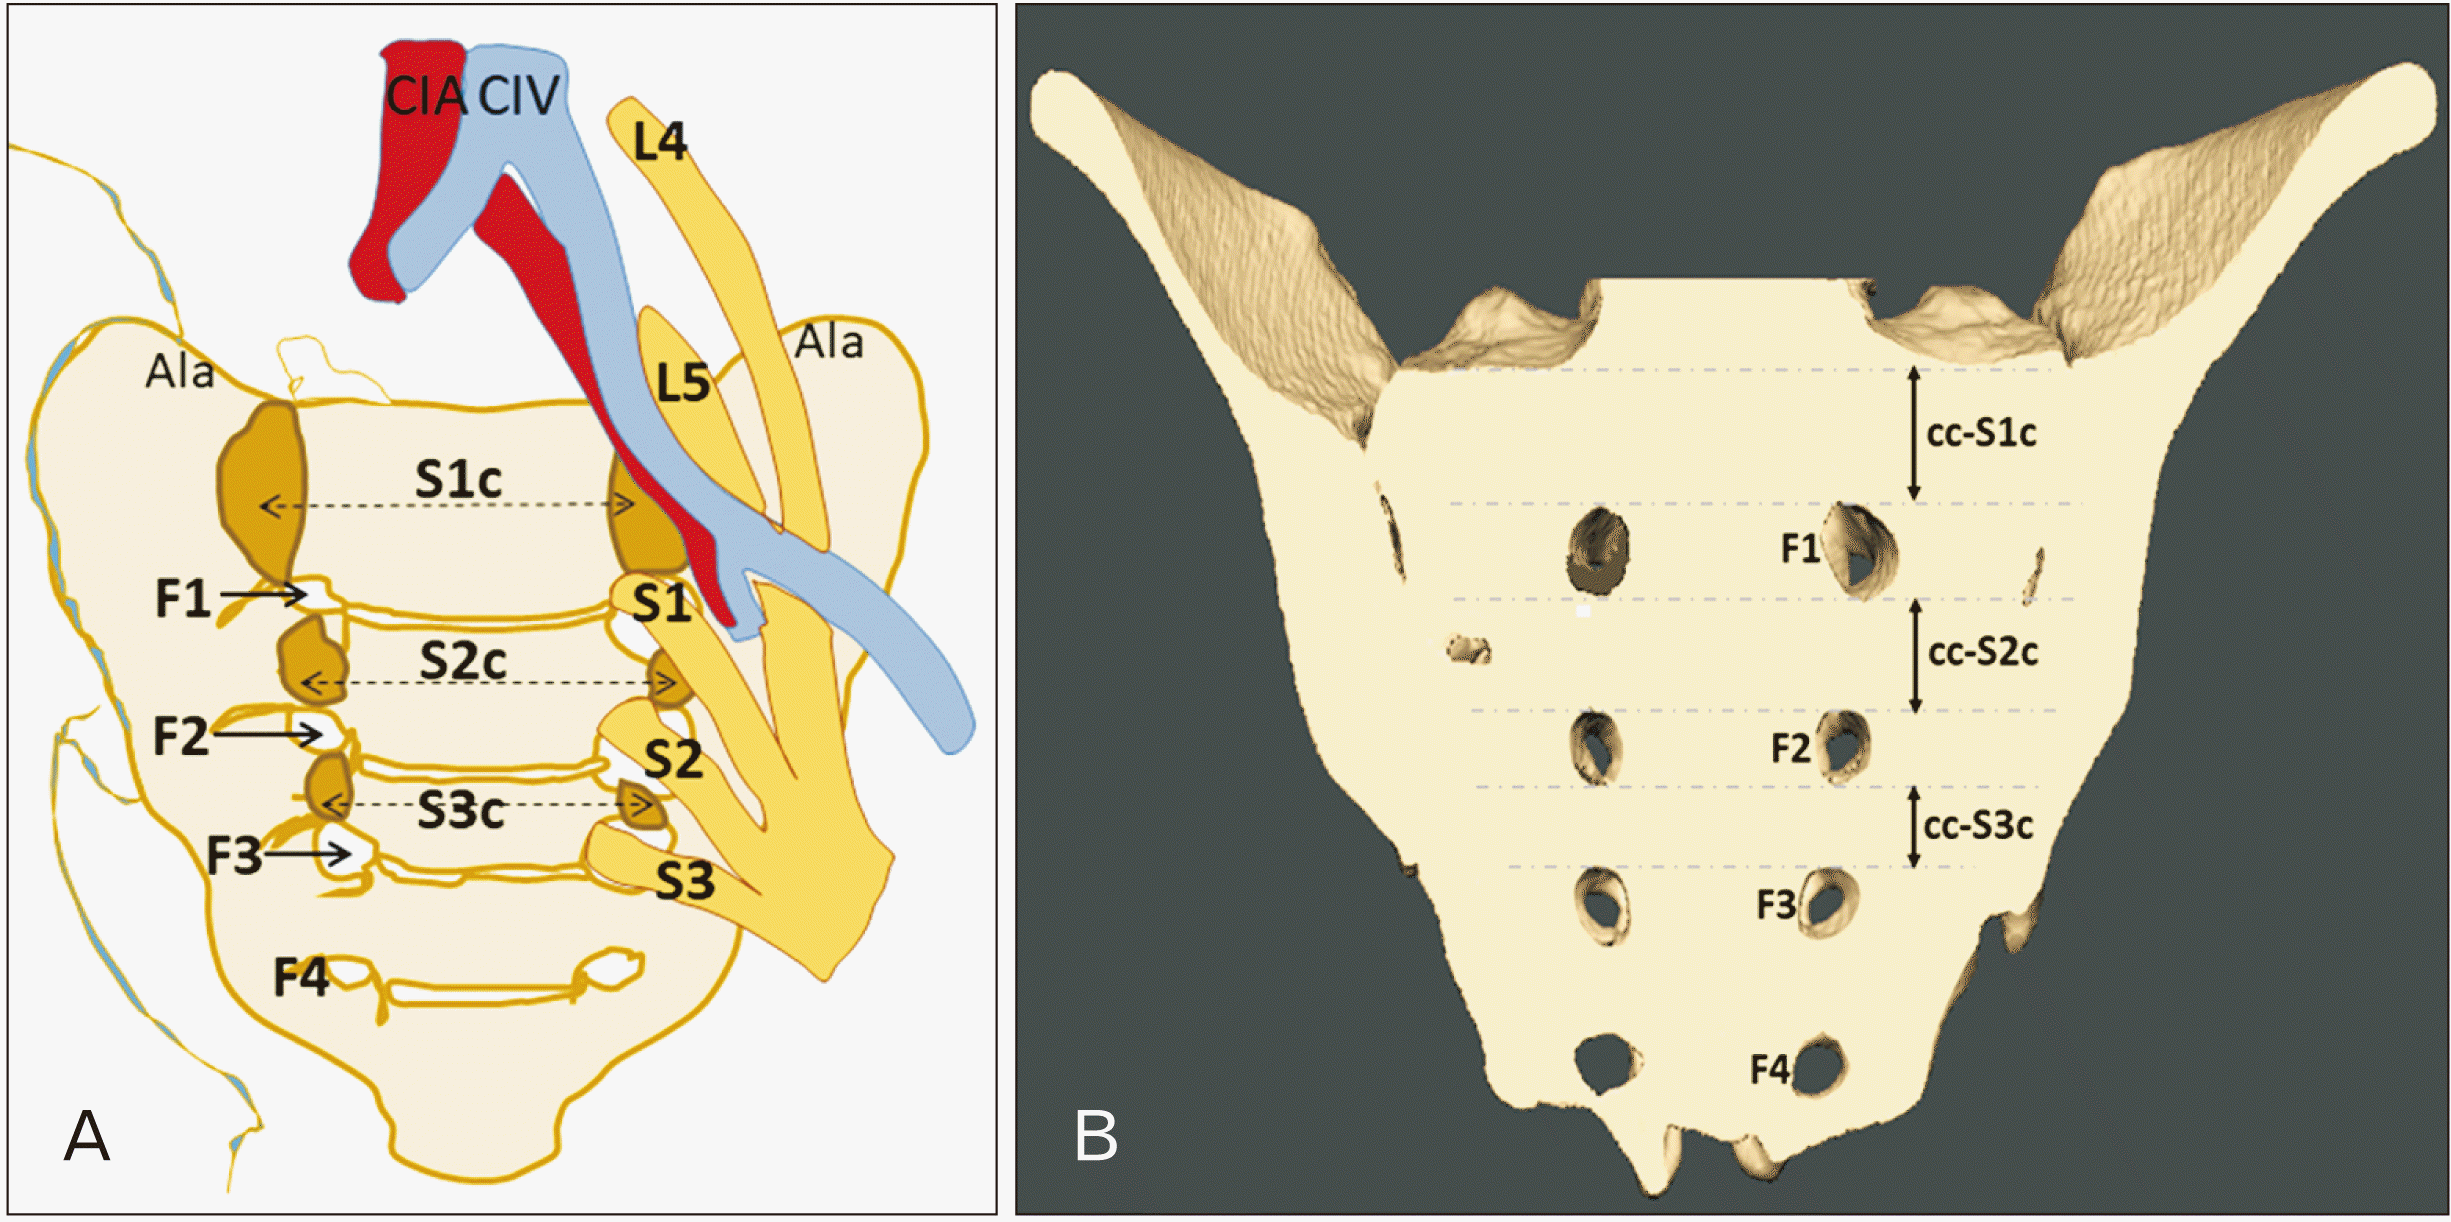
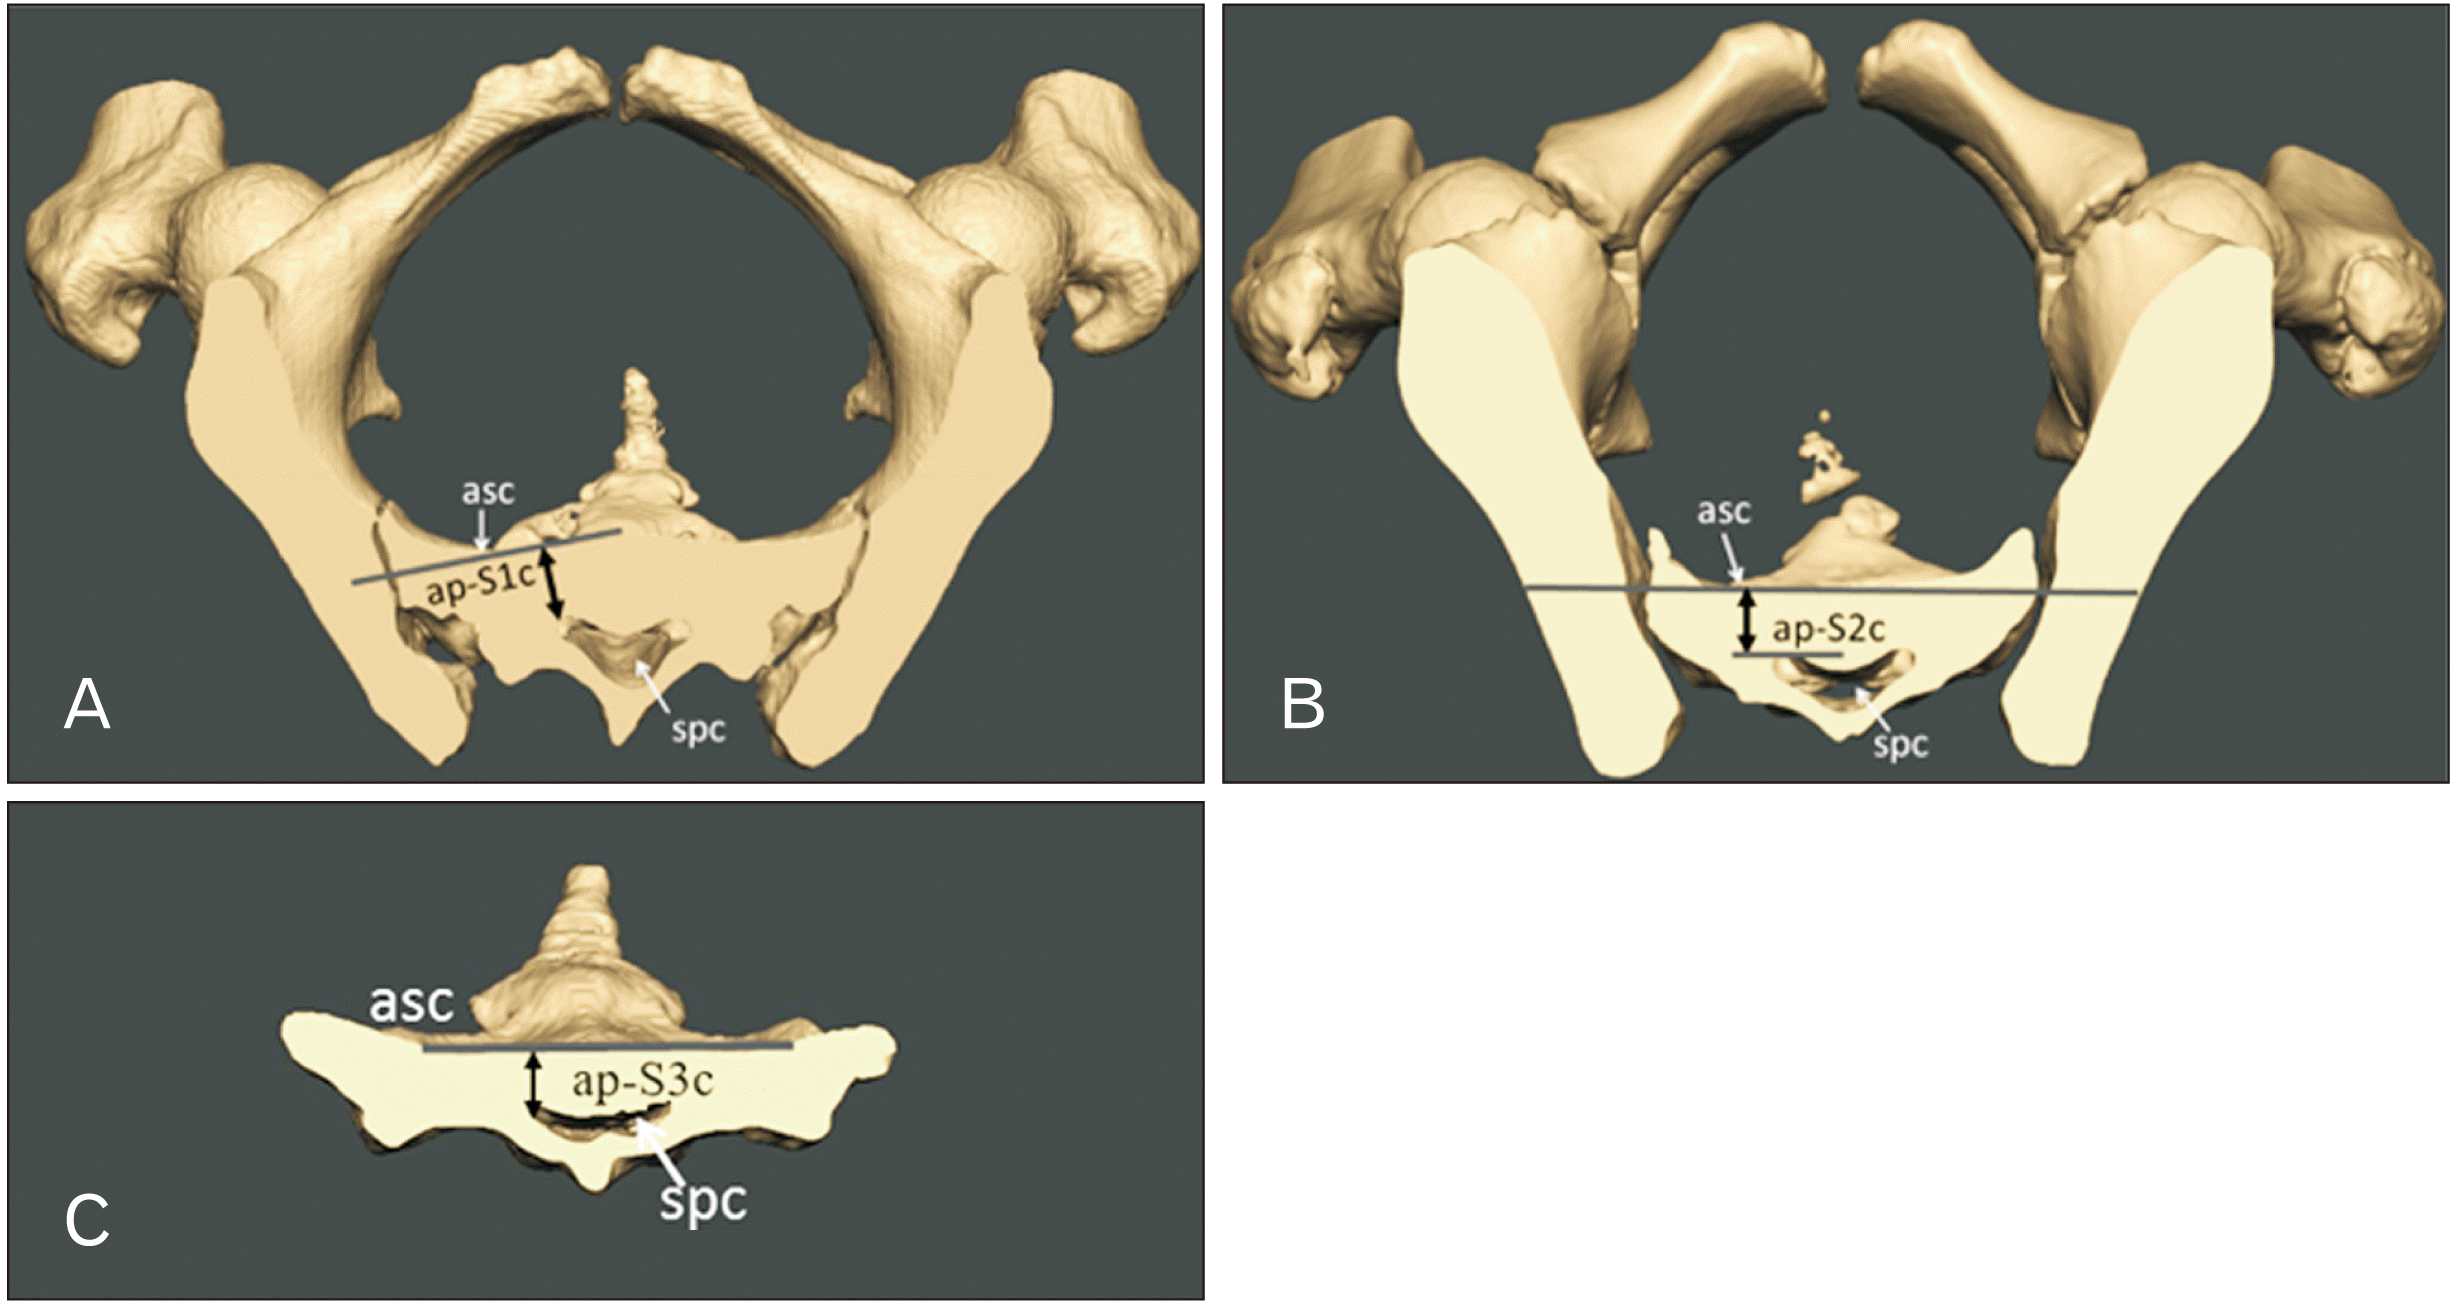
“Safe zone” is the area within the sacrum where the screw can be ideally placed to fix the fractured sacral segments without damaging the nerve roots and vessels lying in its vicinity. To pass a screw safely without a cortical breach, it must traverse the ipsilateral and contralateral osseous corridor, which must be of sufficient size [
3,
10]. In the present study, S1c had the maximum corridor space, followed by S2c and S3c. The corridor space in normal sacra and LSTV showed no significant difference (
P>0.05). The S3c is the least preferable corridor for the screw placement. The ap diameter of all three corridors showed sexual dimorphism (
P=0.013, 0.0011, and <0.0001). The length of the sacrum also showed significant differences among males and females (
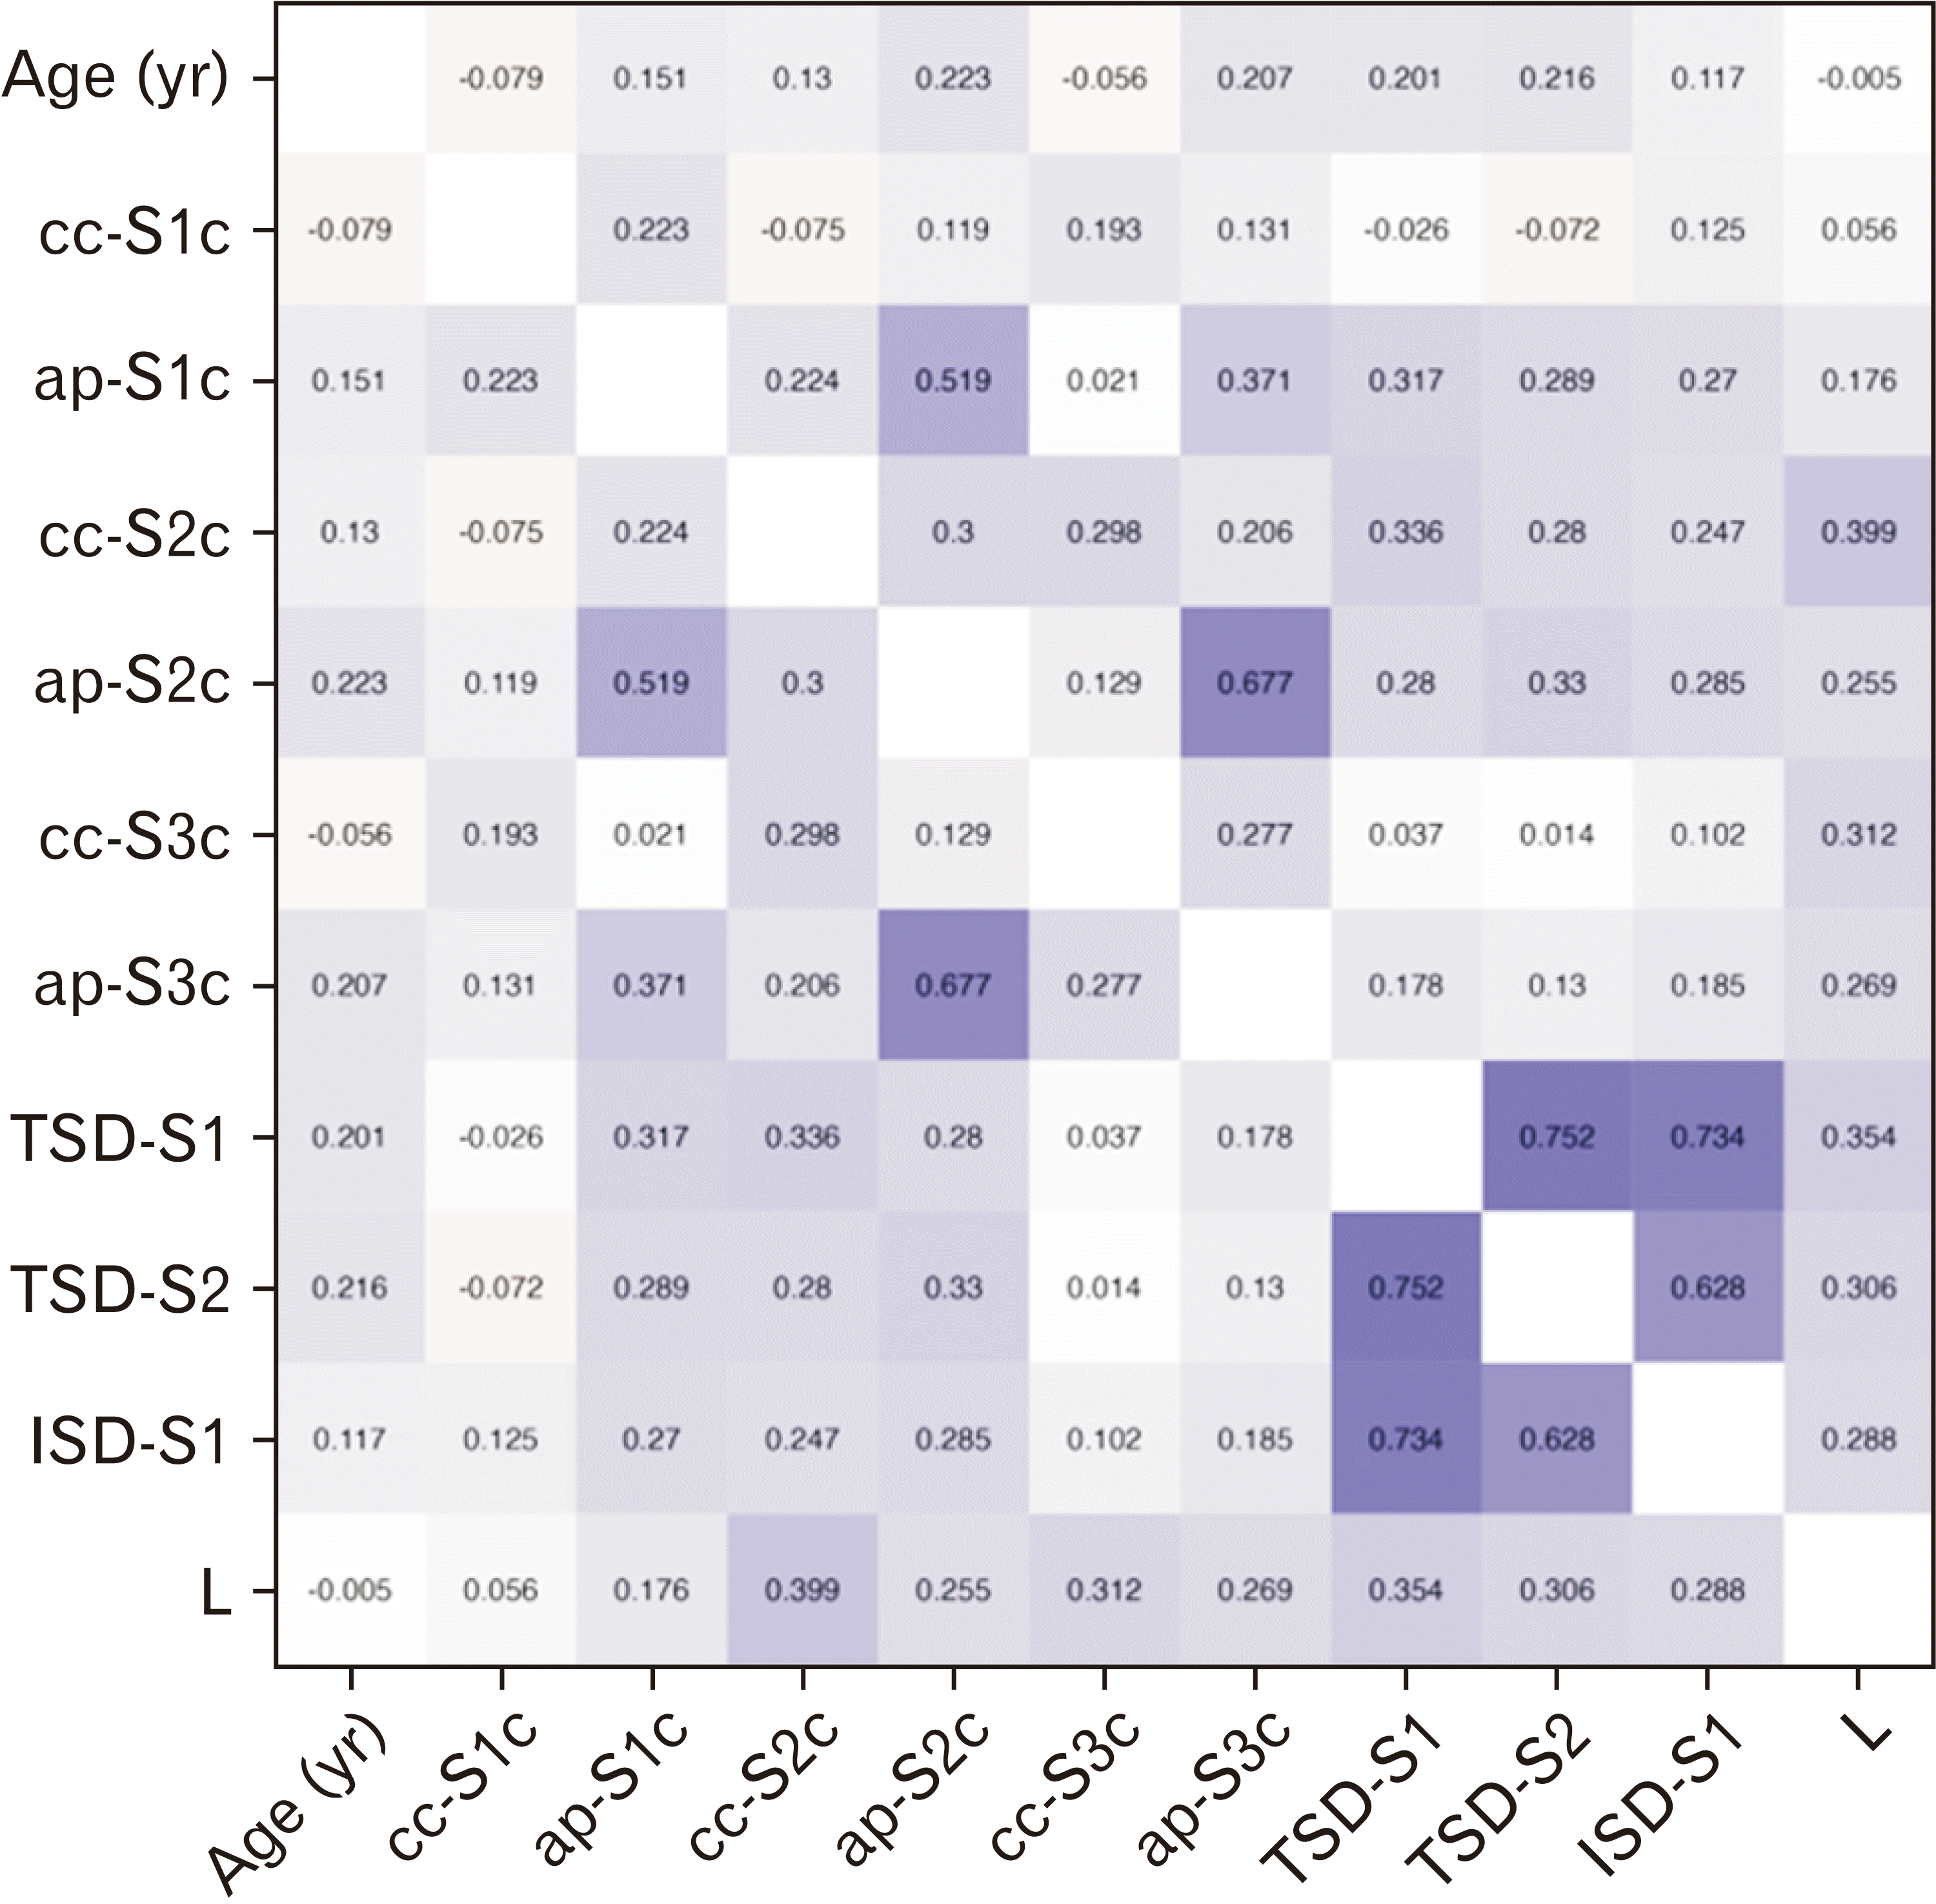
P<0.00016). The ap dimension of the second sacral corridor (ap-S2c) has a moderate correlation with ap-S1c (R=0.519) and ap-S3c (R=0.677).
In time, authors have detailed the morphological divergences of the sacrum and its developmental malformations [
1,
11]. These variations could change the symptoms and the surgical techniques during operations [
8,
12]. The lumbosacral junction is one of the most variable regions of the spinal column. When the fifth lumbar vertebra (L5) fuses to the first sacral segment (S1), it is called sacralization of the lumbar. In contrast, the fusion of S1 to the L5 is known as the lumbarization of the sacrum. The LSTV includes sacralized L5 and lumbarized S1 [
4]. The vertebral body develops by combining the caudal part of the sclerotome above and the cranial part of the sclerotome below. The intervertebral disc is formed by the mesenchymal cells. However, during the development, a variable fusion pattern between the caudal lumbar vertebra and the upper sacral segment has been observed [
12]. Based on a study by Woods et al. [
13], the corridor at the level of the first sacral body may be narrow or absent. Authors have reported a high rate of neurological complications during screw fixation. It is due to difficulty visualizing the complex anatomy of the upper sacral segments [
9]. In the current study, the cc and ap diameter of the upper three sacral segments have been accurately determined in both normal and LSTV sacra. The surgeons should keep this data in mind to avoid errant screw placement and neurovascular injury. Some published data regarding the Sc’s critical dimensions are available in the literature with varying results. The reported dimension varies greatly among researchers and populations (
Table 3). Wagner et al. [
3] considered >12 mm an adequate corridor. They found 48% adequate (non-critical) corridor at the S1 level and 79% at the S2 level in the European and Japanese populations. In the present sample, 97.2% of the corridor at the S1 level and 29.4% at the S2 level were adequate. The results of Keereewan et al. [
14] showed that all sacral dimensions of males were larger than those of females. Trikha et al. [
6] reported that the cc and ap diameters were significantly higher in males at the S1c level (
Table 3). The present study found no significant difference between males and females in the cc dimension (
Table 2). Other authors also did not find a similar difference [
3,
5,
15]. Trikha et al. [
6] might have observed the difference due to a lower sample size. However, the ap diameter was significant at all three sacral levels (
i.e., ap-S1c, ap-S2c, and ap-S3c) (
Table 2). Age-related changes in vertebral dimensions have been mentioned by some authors [
16]. The increase in vertebral body size among the elderly population due to periosteal apposition is a notable observation made by Junno et al. [
16]. This (periosteal apposition) results in increased cross-sectional area (CSA) of the vertebral body. These changes are observed to be sex-specific, as a marked increase in CSA of the vertebral body is found only in elderly males. Our findings align with the results of Junno et al. [
16] up to a certain extent. In the present study, the significant ap dimensions among the sexes may be due to the increased CSA in males. Understanding the age-related changes in vertebral dimensions becomes crucial for addressing implications for spinal health and function in elderly individuals. In the population aged 50 years or older, the prevalence of osteoporosis was reported to be 21% in females and 6% in males. Osteoporosis does reduce bone mineral density, leading to pelvic fractures in elderly females [
17]. We agree with the authors, but age does not affect the Sc dimension according to our observation in the present study. In a study by Iga [
15], 40.5% of the Japanese sample had adequate horizontal corridors (
i.e., >10 mm) in S1 and 69% in S2. The rest of the sample had less than 10 mm (inadequate) of dimension in S1 (59.5%) and S2 level (31%). The present study shows that S1c is appropriate for screw placement in 97.8% of males and 96.6% of females. The S2c allows safe space only in 34% and 24% of Indian males and females, respectively.
Table 3
Comparison of sacral corridors and their adequacy in different population
|
Sl no. |
Author |
Population |
Corridor |
Number |
Adequate/non-critical |
Inadequate/critical |
P-value |
|
1. |
Wagner et al. [3] |
European & Japanese |
cc-S1c |
Total (n=156) |
75 (48) |
81 (52) |
|
|
|
|
|
Male (n=79) |
44 (55) |
35 (45)*
|
0.06 |
|
|
|
|
Female (n=77) |
31 (40) |
46 (60)*
|
|
|
|
|
cc-S2c |
Total (n=156) |
123 (79) |
33 (21) |
|
|
|
|
|
Male (n=79) |
68 (86) |
11 (14)*
|
0.01 |
|
|
|
|
Female (n=77) |
55 (71) |
22 (29)*
|
|
|
2. |
Gras et al. [5]a)
|
European |
S1 |
Total (n=280) |
191 (68) |
89 (32) |
|
|
|
|
S2 |
Total (n=280) |
245 (88) |
35 (12) |
|
|
3. |
Iga [15]b)
|
Japanese |
S1 |
Total (n=42) |
17 (40) |
21 (50) |
|
|
|
|
S2 |
Total (n=42) |
29 (69) |
13 (31) |
|
|
4. |
Trikha et al. [6] |
Indian |
S1 |
Male (n=70)*
|
70 (100) |
- |
<0.005 |
|
|
|
|
Female (n=35)*
|
35 (100) |
- |
|
|
|
|
S2 |
Male (n=70) |
42.9 |
57.1 |
0.93 |
|
|
|
|
Female (n=35) |
25.7 |
74.3 |
|
|
5. |
Present study |
Indian |
cc-S1c |
Total (n=180) |
175 (97.2) |
5 (2.8) |
|
|
|
|
|
Male (n=91) |
89 (97.8) |
2 (2.2) |
0.06 |
|
|
|
|
Female (n=89) |
86 (96.6) |
3 (3.4) |
|
|
|
|
cc-S2c |
Total (n=180) |
53 (29.4) |
127 (70.6) |
|
|
|
|
|
Male (n=91) |
31 (34.1) |
60 (65.9) |
0.09 |
|
|
|
|
Female (n=89) |
22 (24.7) |
67 (75.3) |
|
|
|
|
cc-S3c |
Total (n=180) |
1 (0.6) |
179 (99.4) |
|
|
|
|
|
Male (n=91) |
0 (0.0) |
91 (100) |
0.155 |
|
|
|
|
Female (n=89) |
1 (1.1) |
88 (98.9) |
|

The data belongs to the north Indian region, so it may not be generalized to other populations. This is the limitation of this study. The corridor dimensions were measured by one observer. Therefore, interobserver reliability is not provided. We have not included the fractured sacrum in this study, which could have altered the result. In the present study, morphometry was done in a three-dimensional reconstructed image. Whereas in hospitals, two-dimensional images are commonly used. A comparative study with other populations was not done due to a lack of data.
In conclusion, S1c has the largest cc and ap diameter in the Indian population. The ap diameter of the corridor at S1c, S2c, and S3c levels was significant among males and females (P<0.05). The length of the sacrum also showed sacral dimorphism (P<0.05). The screw can be placed in the first sacral segment taking the safe margin in both LSTV and normal sacra, avoiding cortical breach and neurovascular damage. Knowledge of the adequacy of the corridor is helpful to orthopedic surgeons for placing screws during the fixation of the sacral fracture.


 PDF
PDF Citation
 Print
Print


 XML Download