Journal List > Prog Med Phys > v.33(4) > 1516087467

Yu, Kwon, Jang, Lee, Yu, Kim, Cho, Kim, Kim, Baek, and Choi: Dead Layer Thickness and Geometry Optimization of HPGe Detector Based on Monte Carlo Simulation

Abstract

Purpose

A full-energy-peak (FEP) efficiency correction is required through a Monte Carlo simulation for accurate radioactivity measurement, considering the geometrical characteristics of the detector and the sample. However, a relative deviation (RD) occurs between the measurement and calculation efficiencies when modeling using the data provided by the manufacturers due to the randomly generated dead layer. This study aims to optimize the structure of the detector by determining the dead layer thickness based on Monte Carlo simulation.

Methods

The high-purity germanium (HPGe) detector used in this study was a coaxial p-type GC2518 model, and a certified reference material (CRM) was used to measure the FEP efficiency. Using the MC N-Particle Transport Code (MCNP) code, the FEP efficiency was calculated by increasing the thickness of the outer and inner dead layer in proportion to the thickness of the electrode.

Results

As the thickness of the outer and inner dead layer increased by 0.1 mm and 0.1 µm, the efficiency difference decreased by 2.43% on average up to 1.0 mm and 1.0 µm and increased by 1.86% thereafter. Therefore, the structure of the detector was optimized by determining 1.0 mm and 1.0 µm as thickness of the dead layer.

Conclusions

The effect of the dead layer on the FEP efficiency was evaluated, and an excellent agreement between the measured and calculated efficiencies was confirmed with RDs of less than 4%. It suggests that the optimized HPGe detector can be used to measure the accurate radioactivity using in dismantling and disposing medical linear accelerators.

Introduction

Recently, radiotherapy technologies such as intensity-modulated radiation therapy and volumetric modulated arc therapy have substantially advanced, making it possible to improve the accuracy of treatment by providing higher-dose conformity to the tumor and better sparing of surrounding normal organs [1]. In clinical practice, the medical linear accelerator is the most typically used radiation generator for cancer treatment. Its use is rapidly increasing, and its role is becoming crucial [2]. The energy used for radiotherapy is mainly 6-MV photon beams, but photon beams of 10 MV or higher than 15 MV are sometimes suitable for treating deep-seated tumors [3]. However, a high-energy photon beam of more than 10 MV can cause neutron contamination in the linear accelerator head components through a photonuclear reaction (γ, n) and neutron capture reaction (n, γ) [4]. Therefore, the concentration of radioactivity must be measured in each part when dismantling and disposing a linear accelerator to classify and manage radioactive waste.
High-purity germanium (HPGe) detectors have superior energy resolution. Therefore, they are widely used in gamma-ray spectroscopy to identify gamma-emitting nuclides and determine their radioactivity in environmental samples or radioactive waste [5,6]. To measure the radioactivity of radionuclides accurately, the full-energy-peak (FEP) efficiency of the detector must be calibrated, considering various geometric characteristics such as the size, shape, and composition of each sample [7]. In general, efficiency calibration is performed by measuring a certified reference material (CRM) with known radionuclide activity and gamma-ray emission probability. However, it is challenging to obtain a complete calibration based only on the experimental basis because the linear accelerator is produced with various materials of part and structures by different manufacturers [8,9]. Thus, in recent years, detection efficiency calibration using Monte Carlo simulations has become an alternative to experimental methods. Konstantinova et al. used MC N-Particle Transport (MCNP) 6 to correct the detection efficiency of the coaxial HPGe detector to fulfill the 5% to 10% criteria according to the filling height of the cobalt-60 (60Co) volume source [8]. Aviv and Elia [10] used GEANT4 and FLUKA to correct the FEP difference of a broad-energy HPGe detector within 5% of the experimental value for point-like, filter paper, and water beaker-type sources.
The HPGe detector consists of various structures, such as an endcap, a cryostat, an IR window, a Ge crystal, and an electrode. In particular, the manufacturer provided most of the parameter dimensions. However, the dead layer thickness varies for each detector as the lithium ions of the electrode are non-uniformly diffused into the Ge crystal according to the aging degree of the detector, storage temperature, and distribution of impurities [11]. Bölükdemir et al. [12] used PHITS to calculate the detection efficiency of an HPGe detector from a point source and determined that applying the thickness provided by the manufacturer caused a difference of up to 115% from the experimental efficiency. Moreover, the results confirmed that the dead layer thickness showed that the minimum difference differed by 0.59 mm from that of the manufacturer [12]. That is, a significant deviation occurs between the calculated and measured efficiencies when the data provided by the manufacturer is used in the simulation model as it is. Therefore, the dead layer thickness for each detector must be determined. In this study, the Monte Carlo simulation was used to analyze the effect of the dead layer thickness on the detection efficiency of the HPGe detector. Moreover, the dead layer thickness representing the minimum RD between the calculated and measured efficiencies was determined to optimize the geometry of the detector.

Materials and Methods

1. Experimental measurements

The HPGe detector used in this study was a coaxial p-type GC2518 model manufactured by Canberra (Meriden, CT, USA) in 2011. The detector has a typical relative efficiency and an energy resolution of 25% and 1.72 keV, respectively, for the 60Co gamma ray at 1,332 keV.
A CRM, a mixture of ten gamma-emitting nuclides, was used as the standard source to determine the FEP efficiency. The CRM was a 40-mL charcoal filter-type solid-state source contained in a cylindrical polyethylene container with a diameter and height of 62 mm and 28 mm, respectively. Table 1 lists the information on the included gamma-ray-emitting nuclides. Measurements were performed by placing the source on the top of the detector endcap to minimize scattering or absorption of the emitted gamma rays before reaching the detector. Subsequently, gamma spectra acquisition and analysis were performed with Canberra’s Genie-2000 spectroscopy software, and all spectra were recorded with 8,192 channels in the energy range from 0 to 3 MeV.

2. Monte Carlo simulation

1) Adjusting the dead layer thickness

The MCNP version 6.2 developed by Los Alamos National Laboratory (Los Alamos, NM, USA) was used to perform the modeling of the HPGe detector, based on manufacturer-provided data except for the dead layer thickness, as shown in Fig. 1. Table 2 lists the materials and dimensions of the detector of optimal model. The location of the dead layer was set to the outer and inner surfaces of the Ge crystal in contact with the lithium electrodes. The effect of the detection efficiency was observed to determine the dead layer thickness, where the deviation of FEP efficiency between the measured value and the calculated value is within 10%. Thus, the outer layer was gradually increased by 0.1 mm, and the simulation was repeated while increasing the inner layer by 0.1 µm. In addition, the diameter and length of the Ge crystal were set to fluctuate depending on the dead layer thickness. The CRM was modeled by applying the same conditions as the measurements, and the emitted gamma rays were transported according to the ENDF/B-VI.8 nuclear data library. Moreover, processes such as coherent and incoherent scattering, photoelectric absorption, and pair production were considered for photon interactions.
The F8 pulse height tally was included in the MCNP simulation input file to acquire the energy spectrum of the gamma rays absorbed by the Ge crystal. The result of each tally was recorded in 8,192 energy bins, corresponding to the number of detector channels. To achieve sufficient statistical uncertainty, 108 number of particles (nps) were used in each run, and the relative error was less than 1%.
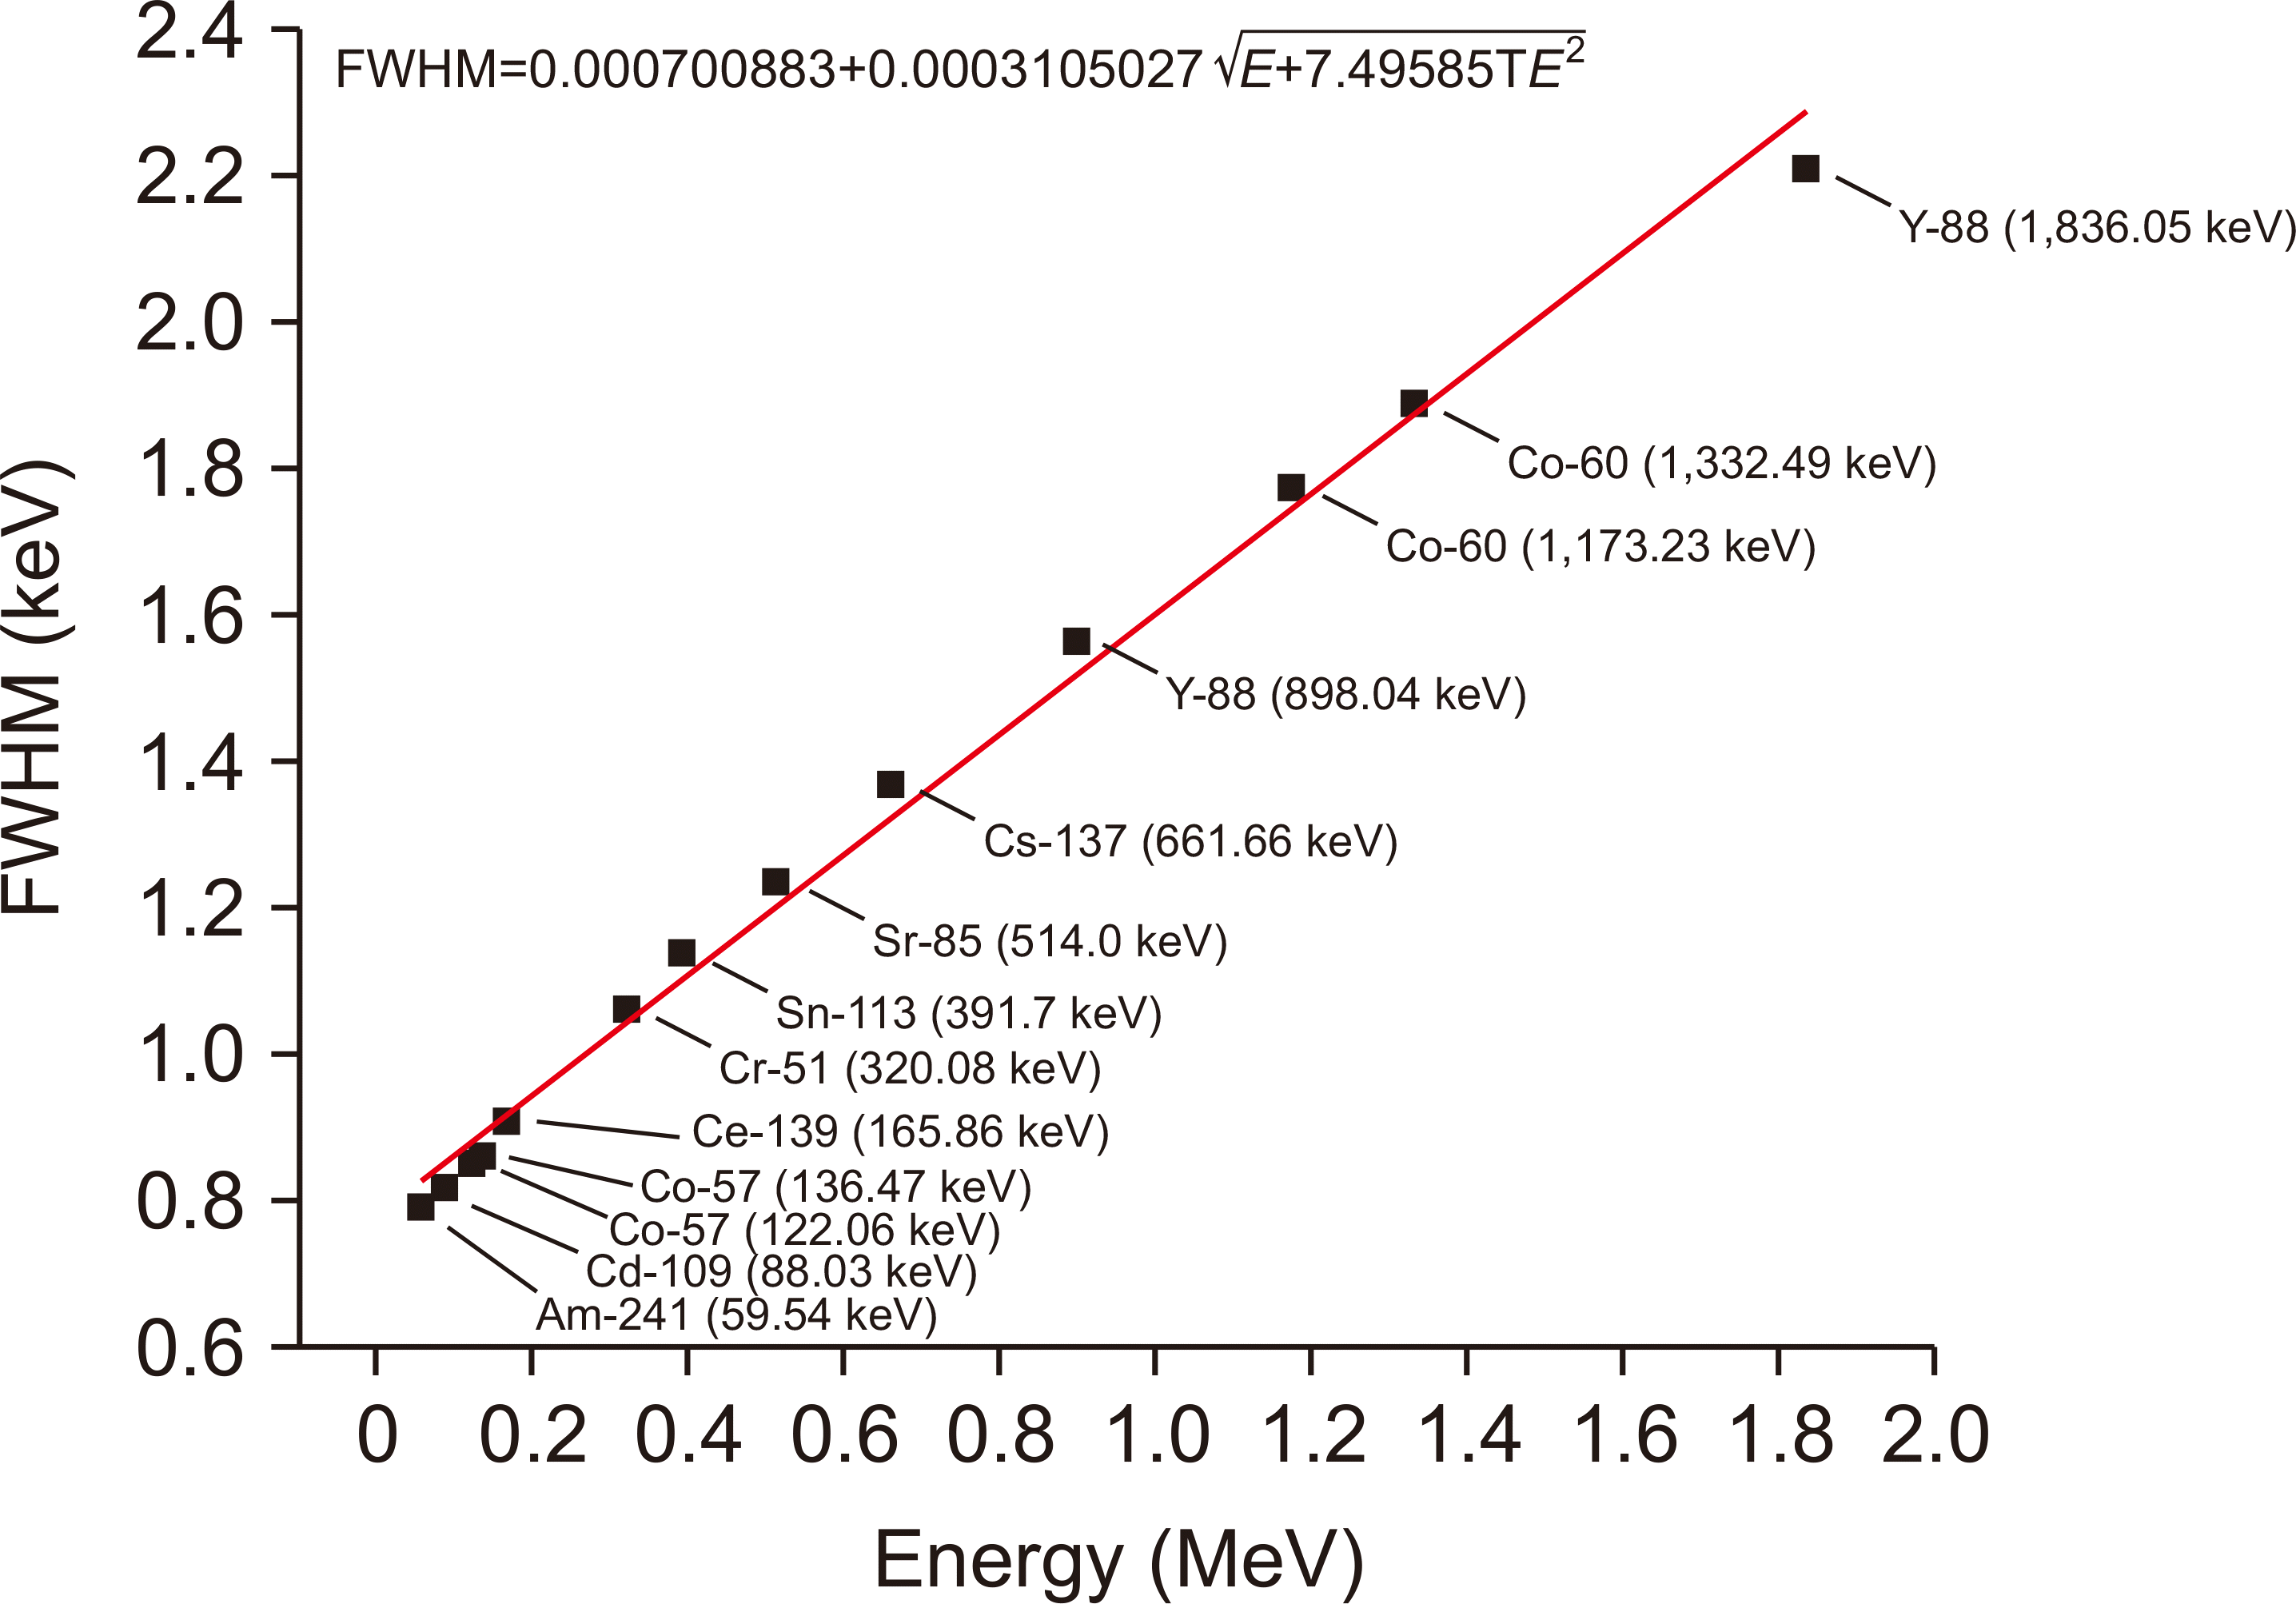
The Gaussian energy-broadening (GEB) card option was used to apply the actual detector-specific energy resolution. Moreover, the parameters of the GEB were derived by approximating Eq. (1):
(1)
FWHM=a+b×E+c×E2
using the least squares method based on each full width half maximum (FWHM) obtained by measurement. In the equation, E is the energy of the gamma rays emitted by each nuclide, and parameters a, b, and c are given in MeV, MeV1/2, and MeV−1, respectively. Fig. 2 shows the obtained FWHM values, and the coefficients in the fitting Eq. (1) were derived as a=0.000700883, b=0.0003105027, and c=7.49585.

2) Determination of the dead layer thickness.

The FEP efficiency can be defined as the ratio of the peak counting rate to the gamma-ray emission rate of the source and can be calculated using Eq. (2):
(2)
εE=NEA×Iγ
where NE is the counting rate of the full energy peak corresponding to energy E in counts per second, A is the activity of the source in Bq, and Iγ is the gamma emission probability of energy E.
The RD between the measured FEP efficiency (εext) and the calculated FEP efficiency (εsim) can be obtained using Eq. (3):
(3)
Relative deviaition %= εsim εextεext × 100
The detector geometry was optimized by determining the dead layer thickness with the minimum RD.

Results

The dead layer thickness where the RD between the measured and calculated values is minimal was determined by repeatedly performing simulations increasing the thickness of the outer and inner dead layers proportionally to the thickness of the lithium electrode. The energy range was divided into 59.54–514.01 keV and 661.66–1332.5 keV so that the RD was within 10%. In addition, normalization was performed to minimize the efficiency difference of the lowest energy. Fig. 3 shows the average RD according to the thickness of each dead layer for all energy ranges. As the thickness of the outer and inner dead layers increased by 0.1 mm and 0.1 µm, respectively, the RD decreased by 2.43% on average up to 1.0 mm and 1.0 µm. Subsequently, the RD increased by approximately 1.86%. Therefore, 1.0 mm and 1.0 µm were determined as the thicknesses of the dead layers. In addition, the Ge crystal diameter and length and the hole depth varied according to the dead layer thickness.
Table 3 lists the RD before and after optimization. The initial model to which the manufacturer information was applied was 28.588%, whereas the model optimized by the simulation decreased to 3.293% on average. Finally, by analyzing the effect of the dead layer by energy, the results confirmed that the low-energy band of 514.01 keV or less was affected six times more than the high-energy band.

Discussion

Previous studies indicate that the frontal dead layer thickness, Ge crystal diameter and length, and hole dimension are the main parameters to accurately calibrate a coaxial HPGe detector [13]. The HPGe detector used in this study is a coaxial p-type detector manufactured 11 years ago. The thicknesses of the outer and inner dead layers with minimal difference between experimental and calculated efficiencies were determined as 1.0 mm and 1.0 µm, respectively, and the dimensions of crystals and holes were optimized. The discrepancy between the manufacturer-provided values and the simulation-optimized values for parameters other than the dead layer is due to the uncertainty in the dimensions provided by the manufacturers. The manufacturer data were measured at room temperature, whereas the actual temperature at which the detector was operated was approximately −196°C, cooled with liquid nitrogen [8,14]. Previous studies on the same detector type have reported similar results to the results in this study. In particular, the results are consistent with those of Loan [15], which calculated a dead layer of 0.57 mm for a detector fabricated 3 years ago. Moreover, Andreotti et al. [11] reported a dead layer of 0.8 mm for a detector fabricated 8 years ago. Finally, Huy [16] reported a dead layer of 1.46 mm for a detector operated for 13 years. In addition, when calibrating the detector for general measurement purposes, a relative efficiency difference within 5%–10% is considered an acceptable range. However, the efficiency difference in this study was within a minimum of 0.2%, a maximum of 9.8%, and an average of 3.2%, which are reasonable results [13].
A dead layer is created when lithium ions diffuse into the crystal depending on the aging degree of the detector and the storage temperature, generating a slow pulse that increases the loss of charge due to recombination [11]. Moreover, due to the incomplete charge collection, a dead layer is spread non-homogenously into the crystal so that the dead layer thickness is not uniform in all sections. This aspect is cumbersome to consider because it is challenging to analyze the pulse shape for each dead layer section. Therefore, a mechanism that can simplify this is necessary and will be considered in future research.
Many previous studies analyzed the dead layer influence on the efficiency of HPGe detectors, but this study differs in several points of emphasis [17]. This study is a preliminary study to calibrate the self-absorption effect that occurs when evaluating the activation degree of the linear accelerator with the HPGe detector through Monte Carlo simulation. Therefore, to consider the shape of the linear accelerator component, a volume source rather than a point source was used, and both low- and high-energy bands were included to consider radionuclides emitted from disposed linear accelerator, such as 60Co, 181W, 187W, and 56Mn [18]. In addition, the detector used was not provided with the dead layer thickness at the time of manufacture, so the location of the dead layer was set by dividing the outer electrode and the inner electrode into contact, and it was adjusted in proportion to the thickness of the electrode.

Conclusions

In this study, a Monte Carlo simulation code was used to analyze the detection efficiency variations of an HPGe detector according to the dead layer thickness. Measurements and simulations were performed in the gamma-ray energy range of 50–1400 keV. The results confirmed that an increase in the dead layer thickness affected the reduction of the detection efficiency and that the low-energy region of 500 keV or less was more affected by the dead layer than the high-energy region. In addition, the structure of the detector was optimized such that the RD was reduced to less than 4% by comparing the measured and calculated values. The implemented method is expected to be applied to calibrate n-type and in situ HPGe detectors. In particular, a more accurate radioactivity measurement could be possible via calibrated HPGe considering the dead layer thickness and the shape and components of the measurement sample based on the Monte Carlo simulation when dismantling or disposing of a linear accelerator in the future.

Acknowledgments

This research was supported by the National Research Foundation of Korea (NRF) grant (No. 2020M2D9A309417021) and the Nuclear Safety Research Program through the Korea Foundation of Nuclear Safety (KoFONS) using the financial resource granted by the Nuclear Safety and Security Commission (NSSC) of the Republic of Korea (No.2003013&2205013).

Notes

Conflicts of Interest

The authors have nothing to disclose.

Availability of Data and Materials

The data that support the findings of this study are available on request from the corresponding author.

Author Contributions

Conceptualization: Suah Yu, Na Hye Kwon, and Sang Hyoun Choi. Data curation: Suah Yu and Na Hye Kwon. Funding acquisition: Sang Hyoun Choi and Dong-wook Kim. Investigation: Gyu-Seok Cho and Kum-Bae Kim. Methodology: Byungchae Lee and JiHyun Yu. Project administration: Sang Hyoun Choi. Validation: Cheol Ha Baek. Visualization: Young Jae Jang. Writing–original draft: Suah Yu and Na Hye Kwon. Writing–review and editing: Suah Yu, Na Hye Kwon, and Sang Hyoun Choi.

References

1. Alhazmi A, Gianoli C, Neppl S, Martins J, Veloza S, Podesta M, et al. 2018; A novel approach to EPID-based 3D volumetric dosimetry for IMRT and VMAT QA. Phys Med Biol. 63:115002. DOI: 10.1088/1361-6560/aac1a6. PMID: 29714714.
crossref
2. Huh HD, Kim S. 2020; History of radiation therapy technology. Prog Med Phys. 31:124–134. DOI: 10.14316/pmp.2020.31.3.124.
crossref
3. Farhood B, Ghorbani M, Abdi Goushbolagh N, Najafi M, Geraily G. 2020; Different methods of measuring neutron dose/fluence generated during radiation therapy with megavoltage beams. Health Phys. 118:65–74. DOI: 10.1097/HP.0000000000001130. PMID: 31764421.
crossref
4. Israngkul-Na-Ayuthaya I, Suriyapee S, Pengvanich P. 2015; Evaluation of equivalent dose from neutrons and activation products from a 15-MV X-ray LINAC. J Radiat Res. 56:919–926. DOI: 10.1093/jrr/rrv045. PMID: 26265661. PMCID: PMC4628218.
crossref
5. Trang LTN, Chuong HD, Thanh TT. 2021; Optimization of p-type HPGe detector model using Monte Carlo simulation. J Radioanal Nucl Chem. 327:287–297. DOI: 10.1007/s10967-020-07473-2.
crossref
6. Kaya S, Çelik N, Bayram T. 2022; Effect of front, lateral and back dead layer thicknesses of a HPGe detector on full energy peak efficiency. Nucl Inst Methods Phys Res. 1029:166401. DOI: 10.1016/j.nima.2022.166401.
crossref
7. Novotny SJ, To D. 2015; Characterization of a high-purity germanium (HPGe) detector through Monte Carlo simulation and nonlinear least squares estimation. J Radioanal Nucl Chem. 304:751–761. DOI: 10.1007/s10967-014-3902-7.
crossref
8. Konstantinova M, Germanas D, Gudelis A, Plukis A. 2021; Efficiency calibration of high-purity germanium detector using Monte Carlo simulations including coincidence-summing corrections: volume source case. Lith J Phys. 61:66–73. DOI: 10.3952/physics.v61i1.4408.
crossref
9. Subercaze A, Sauzedde T, Domergue C, Destouches C, Philibert H, Fausser C, et al. 2022; Effect of the geometrical parameters of an HPGe detector on efficiency calculations using Monte Carlo methods. Nucl Inst Methods Phys Res. 1039:167096. DOI: 10.1016/j.nima.2022.167096.
crossref
10. Aviv O, Elia P. 2020; Monte-Carlo simulations of the full-energy-peak efficiency for a broad-energy germanium detector-a comparison between GEANT4 and FLUKA. J Inst. 15:P05016. DOI: 10.1088/1748-0221/15/05/P05016.
crossref
11. Andreotti E, Hult M, Marissens G, Lutter G, Garfagnini A, Hemmer S, et al. 2014; Determination of dead-layer variation in HPGe detectors. Appl Radiat Isot. 87:331–335. DOI: 10.1016/j.apradiso.2013.11.046. PMID: 24331853.
crossref
12. Bölükdemir MH, Uyar E, Aksoy G, Ünlü H, Dikmen H, Özgür M. 2021; Investigation of shape effects and dead layer thicknesses of a coaxial HPGe crystal on detector efficiency by using PHITS Monte Carlo simulation. Radiat Phys Chem. 189:109746. DOI: 10.1016/j.radphyschem.2021.109746.
crossref
13. Liye L, Jizeng M, Franck D, Carlan LD, Binquan Z. 2006; Monte Carlo efficiency transfer method for full energy peak efficiency calibration of three type HPGe detectors: a coaxial N-type, a coaxial P-type and four BEGe detectors. Nucl Inst Methods Phys Res. 564:608–613. DOI: 10.1016/j.nima.2006.03.013.
crossref
14. Boson J, Ågren G, Johansson L. 2008; A detailed investigation of HPGe detector response for improved Monte Carlo efficiency calculations. Nucl Inst Methods Phys Res. 587:304–314. DOI: 10.1016/j.nima.2008.01.062.
crossref
15. Loan TTH, Ba VN, Thy THN, Hong HTY, Huy NQ. 2018; Determination of the dead-layer thickness for both p- and n-type HPGe detectors using the two-line method. J Radioanal Nucl Chem. 315:95–101. DOI: 10.1007/s10967-017-5637-8.
crossref
16. Huy NQ. 2011; Dead-layer thickness effect for gamma spectra measured in an HPGe p-type detector. Nucl Inst Methods Phys Res. 641:101–104. DOI: 10.1016/j.nima.2011.02.097.
crossref
17. Elanique A, Marzocchi O, Leone D, Hegenbart L, Breustedt B, Oufni L. 2012; Dead layer thickness characterization of an HPGe detector by measurements and Monte Carlo simulations. Appl Radiat Isotopes. 70:538–542. DOI: 10.1016/j.apradiso.2011.11.014. PMID: 22115878.
crossref
18. Kwon NH, Jang YJ, Kim J, Kim KB, Yoo J, Ahn SH, et al. 2021; Measurements of neutron activation and dose rate induced by high-energy medical linear accelerator. Prog Med Phys. 32:145–152. DOI: 10.14316/pmp.2021.32.4.145.
crossref

Fig. 1
Internal structure (a) and section of the high-purity germanium (HPGe) detector in the MC N-Particle Transport (MCNP) code (b). CRM, certified reference material.
pmp-33-4-129-f1.tif
Fig. 2
Energy and full width half maximum (FWHM) obtained by gamma-ray spectroscopy.
pmp-33-4-129-f2.tif
Fig. 3
Relative difference between the measured and calculated values according to the dead layer thickness.
pmp-33-4-129-f3.tif
Table 1
Specification of the CRM*
Nuclides Photon energy (keV) Emission rate (%) Activity (Bq) Uncertainty (%)
241Am 59.54 35.92 672 4.0
109Cd 88.03 3.66 3,603 4.2
57Co 122.06 85.49 215 4.0
136.47 10.71
139Ce 165.86 79.90 211.5 4.0
51Cr 320.08 9.89 21,949 4.0
113Sn 391.70 67.97 571 4.0
85Sr 514.00 98.5 711 4.1
137Cs 661.66 84.99 322 4.0
60Co 1173.23 99.85 445 4.0
1332.49 99.9826
88Y 898.04 93.7 1,055 4.0
1,836.05 99.346

CRM, certified reference material.

*CRM was produced by Korea Research Institute of Standards and Science (KRISS) on May 1, 2022.

Table 2
Materials and dimensions of key parameters of the optimal model
Parameter Material Dimensions of the optimal model (mm)
Crystal diameter Germanium 59.8
Crystal length 42
Endcap to crystal distance 5
Hole diameter Vacuum 7.5
Hole depth 23.2
Endcap diameter Aluminum 76
IR window thickness Mylar 0.00846
Kapton 0.10083
Window electrode thickness Lithium 0.42
Outer electrode thickness 0.42
Inner electrode thickness 0.0003
Outer dead layer thickness Germanium 0.1
Inner dead layer thickness 0.1 µm
Table 3
Comparison of the measured and simulated efficiencies of the optimized detector
E (keV) Measured efficiency (%) Simulated efficiency (%) RD (%)


Initial model Optimal model Initial model Optimal model
59.54 0.0352 0.0986 0.0351 180.24 −0.32
88.03 0.0708 0.0999 0.0687 41.04 −2.98
122.06 0.0812 0.0949 0.0789 16.82 −2.86
320.08 0.0414 0.0426 0.0424 2.87 2.36
391.69 0.0359 0.0353 0.0358 −1.63 −0.25
514.01 0.0270 0.0250 0.0260 −7.41 −3.81
661.66 0.0221 0.0224 0.0236 1.20 6.78
898.04 0.0156 0.0147 0.0158 −5.90 1.33
1,173.24 0.0118 0.0105 0.0115 −10.72 −2.36
1,332.5 0.0107 0.0088 0.0097 −18.05 −9.86
Mean - - - 28.59 3.29

RD, relative deviation.

TOOLS
Similar articles