This article has been
cited by other articles in ScienceCentral.
Dear Editor,
Therapeutic drug monitoring of adalimumab is commonly performed using ELISA [
1]. Liquid chromatography-tandem mass spectrometry (LC-MS/MS) and LC-high-resolution MS (LC-HRMS) are also popular methods [
2]. Target enrichment is typically used to measure pharmacologically active drug concentrations, whereas the IgG-enrichment strategy can provide total drug concentrations. The presence of anti-drug antibodies (ADA), which can lead to the formation of drug–ADA complexes in the circulation, can interfere with the pharmacological effect and drug determination [
3]. We investigated potential biases in different enrichment strategies for LC-HRMS, particularly in patients with ADA.
Plasma samples (N=31) were collected from 19 patients with ankylosing spondylitis between September 2021 and May 2023 at the Department of Rheumatology, The First Affiliated Hospital of Soochow University (Suzhou, China). The adalimumab concentrations were above 1 μg/mL as determined using an in-house ELISA [
4]. ADA levels were measured using electrochemiluminescence (Meso Scale Discovery, Rockville, MD, USA), as reported [
4]. The study was approved by the Ethical Committee of The First Affiliated Hospital of Soochow University (No. 2021-078).
Plasma samples were incubated with immunomagnetic beads and digested with trypsin. In brief, excess magnetic beads (300-nm streptavidin beads; Beaver, Suzhou, China) coupled with biotinylated tumor necrosis factor (TNF)-α (1.5 μg TNF-α/mg beads, a two-fold molar ratio to the upper limit of adalimumab) were added to the samples and incubated for 10 mins [
5]. Subsequently, the adalimumab-bound beads were thoroughly washed and denatured in an ammonium bicarbonate solution at 80°C for 30 mins. Then, trypsin (V5117; Promega, Madison, WI, USA) was added at a ratio of 1:20 (enzyme/protein,
w/w) for digestion at 60°C for 6 hrs. The reactions were quenched by the addition of formic acid, and the supernatants containing the peptide mixtures were collected.
For the IgG-enrichment procedure, the major modification was the use of excess protein-A beads with a two-fold binding capacity relative to total IgG concentrations (Magrose Protein-A; Beaver) instead of TNF-α beads to capture human IgG from acid-treated plasma [
6]. The digested samples were analyzed using LC-HRMS (Q Exactive Plus-Orbitrap LC-MS/MS System, Thermo Fisher Scientific). To identify signature peptides of adalimumab, peptide mapping was performed in the Full MS/ddMS
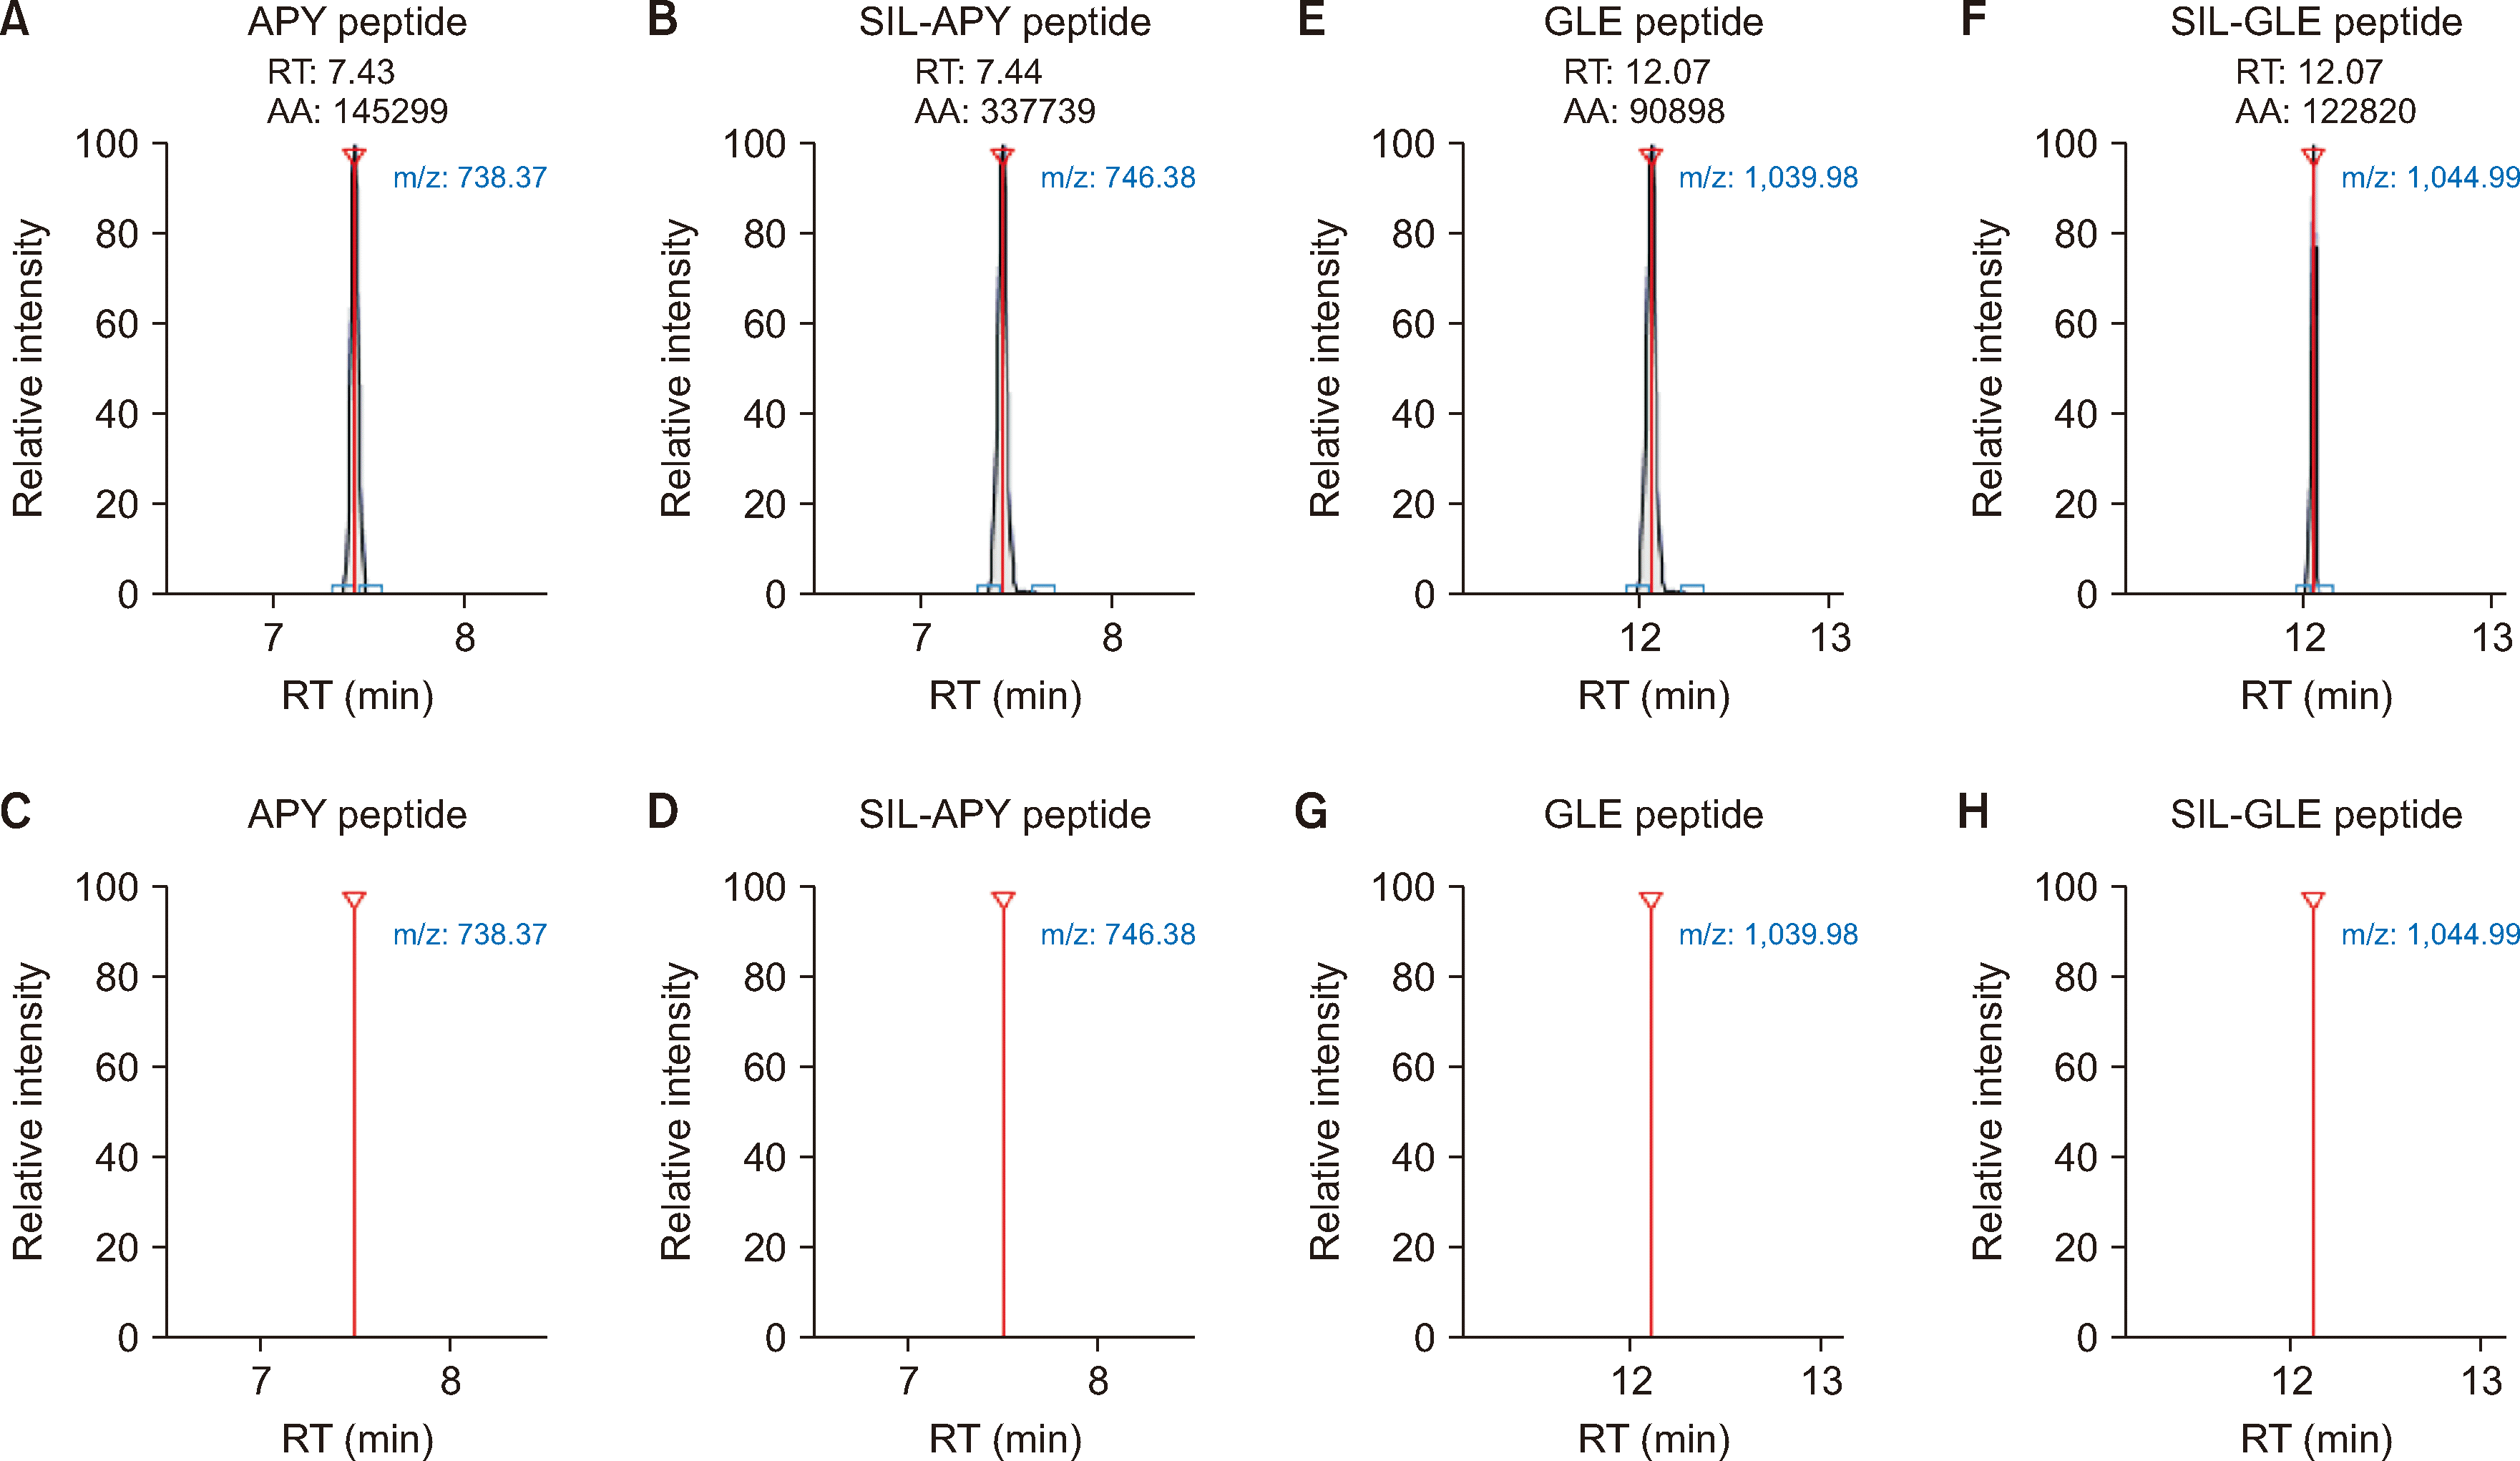
2 mode using the digested mixtures. To confirm specificity and selectivity, quantitative analysis was performed in the parallel reaction monitoring mode. Initially, the commonly used peptide APYTFGQGTK (APY,
m/z 535.27→738.37), derived from the light chain, was selected as the signature peptide. However, in the IgG-enrichment strategy, a specific interference at the corresponding retention time of the APY peptide occurred, indicating that an interfering peptide with a similar structure may be present in the immunoglobulin repertoire [
7]. The peptide GLEWVSAITWNSGHIDYADSVEGR (GLE,
m/z 888.42→1039.98), originating from the heavy chain, exhibited good specificity and sensitivity and was therefore used in the IgG-enrichment strategy. Representative chromatograms are shown in
Fig. 1. Adalimumab stable isotope-labeled full-length antibody (MSQC11, Sigma-Aldrich, St. Louis, MO, USA) was used as an internal standard to correct for sample pretreatment and instrumental analysis. Calibration curves were in the range of 0.5–32 μg/mL for target enrichment and 1–32 μg/mL for IgG enrichment. The methods were validated according to the reported criteria [
8].
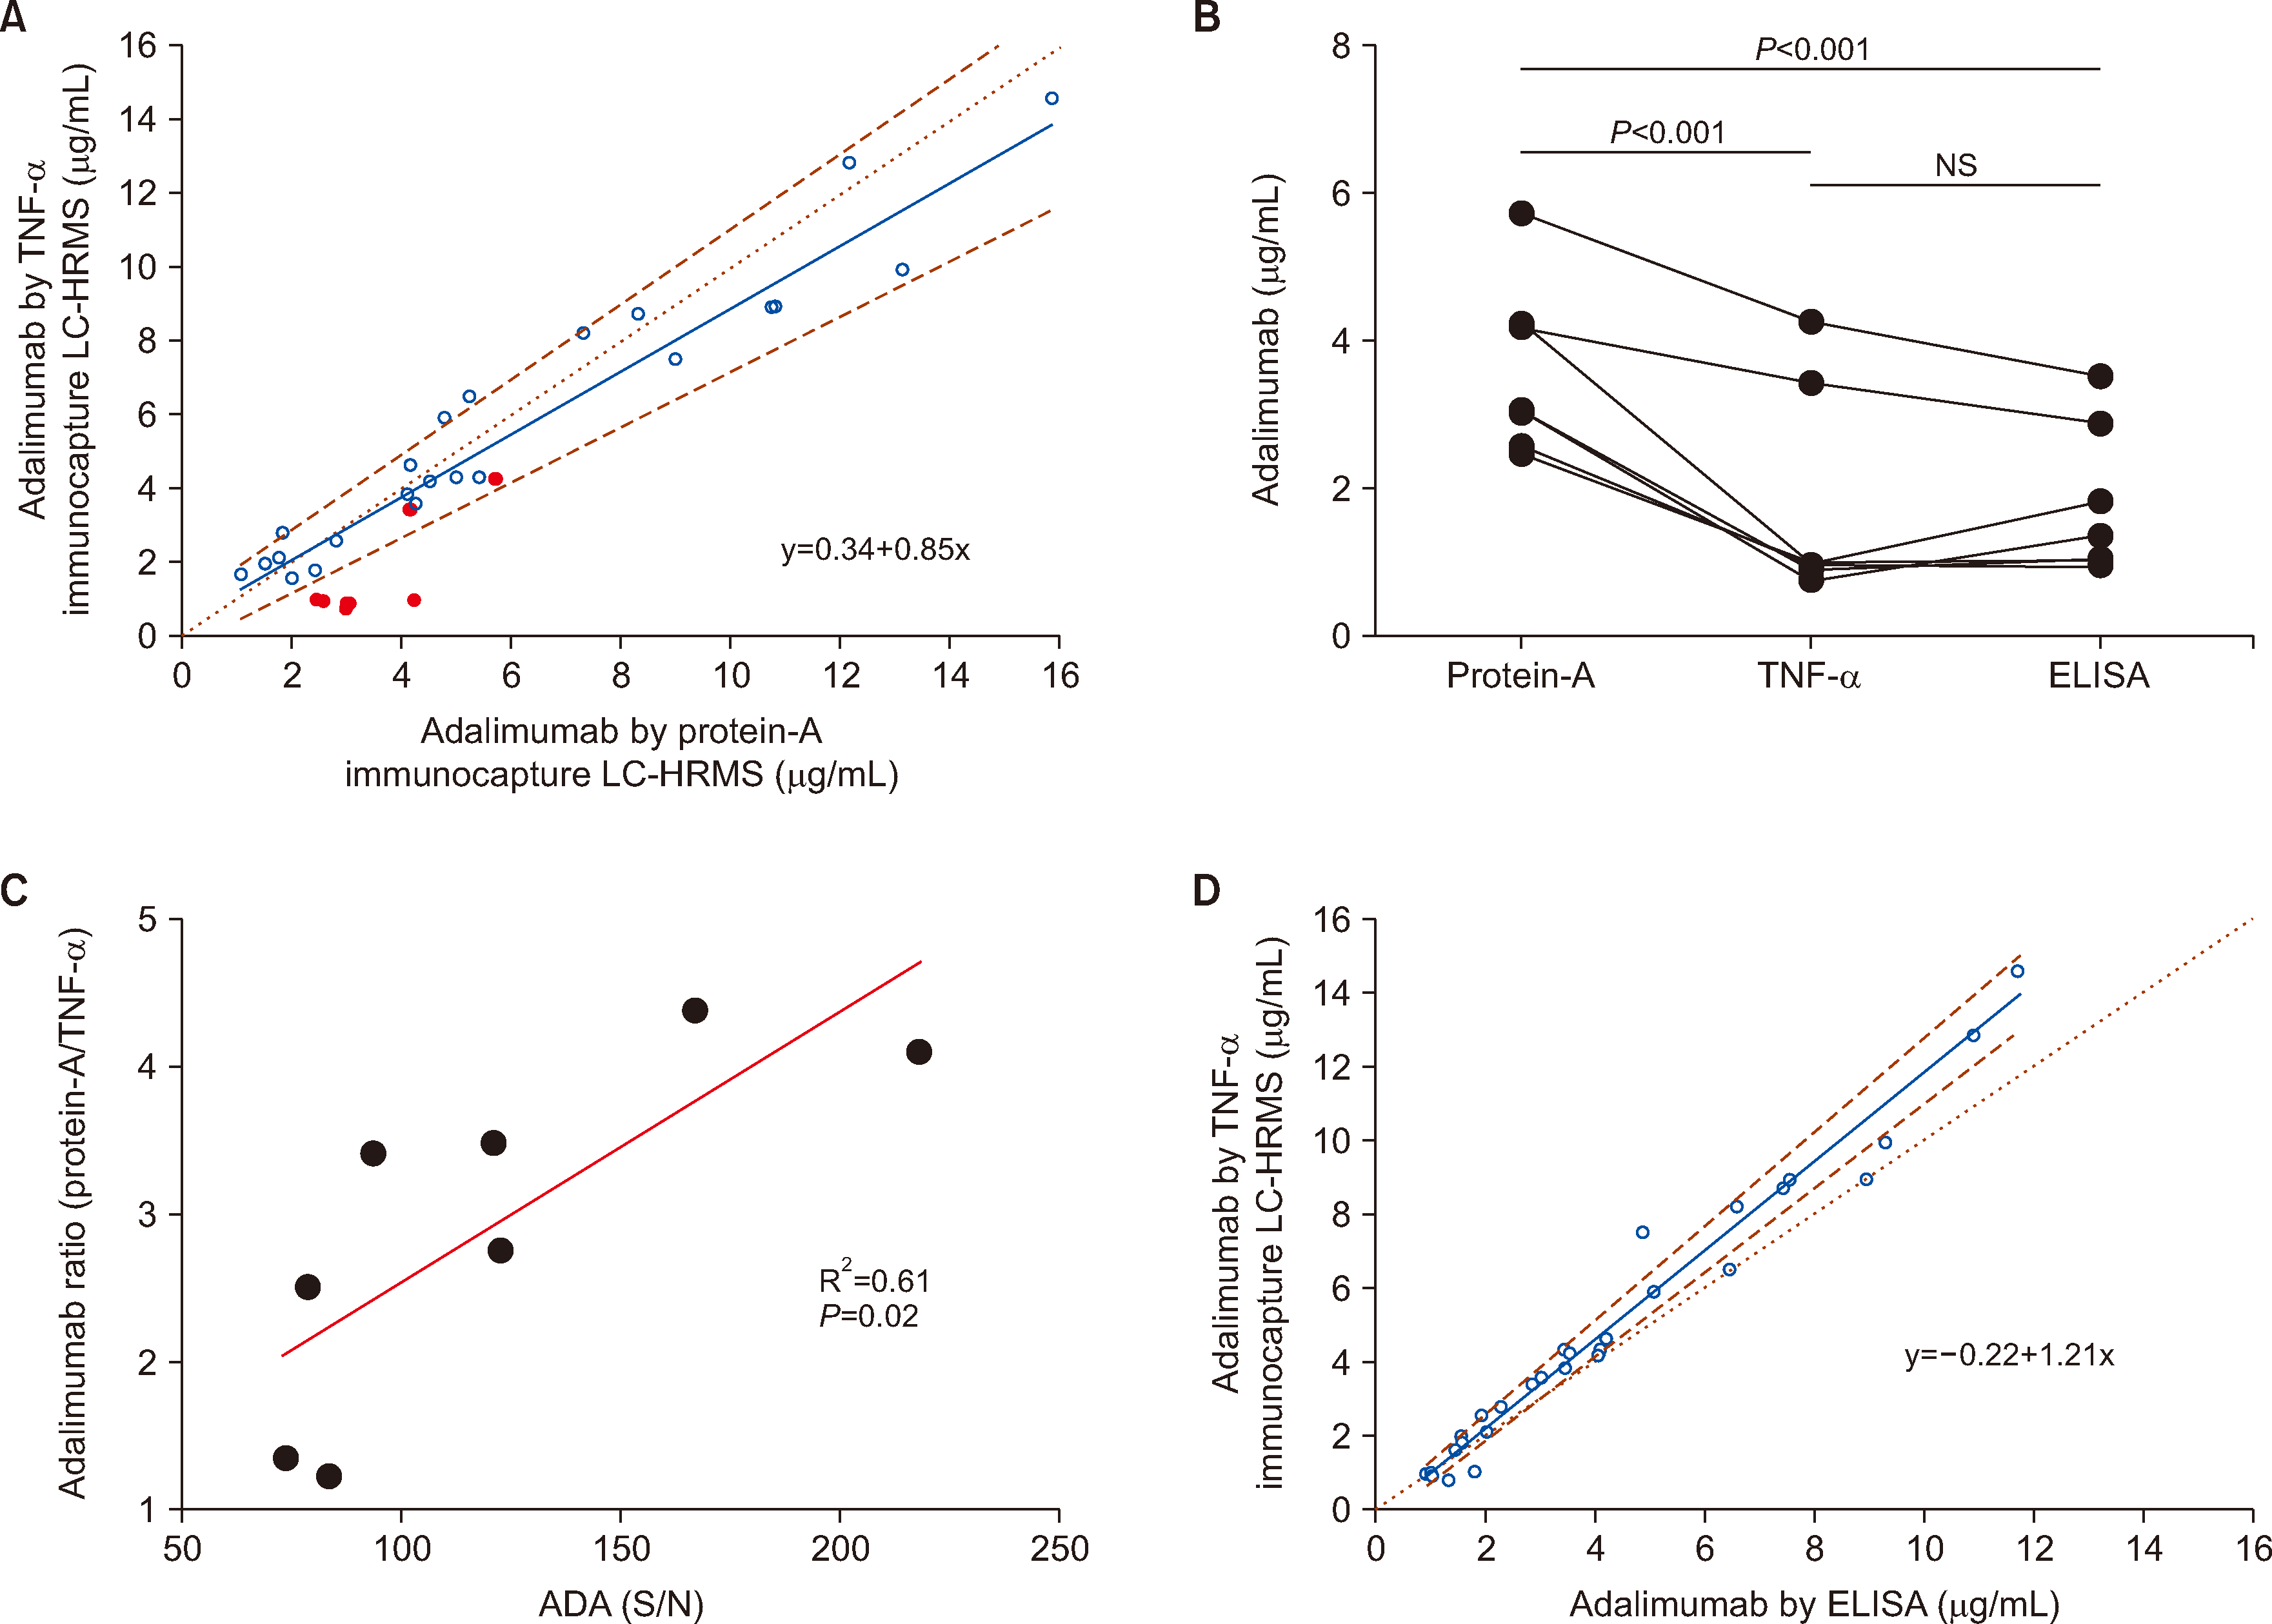
Among the 31 samples analyzed, eight were ADA-positive. Passing–Bablok linear regression analysis revealed a strong agreement between the two LC-HRMS assays using different immunocapture methods in the ADA-negative samples (
Fig. 2A). For the eight ADA-positive samples, the adalimumab concentrations measured using protein-A enrichment were approximately three times higher than those obtained with TNF-α enrichment (median: 3.03 μg/mL vs. 0.95 μg/mL,
P<0.001,
Fig. 2B). The difference in concentrations (protein-A/TNF-α ratio) increased with increasing ADA levels (expressed as signal-to-negative ratio) (
Fig. 2C). TNF-α immunocapture-LC-HRMS and in-house ELISA results were consistent, regardless of ADA generation, but exhibited proportional bias (
Fig. 2D).
Protein-A immunocapture-LC-HRMS is applicable to a wide range of IgG-based biologicals [
9]. Notably, concentrations in ADA-positive samples may be overestimated when using IgG enrichment. Special attention should be paid to interference by ADA when determining expected active/total concentrations during method development. We observed that spiked ADA interfere with total drug enrichment by forming drug–ADA complexes, and this interference can be addressed by implementing acid pretreatment before immunocapture [
6]. A notable dissociation of drug–ADA complexes was observed when quantifying the active drug concentration using the target-enrichment strategy, even with the typically used 1-hr incubation, resulting in the overestimation of active drug concentrations. Optimized rapid extraction (10 mins) is an appropriate means to capture adalimumab with free binding sites [
5]. In conclusion, the target-enrichment LC-HRMS assay for adalimumab measurement, quantitatively interchangeable with ELISA, can provide comparable and interpretable results in clinical applications.


 PDF
PDF Citation
 Print
Print


 XML Download