INTRODUCTION
MATERIALS AND METHODS
Table 1
| Measurement | Male (n = 40) | Female (n = 40) | |||||
|---|---|---|---|---|---|---|---|
|
Class I (n = 20) |
Class II (n = 20) |
P value |
Class I (n = 20) |
Class II (n = 20) |
P value | ||
| Age (yr) | 22.37 ± 2.51 | 22.98 ± 5.31 | 0.648 | 22.69 ± 3.34 | 22.93 ± 4.07 | 0.835 | |
| SNA (°) | 81.60 ± 2.74 | 83.02 ± 2.69 | 0.472 | 82.18 ± 2.47 | 82.34 ± 2.61 | 0.893 | |
| SNB (°) | 79.15 ± 2.63 | 75.76 ± 2.56 | < 0.001*** | 79.56 ± 2.76 | 74.88 ± 2.30 | < 0.001*** | |
| ANB (°) | 2.58 ± 0.93 | 7.30 ± 1.24 | < 0.001*** | 2.61 ± 1.18 | 7.49 ± 1.00 | < 0.001*** | |
| MP-SN (°) | 32.01 ± 2.42 | 33.12 ± 2.80 | 0.542 | 32.47 ± 3.55 | 32.42 ± 2.69 | 0.985 | |
| Overjet (mm) | 3.59 ± 1.16 | 6.30 ± 1.61 | < 0.001*** | 3.90 ± 1.05 | 6.25 ± 1.63 | < 0.001*** | |
Cone-beam computed tomography
Head reorientation
Basal bone measurements
Figure 3

Root position measurements
Root inclination measurements
Figure 4
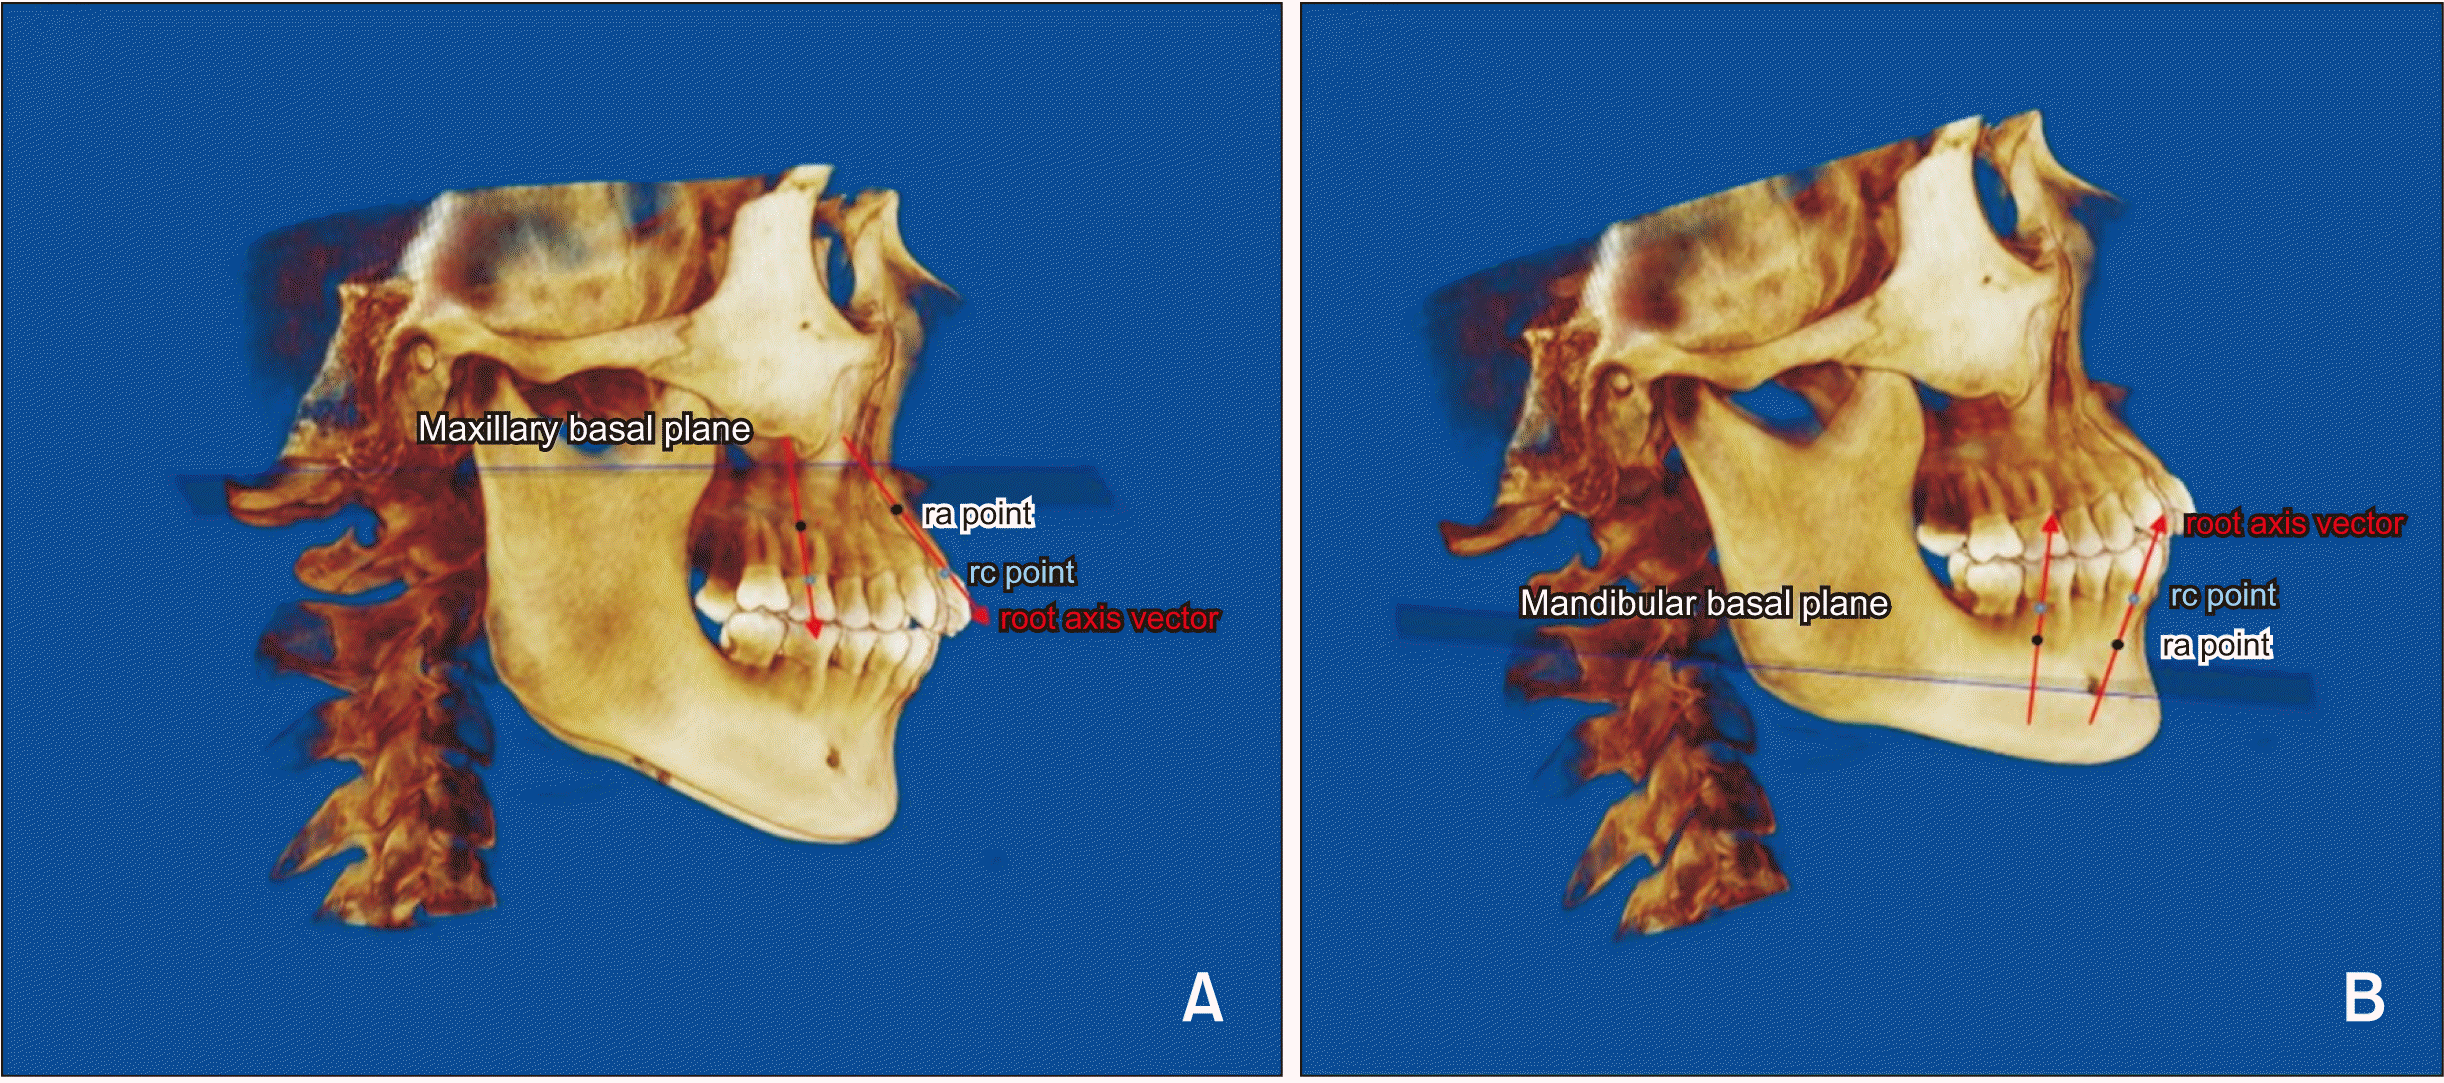
Table 2
Statistical analysis
RESULTS
Basal bone measurements
Table 3
| Position | Measurement | Class I (n = 40) | Class II (n = 40) | ||||||
|---|---|---|---|---|---|---|---|---|---|
|
Male (n = 20) |
Female (n = 20) |
P value |
Male (n = 20) |
Female (n = 20) |
P value | ||||
| Maxilla | Basal area (mm2) | 1,577.51 ± 185.79 | 1,461.74 ± 372.02 | 0.221 | 1,523.53 ± 158.78 | 1,404.43 ± 125.77 | 0.012* | ||
|
Midline length (mm) |
109.36 ± 6.38 | 103.74 ± 6.13 | 0.007** | 111.52 ± 7.27 | 107.89 ± 4.78 | 0.070 | |||
| Midline width (mm) | 49.38 ± 3.11 | 47.90 ± 3.20 | 0.147 | 48.64 ± 2.26 | 48.94 ± 2.66 | 0.703 | |||
| Midline depth (mm) | 40.43 ± 3.37 | 38.16 ± 2.50 | 0.020* | 41.91 ± 3.25 | 40.02 ± 2.50 | 0.046* | |||
| Mandible | Basal area (mm2) | 1,797.58 ± 220.16 | 1,626.14 ± 174.79 | 0.010* | 1,689.36 ± 201.40 | 1,549.40 ± 157.03 | 0.019* | ||
|
Midline length (mm) |
130.79 ± 6.53 | 123.58 ± 8.10 | 0.004** | 123.94 ± 7.35 | 117.74 ± 7.63 | 0.013* | |||
| Midline width (mm) | 83.11 ± 5.30 | 76.94 ± 3.82 | < 0.001*** | 79.83 ± 4.92 | 76.33 ± 3.75 | 0.016* | |||
| Midline depth (mm) | 47.39 ± 2.43 | 45.28 ± 3.78 | 0.042* | 44.15 ± 3.06 | 41.55 ± 3.69 | 0.020* | |||
Table 4
| Position | Measurement | Male | Female | ||||||
|---|---|---|---|---|---|---|---|---|---|
|
Class I (n = 20) |
Class II (n = 20) |
P value |
Class I (n = 20) |
Class II (n = 20) |
P value | ||||
| Maxilla | Basal area (mm2) | 1,577.51 ± 185.79 | 1,523.53 ± 158.78 | 0.330 | 1,461.74 ± 372.02 | 1,404.43 ± 125.77 | 0.518 | ||
| Midline length (mm) | 109.36 ± 6.38 | 111.52 ± 7.27 | 0.325 | 103.74 ± 6.13 | 107.89 ± 4.78 | 0.022* | |||
| Midline width (mm) | 49.38 ± 3.11 | 48.64 ± 2.26 | 0.395 | 47.90 ± 3.20 | 48.94 ± 2.66 | 0.271 | |||
| Midline depth (mm) | 40.43 ± 3.37 | 41.91 ± 3.25 | 0.167 | 38.16 ± 2.50 | 40.02 ± 2.50 | 0.024* | |||
| Mandible | Basal area (mm2) | 1,797.58 ± 220.16 | 1,689.36 ± 201.40 | 0.113 | 1,626.14 ± 174.79 | 1,549.40 ± 157.03 | 0.152 | ||
| Midline length (mm) | 130.79 ± 6.53 | 123.94 ± 7.35 | 0.004** | 123.58 ± 8.10 | 117.74 ± 7.63 | 0.024* | |||
| Midline width (mm) | 83.11 ± 5.30 | 79.83 ± 4.92 | 0.050 | 76.94 ± 3.82 | 76.33 ± 3.75 | 0.617 | |||
| Midline depth (mm) | 47.39 ± 2.43 | 44.15 ± 3.06 | 0.001** | 45.28 ± 3.78 | 41.55 ± 3.69 | 0.003** | |||
Root inclination measurements
Figure 5
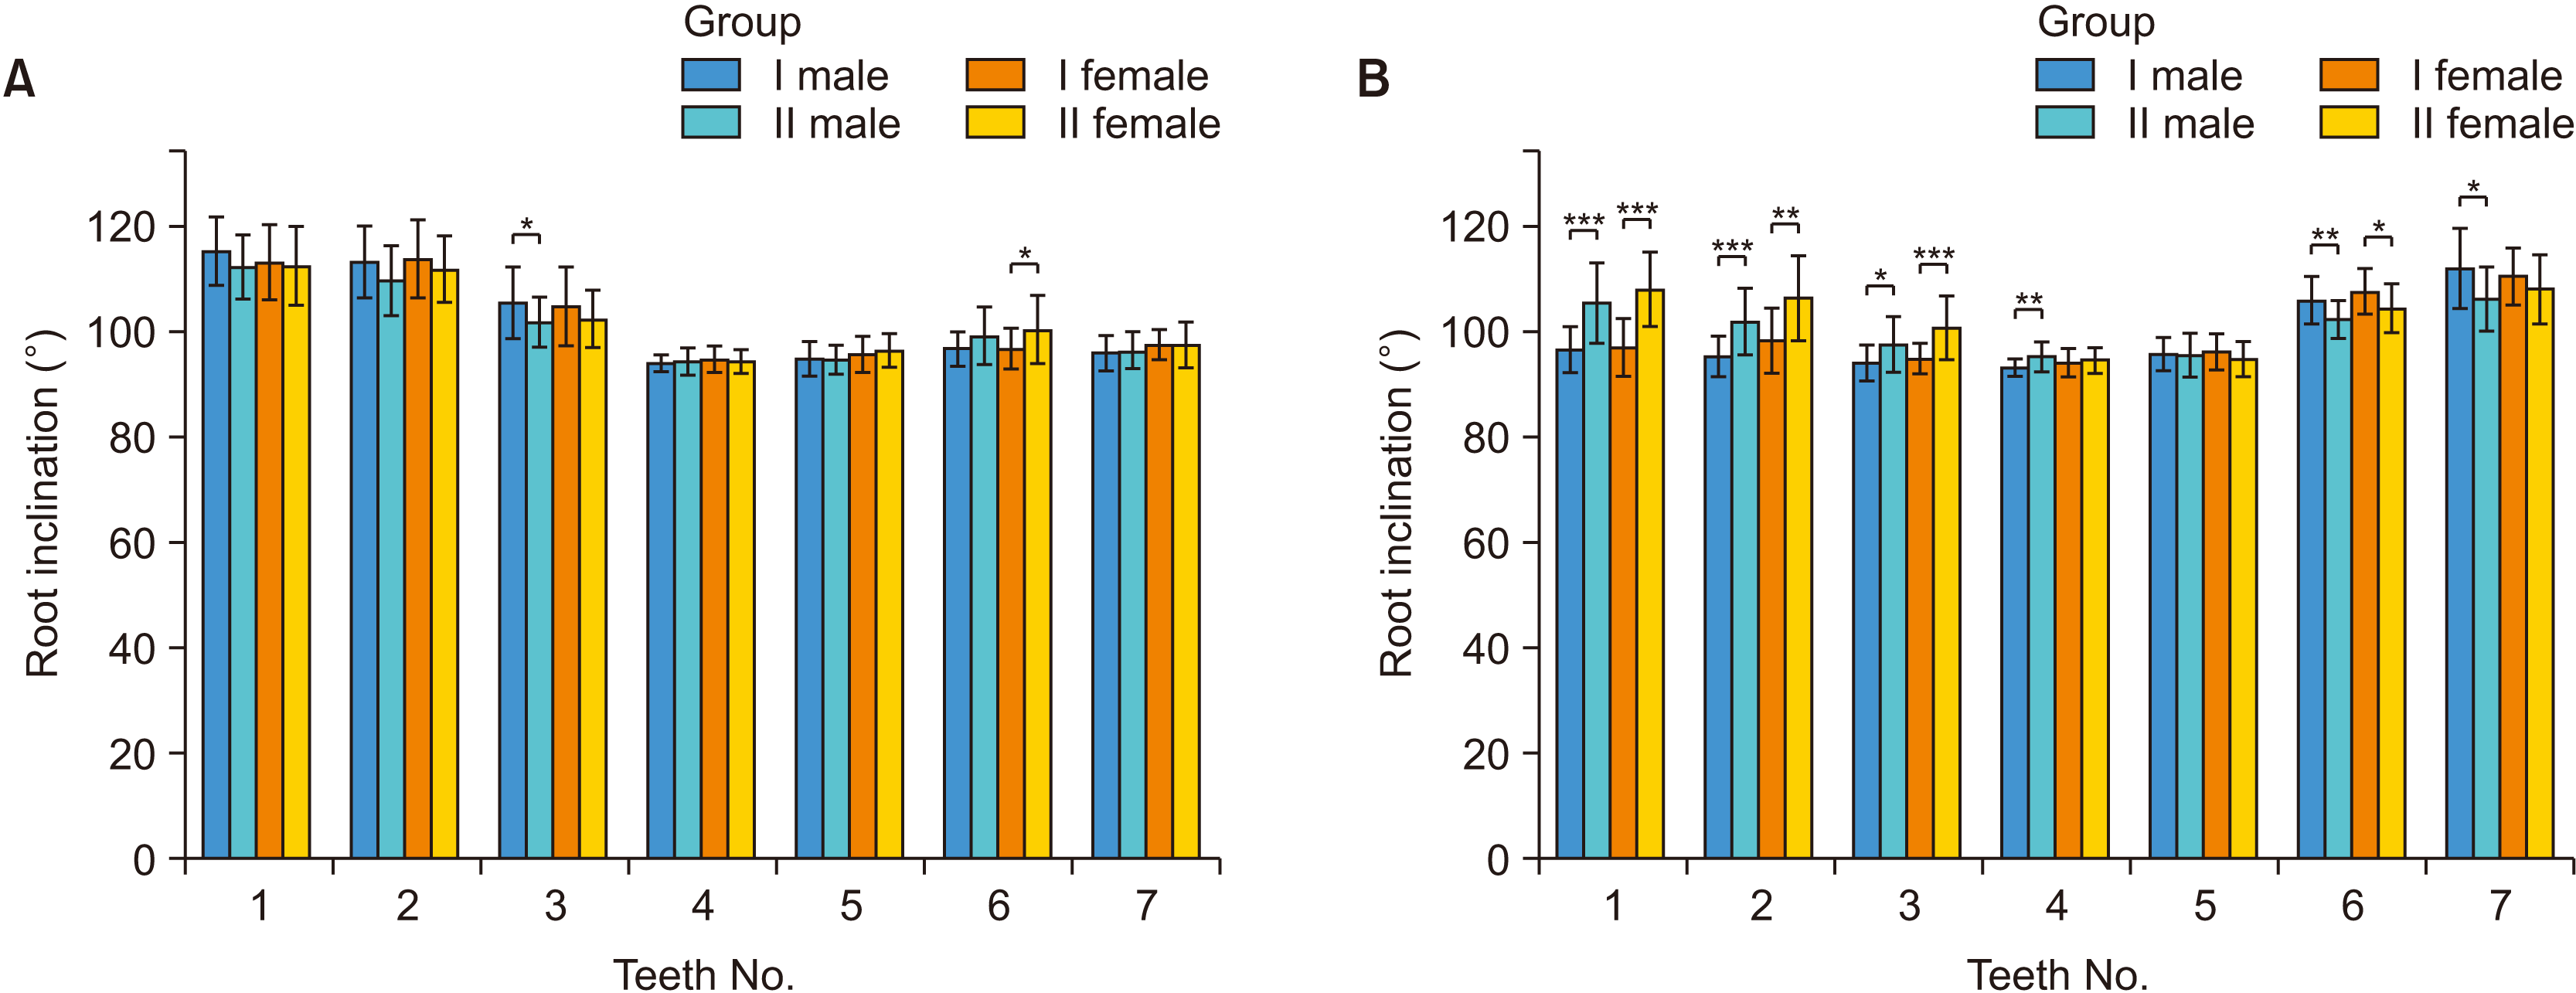
Table 5
| Position | Region | Teeth No. | Male | Female | ||||||
|---|---|---|---|---|---|---|---|---|---|---|
|
Class I (n = 20) |
Class II (n = 20) |
P value |
Class I (n = 20) |
Class II (n = 20) |
P value | |||||
| Mean ± SD | Mean ± SD | Mean ± SD | Mean ± SD | |||||||
| Maxilla | Anterior region (°) | 1 | 115.30 ± 6.47 | 112.29 ± 6.09 | 0.137 | 113.14 ± 7.18 | 112.50 ± 7.43 | 0.781 | ||
| 2 | 113.28 ± 6.78 | 109.67 ± 6.57 | 0.095 | 113.86 ± 7.44 | 111.84 ± 6.39 | 0.363 | ||||
| 3 | 105.48 ± 6.81 | 101.68 ± 4.89 | 0.050 | 104.78 ± 7.54 | 102.40 ± 5.45 | 0.260 | ||||
| Premolar region (°) | 4 | 85.92 ± 1.63 | 85.74 ± 2.40 | 0.780 | 85.34 ± 2.49 | 85.66 ± 2.25 | 0.670 | |||
| 5 | 85.02 ± 3.11 | 85.26 ± 2.70 | 0.798 | 84.33 ± 3.44 | 83.59 ± 3.23 | 0.488 | ||||
| Molar region (°) | 6 | 83.15 ± 3.25 | 80.72 ± 5.46 | 0.096 | 83.35 ± 3.91 | 79.70 ± 6.46 | 0.037* | |||
| 7 | 84.11 ± 3.27 | 83.69 ± 3.41 | 0.699 | 82.49 ± 2.81 | 82.54 ± 4.31 | 0.969 | ||||
| Mandible | Anterior region (°) | 1 | 97.19 ± 4.41 | 106.06 ± 7.68 | < 0.001*** | 97.51 ± 5.49 | 108.62 ± 7.14 | < 0.001*** | ||
| 2 | 95.85 ± 3.88 | 102.47 ± 6.39 | < 0.001*** | 98.85 ± 6.23 | 106.97 ± 8.13 | 0.001** | ||||
| 3 | 94.61 ± 3.37 | 98.10 ± 5.25 | 0.017* | 95.42 ± 3.03 | 101.25 ± 6.14 | < 0.001*** | ||||
| Premolar region (°) | 4 | 86.34 ± 1.72 | 84.16 ± 2.88 | 0.006** | 85.36 ± 2.68 | 84.92 ± 2.42 | 0.585 | |||
| 5 | 83.70 ± 3.21 | 83.93 ± 4.18 | 0.849 | 83.25 ± 3.49 | 84.62 ± 3.36 | 0.217 | ||||
| Molar region (°) | 6 | 73.43 ± 4.56 | 77.02 ± 3.61 | 0.009** | 71.69 ± 4.41 | 74.93 ± 4.67 | 0.030* | |||
| 7 | 67.39 ± 7.62 | 73.21 ± 6.22 | 0.012* | 68.79 ± 5.54 | 71.33 ± 6.71 | 0.199 | ||||
Figure 6
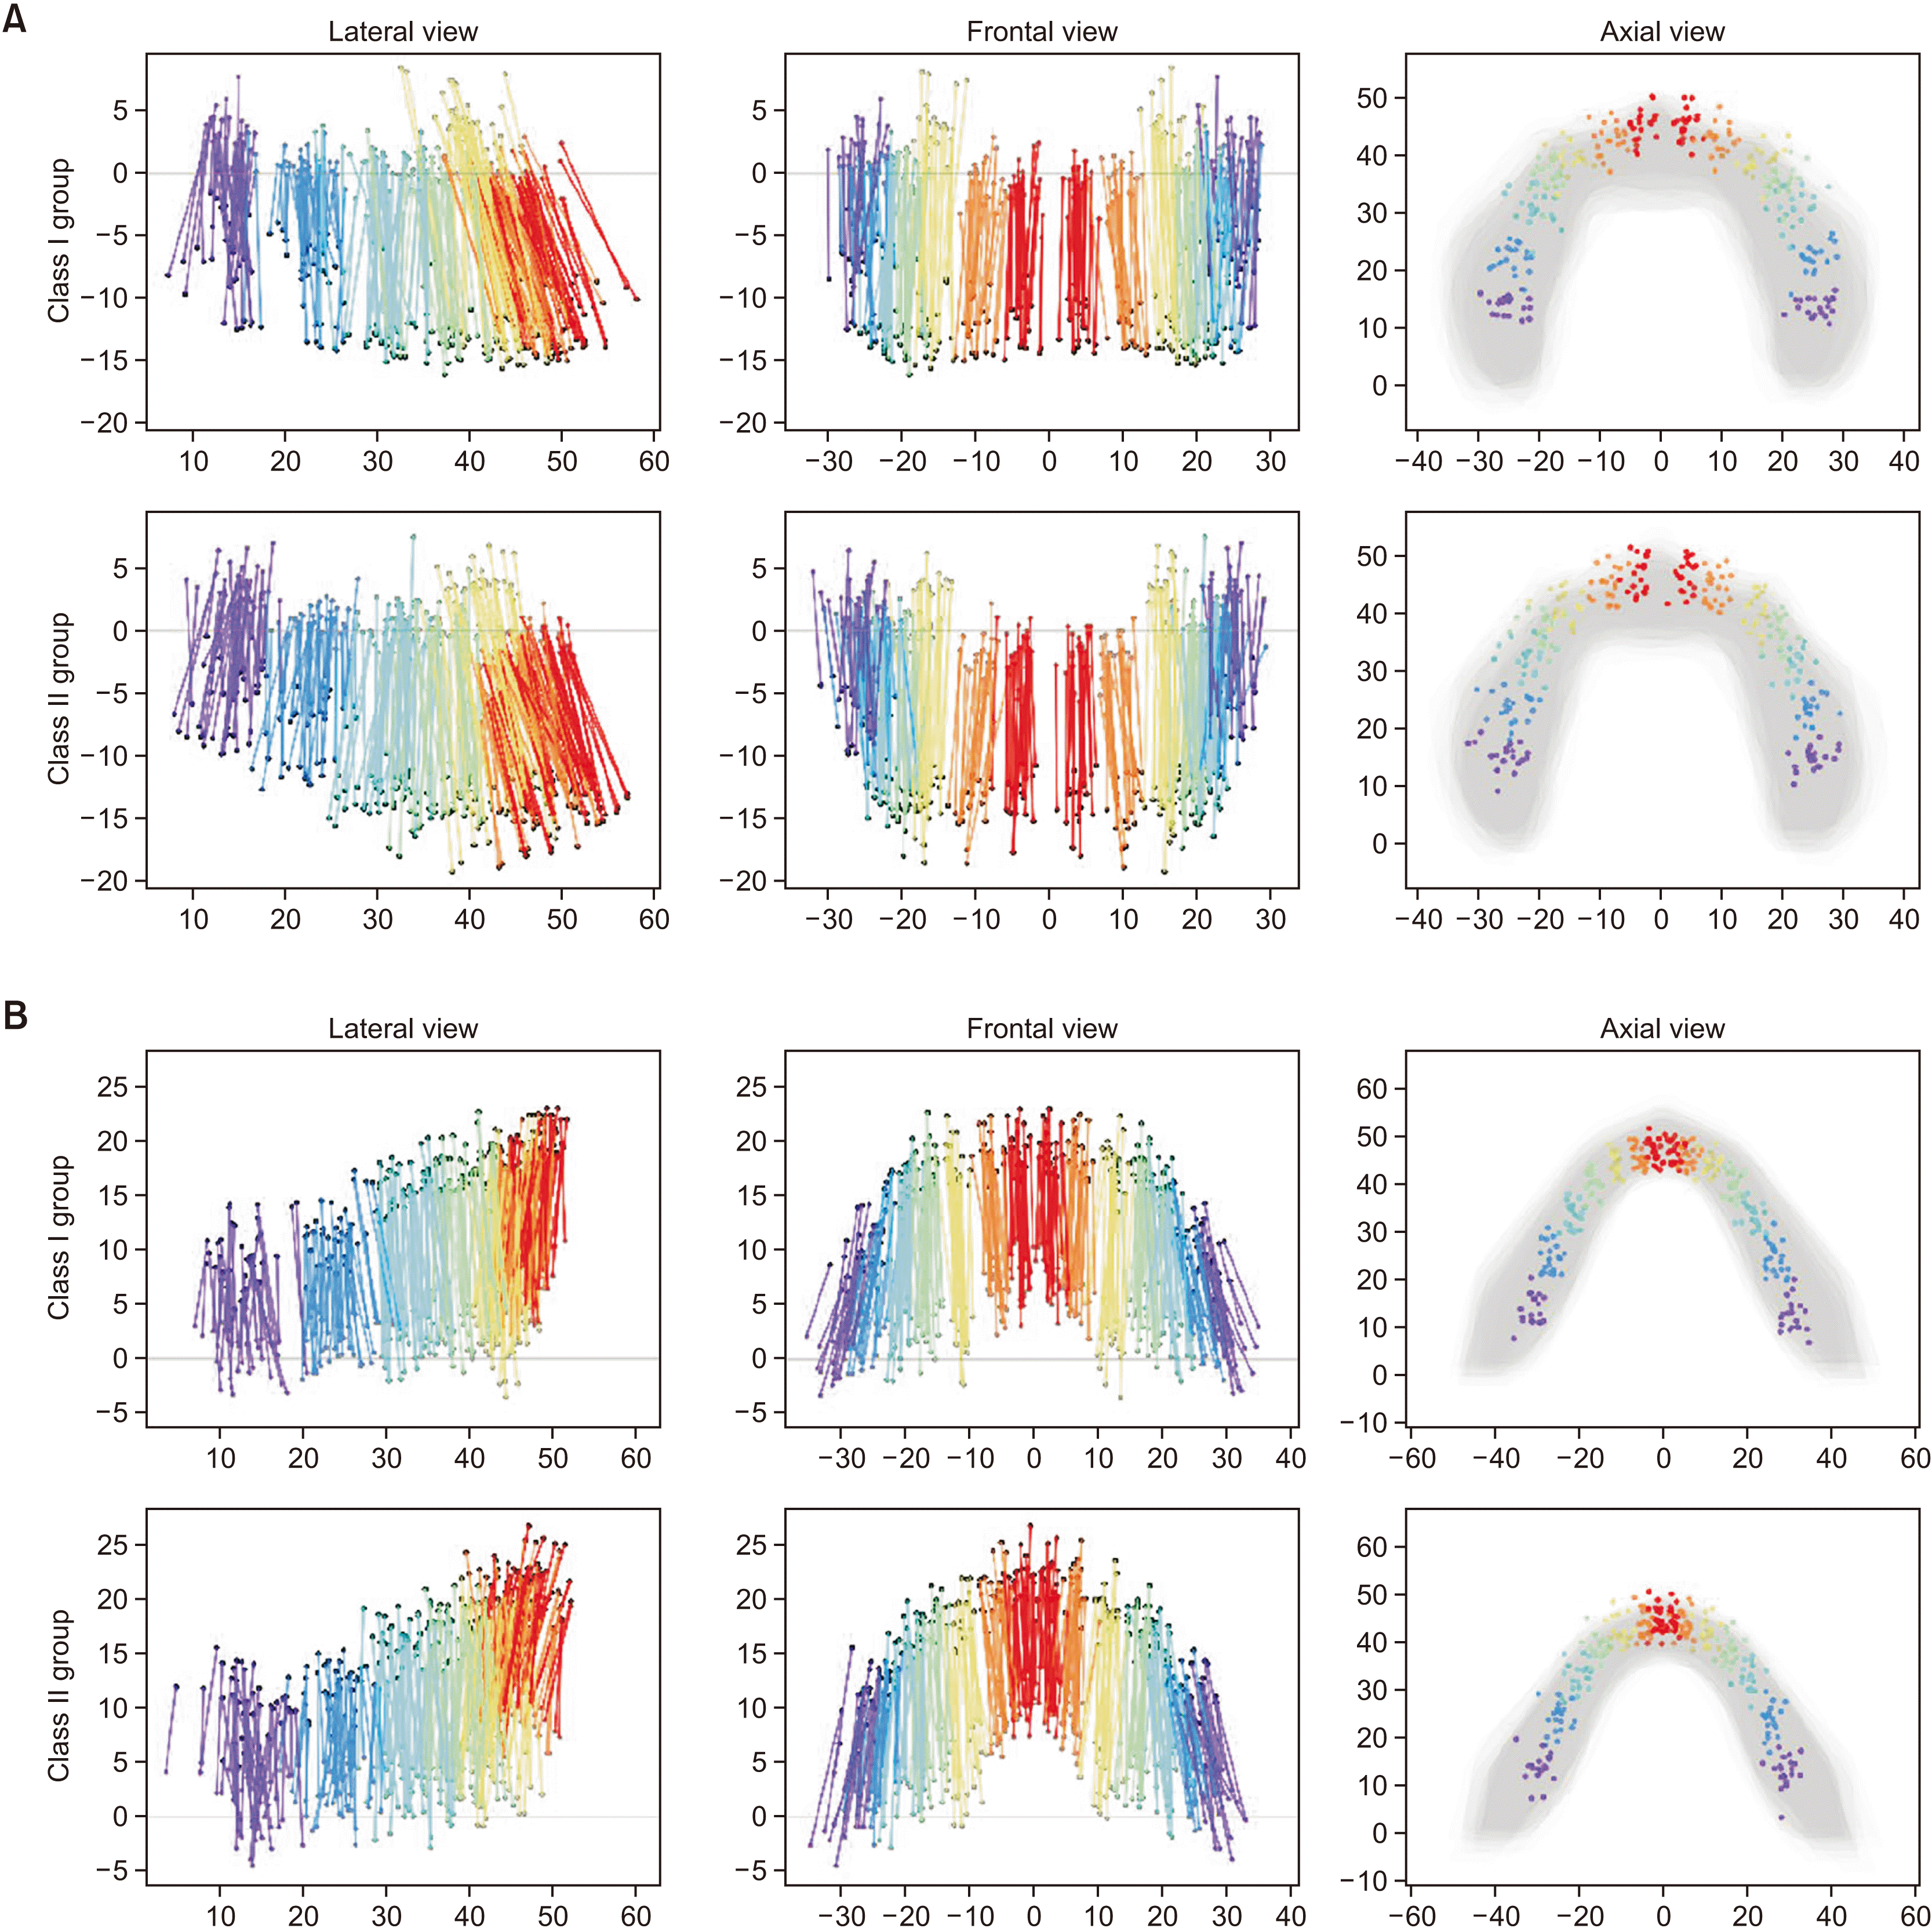
Figure 7
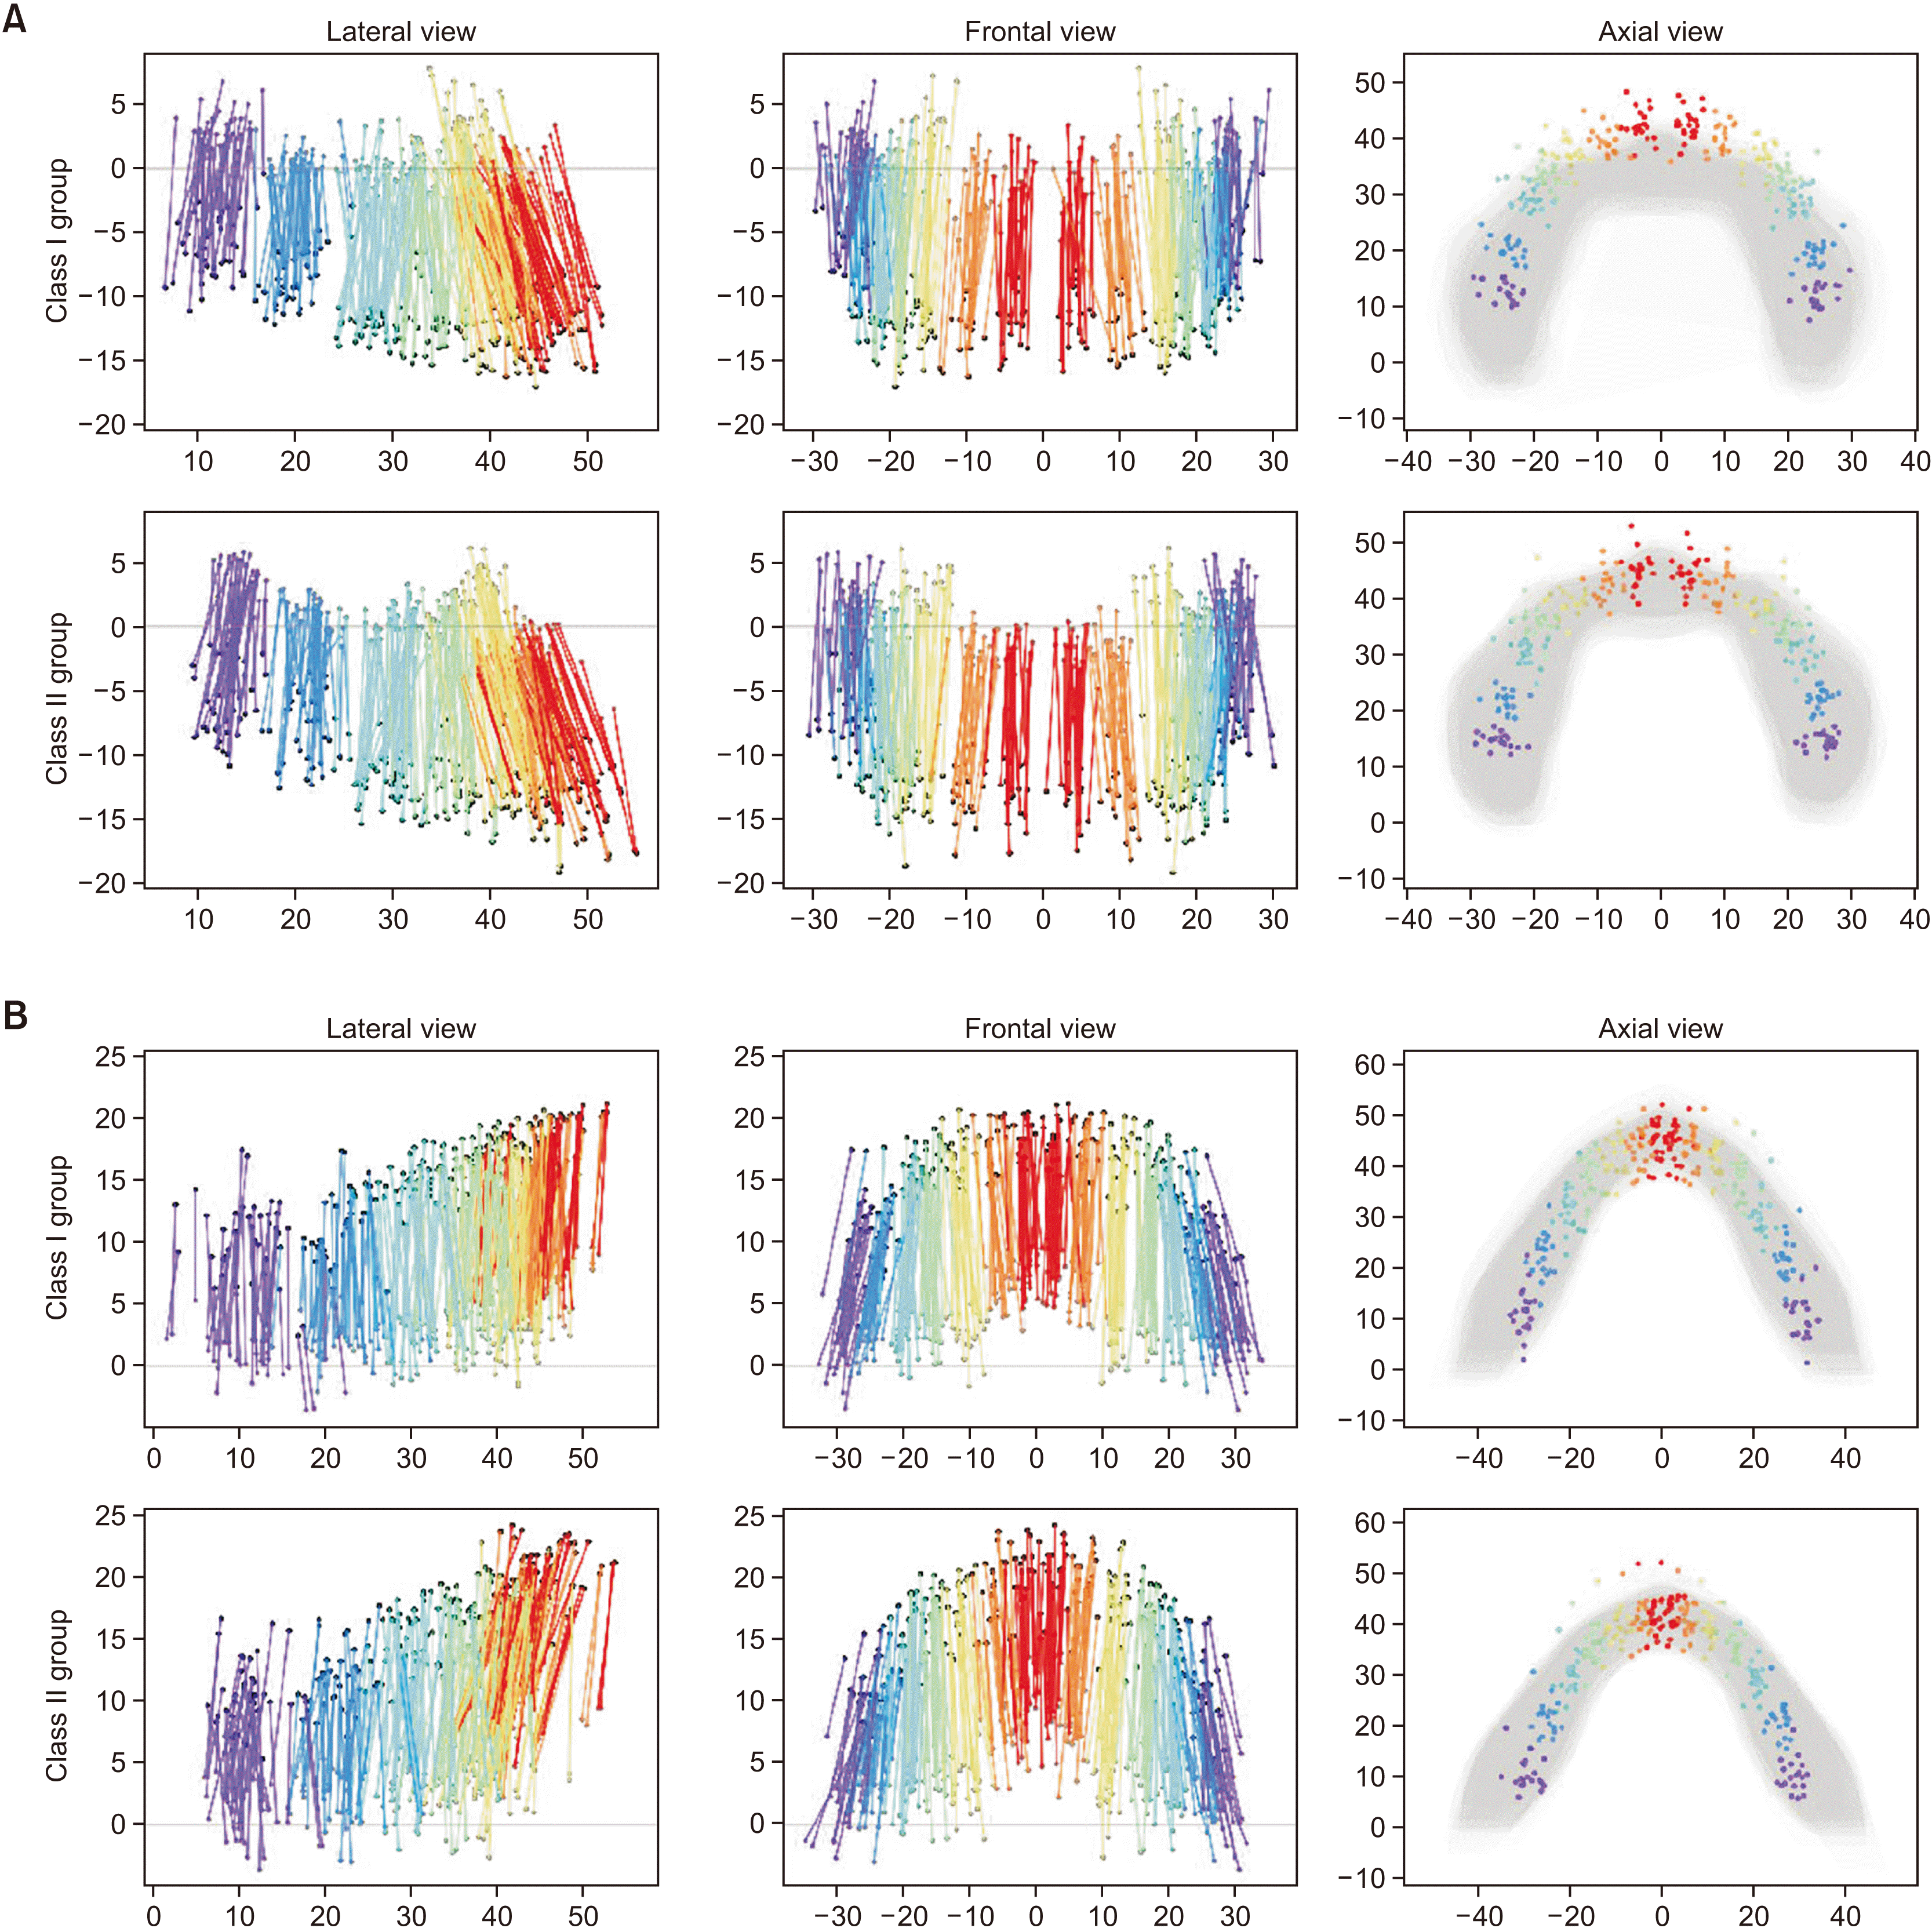
Root position measurements
Figure 8
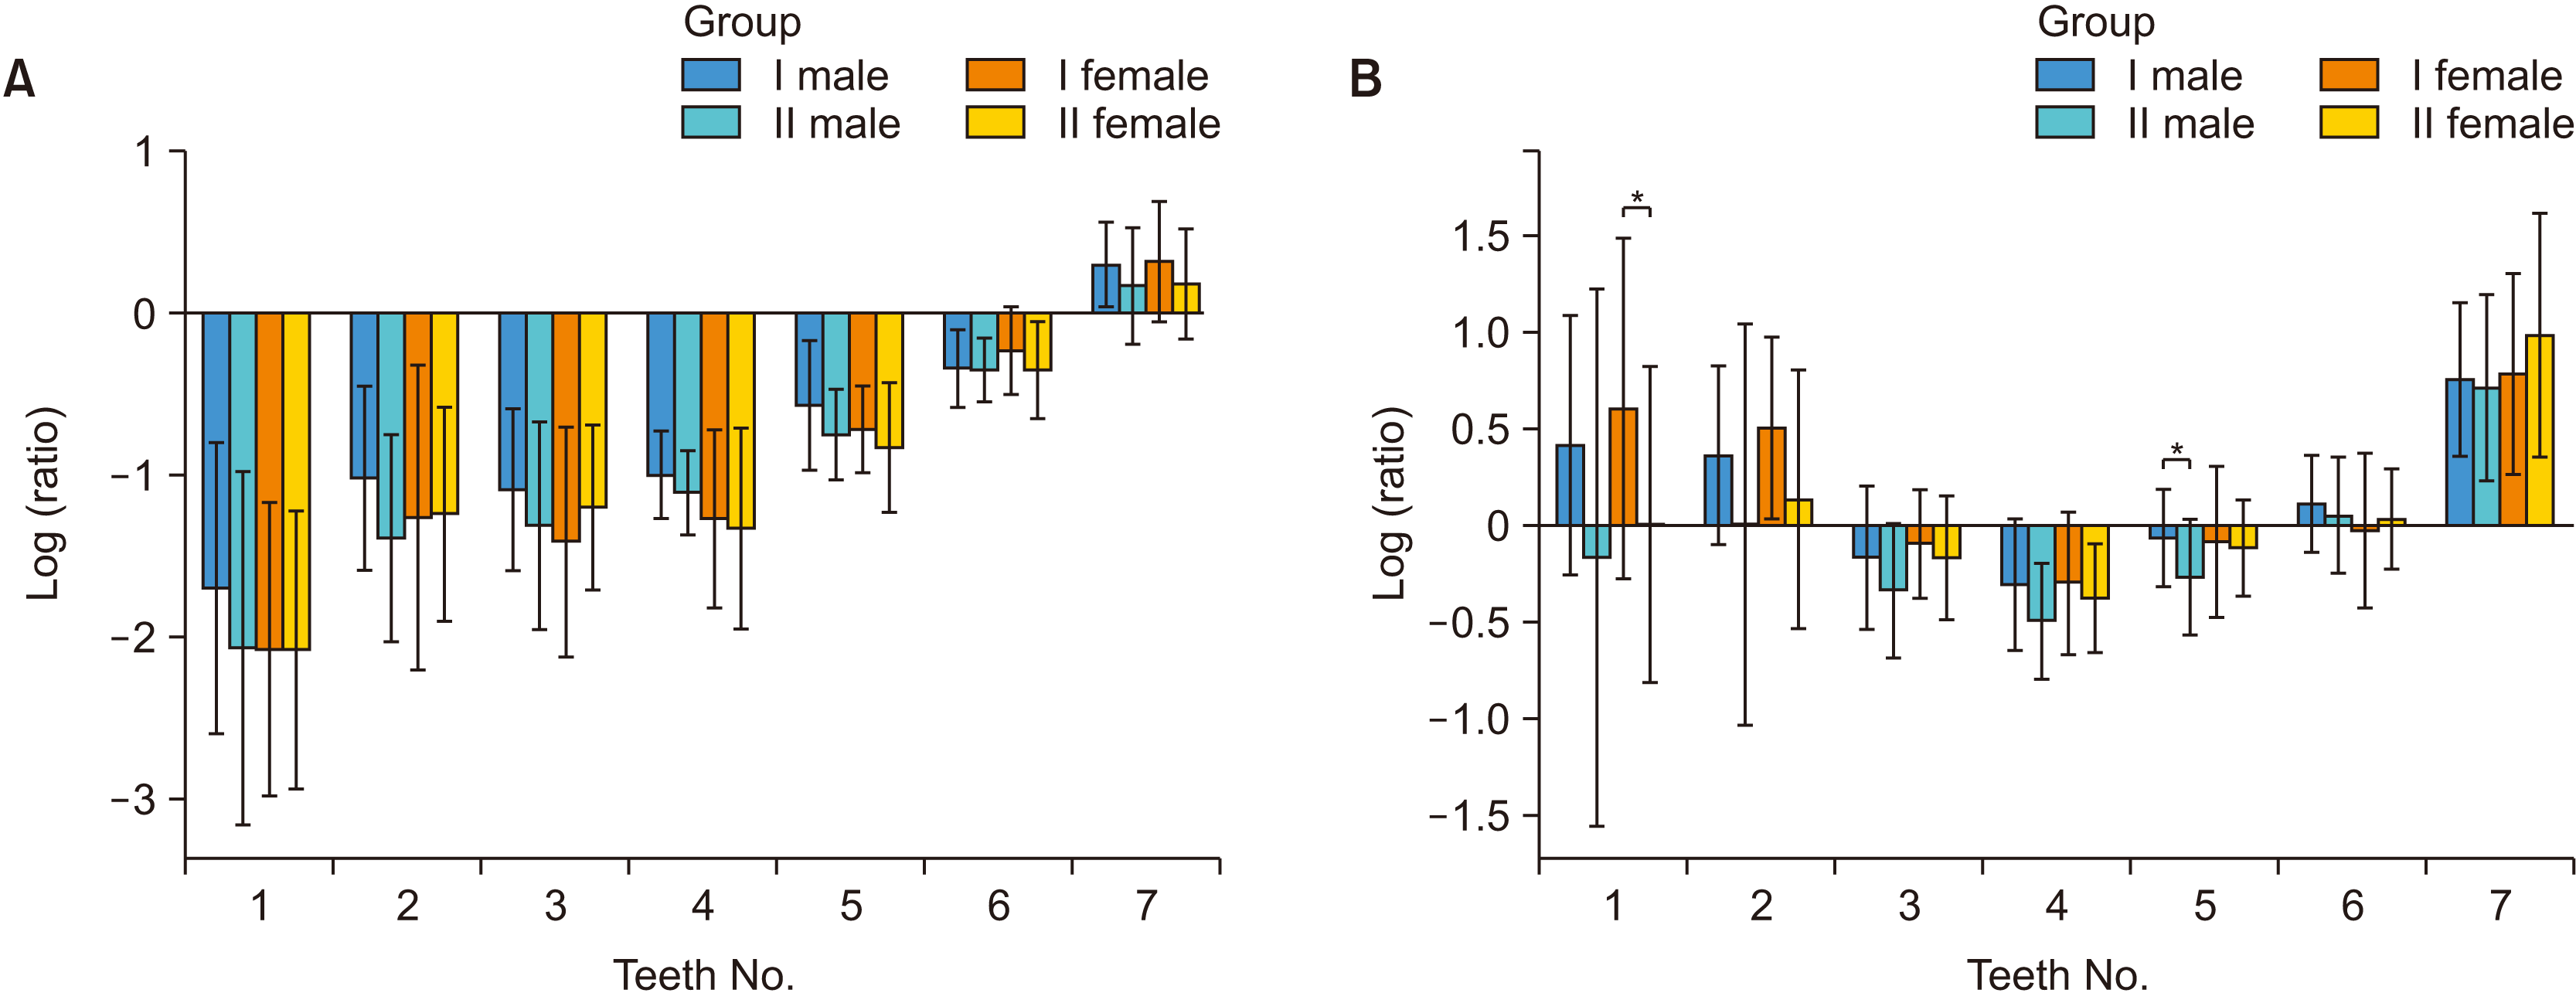
Table 6
| Position | Region |
Teeth No. |
Male | Female | ||||||||
|---|---|---|---|---|---|---|---|---|---|---|---|---|
|
Class I (n = 20) |
Class II (n = 20) |
P value |
Class I (n = 20) |
Class II (n = 20) |
P value | |||||||
| Mean ± SD | Mean ± SD | Mean ± SD | Mean ± SD | |||||||||
| Maxilla | Anterior region (°) | 1 | –1.70 ± 0.90 | –2.07 ± 1.09 | 0.246 | –2.08 ± 0.91 | –2.08 ± 0.86 | 0.986 | ||||
| 2 | –1.02 ± 0.57 | –1.39 ± 0.64 | 0.062 | –1.26 ± 0.94 | –1.24 ± 0.66 | 0.954 | ||||||
| 3 | –1.09 ± 0.50 | –1.31 ± 0.64 | 0.218 | –1.41 ± 0.71 | –1.20 ± 0.51 | 0.284 | ||||||
| Premolar region (°) | 4 | –1.00 ± 0.27 | –1.11 ± 0.26 | 0.200 | –1.27 ± 0.55 | –1.33 ± 0.62 | 0.754 | |||||
| 5 | –0.57 ± 0.40 | –0.75 ± 0.28 | 0.118 | –0.72 ± 0.27 | –0.83 ± 0.40 | 0.320 | ||||||
| Molar region (°) | 6 | –0.34 ± 0.24 | –0.35 ± 0.20 | 0.886 | –0.23 ± 0.27 | –0.35 ± 0.30 | 0.183 | |||||
| 7 | 0.30 ± 0.26 | 0.17 ± 0.36 | 0.198 | 0.32 ± 0.37 | 0.18 ± 0.34 | 0.240 | ||||||
| Mandible | Anterior region (°) | 1 | 0.41 ± 0.67 | –0.17 ± 1.39 | 0.103 | 0.60 ± 0.88 | 0.00 ± 0.82 | 0.032* | ||||
| 2 | 0.36 ± 0.46 | –0.00 ± 1.04 | 0.163 | 0.50 ± 0.47 | 0.13 ± 0.67 | 0.052 | ||||||
| 3 | –0.17 ± 0.37 | –0.34 ± 0.35 | 0.152 | –0.10 ± 0.28 | –0.17 ± 0.32 | 0.414 | ||||||
| Premolar region (°) | 4 | –0.31 ± 0.34 | –0.50 ± 0.30 | 0.079 | –0.30 ± 0.37 | –0.38 ± 0.28 | 0.470 | |||||
| 5 | –0.07 ± 0.25 | –0.27 ± 0.30 | 0.027* | –0.09 ± 0.39 | –0.12 ± 0.25 | 0.780 | ||||||
| Molar region (°) | 6 | 0.11 ± 0.25 | 0.05 ± 0.30 | 0.549 | –0.03 ± 0.40 | 0.03 ± 0.26 | 0.616 | |||||
| 7 | 0.75 ± 0.40 | 0.71 ± 0.48 | 0.771 | 0.78 ± 0.52 | 0.98 ± 0.63 | 0.286 | ||||||
If the Log Ratio value was positive, the root apex was closer to the inner boundary of the basal bone. If the Log Ratio value was negative, the root apex was closer to the external boundary of the basal bone.
Table 7
| Position | Region | Teeth No. | Class I | Class II | ||||
|---|---|---|---|---|---|---|---|---|
|
Male (n = 20) |
Female (n = 20) |
Male (n = 20) |
Female (n = 20) |
|||||
| r | r | r | r | |||||
| Maxilla | Anterior region (°) | 1 | 0.581** | 0.338 | 0.245 | 0.254 | ||
| 2 | 0.706*** | 0.310 | 0.628** | 0.233 | ||||
| 3 | 0.807*** | 0.471* | 0.707*** | 0.569** | ||||
| Premolar region (°) | 4 | 0.329 | –0.017 | –0.014 | –0.275 | |||
| 5 | 0.444* | 0.508 | –0.199 | 0.116 | ||||
| Molar region (°) | 6 | –0.045 | –0.541* | –0.183 | –0.013 | |||
| 7 | 0.422 | 0.364 | –0.242 | 0.371 | ||||
| Mandible | Anterior region (°) | 1 | –0.122 | –0.090 | –0.352 | –0.070 | ||
| 2 | –0.337 | 0.218 | –0.368 | –0.062 | ||||
| 3 | 0.132 | 0.135 | –0.615** | 0.120 | ||||
| Premolar region (°) | 4 | 0.057 | 0.541* | –0.220 | 0.463* | |||
| 5 | –0.210 | –0.452* | –0.062 | –0.210 | ||||
| Molar region (°) | 6 | –0.107 | –0.280 | –0.073 | –0.522* | |||
| 7 | 0.033 | –0.069 | –0.293 | –0.436 | ||||


 PDF
PDF Citation
 Print
Print



 XML Download