Journal List > Ann Surg Treat Res > v.106(5) > 1516087227

Jin, Park, Nam, Lim, Kim, Noh, Yoo, Park, and Yun: CTLA4 expression profiles and their association with clinical outcomes of breast cancer: a systemic review

Abstract

Purpose

The cytotoxic T-lymphocyte-associated protein 4 (CTLA4) is involved in the progression of various cancers, but its biological roles in breast cancer (BRCA) remain unclear. Therefore, we performed a systematic multiomic analysis to expound on the prognostic value and underlying mechanism of CTLA4 in BRCA.

Methods

We assessed the effect of CTLA4 expression on BRCA using a variety of bioinformatics platforms, including Oncomine, GEPIA, UALCAN, PrognoScan database, Kaplan-Meier plotter, and R2: Kaplan-Meier scanner.

Results

CTLA4 was highly expressed in BRCA tumor tissue compared to normal tissue (P < 0.01). The CTLA4 messenger RNA levels in BRCA based on BRCA subtypes of Luminal, human epidermal growth factor receptor 2, and triple-negative BRCA were considerably higher than in normal tissues (P < 0.001). However, the overexpression of CTLA4 was associated with a better prognosis in BRCA (P < 0.001) and was correlated with clinicopathological characteristics including age, T stage, estrogen receptors, progesterone receptors, and prediction analysis of microarray 50 (P < 0.01). The infiltration of multiple immune cells was associated with increased CTLA4 expression in BRCA (P < 0.001). CTLA4 was highly enriched in antigen binding, immunoglobulin complexes, lymphocyte-mediated immunity, and cytokine-cytokine receptor interaction.

Conclusion

This study provides suggestive evidence of the prognostic role of CTLA4 in BRCA, which may be a therapeutic target for BRCA. Furthermore, CTLA4 may influence BRCA prognosis through antigen binding, immunoglobulin complexes, lymphocyte-mediated immunity, and cytokine-cytokine receptor interaction. These findings help us understand how CTLA4 plays a role in BRCA and set the stage for more research.

INTRODUCTION

As of 2020, there were 2.3 million women diagnosed with breast cancer (BRCA) and 685,000 deaths globally, which means it has become a major cancer threat to female health [1]. BRCA can be divided into different types based on whether it has molecular markers for estrogen receptors (ER), progesterone receptors (PR), and human epidermal growth factor 2 (HER2) [2]. BRCA is a highly heterogeneous tumor with a wide range of etiologies and clinical symptoms [3]. BRCA patient prognosis is significantly affected by immunity [4].
Cancer immunotherapy is a new and interesting area of cancer treatment, with the primary objective of using one’s own immune system to identify and eliminate tumor cells [5]. The immune system is remarkably equipped to recognize cancer neoantigens as foreign and can develop antitumor responses with the potential to eliminate the tumor [6]. Immune checkpoints are an essential component of the immune system [7], which also are cell surface receptors that are expressed on immunological cells [8]. Immunotherapy is based on the use of immune checkpoint inhibitors to prevent the interaction of immunological checkpoints and activate the immune response against tumor cells [9]. In recent years, immune checkpoint inhibitors have become the treatment option for many recurrent or spreading cancers, especially the targeted cytotoxic T-lymphocyte-associated protein 4 (CTLA4) checkpoint blocking therapy, which has achieved remarkable efficacy in the treatment of different cancers [101112].
CTLA4 is a protein receptor that is a member of the immunoglobulin superfamily that is expressed by activated T cells and transmits an inhibitory signal to T cells [13]. CTLA4 is an important co-inhibitory molecule that suppresses the functions of T cells and transmits an inhibitory signal to T cells [1415]. CTLA4 is a target for monoclonal antibody-based drugs that enhance anticancer immunity, such as ipilimumab, which was the first CTLA4 inhibitor to be developed and the only one to date that has been approved by the U.S. Food and Drug Administration [16]. CTLA4 expression is associated with the development of BRCA [17].
As an immunological checkpoint, CTLA4 can inhibit the immune system from tolerating tumors, offering a potentially beneficial new approach to the treatment of cancer. Herein, we analyzed the expression pattern, function, and prognostic value of CTLA4 in BRCA using various online databases and annotation tools, and thoroughly evaluated the importance of CTLA4 expression in BRCA. The findings will aid in the understanding of CTLA4’s prognostic value in human BRCA.

METHODS

Ethics approval and consent to participate

This article does not contain any studies with human participants or animals performed by any of the authors.

Patient data collection

The Cancer Genome Atlas (TCGA) database (https://portal.gdc.cancer.gov) is the largest and most commonly used public resource, providing somatic mutation, gene expression, gene methylation, and copy number variation data sets, amongst others, for several thousands of tumor samples and it is a government-funded project with the goal of classifying and discovering the major genomic alterations that cause cancer to create a comprehensive cancer genome atlas “atlas” that includes over 20,000 molecular characterizations of primary cancers and matched normal samples for 33 cancer types [18]. It was used to download all the raw expression of CTLA4 data in BRCA in this study, including transcriptome RNA-seq data and clinical data.

Oncomine platform transcript expression analysis

The Oncomine database (https://www.oncomine.org/resource/login.html) is a web-based data mining platform with 264 datasets aimed at collecting, standardizing, evaluating, and distributing transcriptomic cancer data for scientific research [19]. The Oncomine database was used to assess CTLA4 expression levels in BRCA. The fold change in CTLA4 expression in clinical cancer specimens relative to normal controls was calculated using the P-value of 1e-4, fold-change 2, and gene ranking in the top 10%.

GEPIA

The GEPIA (Gene Expression Profiling Interactive Analysis; http://gepia.cancer-pku.cn) is a web server for analyzing the RNA sequencing expression data of 9,736 tumors and 8,587 normal samples from the TCGA and the GTEx (Genotype-Tissue Expression) projects, using a standard processing pipeline [20]. In this study, the GEPIA-provided box plots tool, which has a P-value of 0.01 and a log2 fold-change cutoff of 1, was used to perform CTLA4 in the BRCA tumor tissue and normal tissue differential expression analysis.

Expression of CTLA4 in breast cancer based on breast cancer subtypes by UALCAN web

The analysis was performed on the online tool of UALCAN (Utility for Alleviating Laboratory, and Computational Analysis; http://ualcan.path.uab.edu) based on BRCA subtypes. UALCAN is a user-friendly, interactive web portal for analyzing TCGA gene expression data in depth, which includes 1,211 patients enrolled in this data profile, including 114 normal and 1,097 tumors in patients with BRCA [21].

Prognosis analysis using PrognoScan

PrognoScan (http://dna00.bio.kyutech.ac.jp/PrognoScan/) is a popular online resource for meta-analysis of genes’ prognostic relevance [22]. The relationship between CTLA4 expression and BRCA patient survival was investigated using PrognoScan in this study.

Kaplan-Meier plotter for survival analysis

The Kaplan-Meier plotter (https://kmplot.com/analysis/) is an online application tool that can assess the impact of over 54,000 genes on the survival of 21 cancer types [23]. In this study, it was utilized to investigate the association between CTLA4 expression and BRCA patient survival.

Survival analysis using R2

R2 (https://hgserver1.amc.nl/cgi-bin/r2/main.cgi) is a web-based genomics analysis and visualization program that can be used for a variety of genomics research and visualization tasks. In this study, it was utilized to investigate the relationship between CTLA4 expression and overall survival (OS) in BRCA patients.

Analysis of immune infiltration and its correlation with CTLA4 expression

By applying the ssGSEA (single-sample Gene Set Enrichment Analysis) method from the GSVA (gene set variation analysis) package in R, we quantified the relative tumor infiltration levels of immune cell types by integrating the expression levels of genes in published signature gene lists to evaluate the association between the infiltration of immune cells and the CTLA4 messenger RNA (mRNA) expression groups in BRCA [242526].

Analysis of differentially expressed genes between the high and low CTLA4 expression groups in patients with breast cancer

Expression profiles (RNA-sequencing transcripts per million) were compared between the high and low CTLA4 mRNA expression groups to identify the differentially expressed genes (DEGs) using the ggplot2 program. The thresholds for the DEGs were set at log2 fold change >1 and P < 0.05, respectively. The clinical data in this section were obtained from the TCGA database.

Gene Ontology and Kyoto Encyclopedia of Genes and Genomes enrichment analysis

Gene Ontology (GO) and Kyoto Encyclopedia of Genes and Genomes (KEGG) enrichment analyses were used to determine the biological significance of DEGs, and GO includes biological processes (BP), cellular components (CC), and molecular functions (MF). In this study, we used the package R “cluster profile” to perform GO and KEGG analyses on DEGs to identify possible biological activities and signaling pathways impacted by CTLA4 [27].

Protein-protein interaction analysis using Cytoscape

Cytoscape software (ver. 3.6.1, http://www.cytoscape.org; Shannon et al. [28]) was used to visualize and analyze the protein-protein interaction (PPI) network. In this study, PPI networks for CTLA4 were constructed by the Cytoscape plug-in STRING protein query (set its parameters as Homo sapiens, with a confidence interval of 1) and Cytoscape plug-in cytoHubba to create a PPI network and perform analysis identify to 5 hub genes in the PPI network [28].

Statistical analysis

The statistical analysis was carried out using R software ver. 3.6.3 (The R Foundation for Statistical Computing). The Wilcoxon rank-sum test or the Kruskal-Wallis test was used to examine differences across groups, as appropriate. Correlations were determined using Pearson or Spearman correlation tests, where applicable. PrognoScan, Kaplan-Meier plotter, and R2 were used to create survival curves. The log-rank test P-values were used to show all the results. And log-rank tests were used to determine the significance of the differences between the survival curves, with a P-value of <0.05 regarded as statistically significant.

RESULTS

CTLA4 expression in breast cancer patients

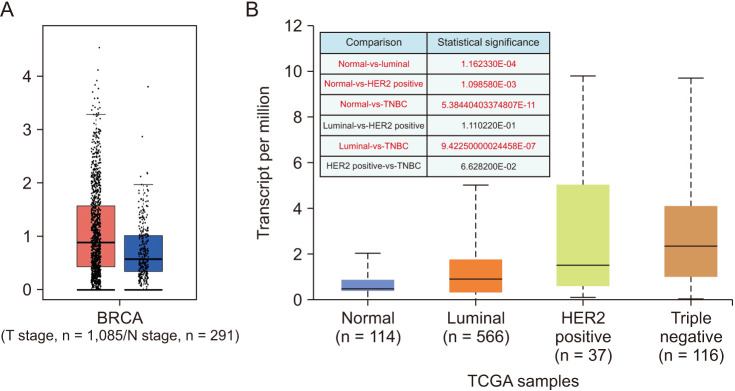
The CTLA4 mRNA levels in pan-cancer tissues and normal tissues were compared using Oncomine and the TCGA database, and we found that CTLA4 was highly expressed in multiple cancer tissues, including in BRCA (P < 0.01) (Fig. 1). The GEPIA database was used for further verification of the above results, which showed that CTLA4 mRNA expression in BRCA tissues was much higher than in normal tissues (P < 0.01) (Fig. 2A). Also, we analyzed the different types of BRCA and compared how CTLA4 was expressed in each type and found that the expression of CTLA4 in subtypes of Luminal, HER2 positive, and triple-negative BRCA (TNBC) was significantly upregulated compared to that of normal breast tissues (P < 0.001) (Fig. 2B).

Prognostic value of CTLA4 mRNA expression in breast cancer patients

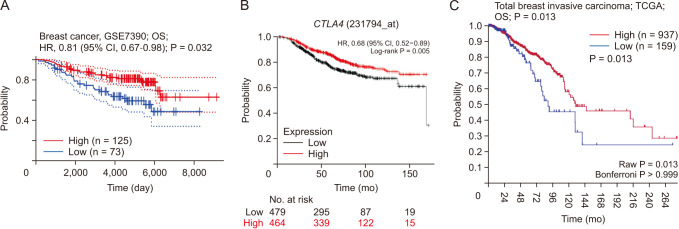
The PrognoScan, Kaplan-Meier plotter, and R2 databases were used to investigate the prognostic value of CTLA4 expression in BRCA to explain how it affects the prognostic characteristics of BRCA patients and the associations between variations in CTLA4 expression and clinical outcomes. As shown in Fig. 3, we observed a connection between CTLA4 overexpression and better OS in BRCA patients. The PrognoScan analysis result showed that overexpression of CTLA4 was associated with better prognosis in BRCA patients (P < 0.05) (Fig. 3A). We used the Kaplan-Meier plotter to analyze and confirm that increased CTLA4 expression was associated with improved OS in BRCA (P < 0.01) (Fig. 3B). The analysis results of the R2: Kaplan-Meier scanner were consistent with the above results, that is, overexpression of CTLA4 is associated with better OS of BRCA patients (P < 0.05) (Fig. 3C).

The relationships between CTLA4 expression and clinicopathological features in patients with breast cancer

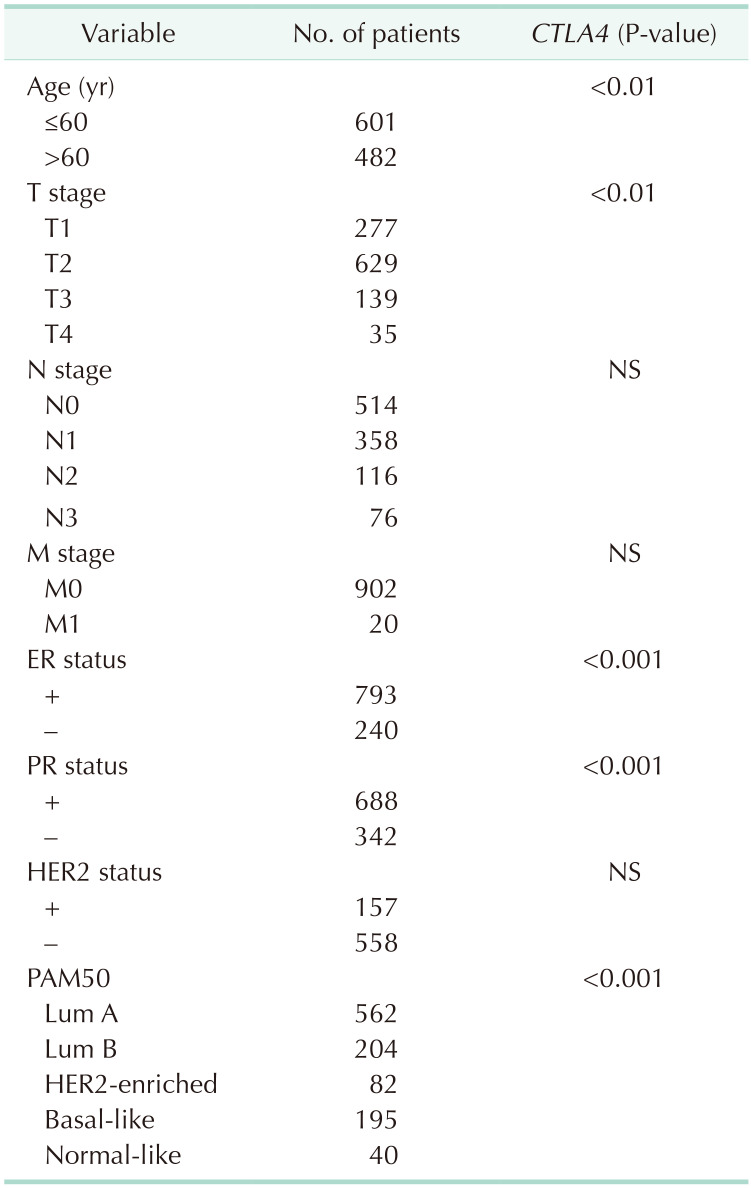
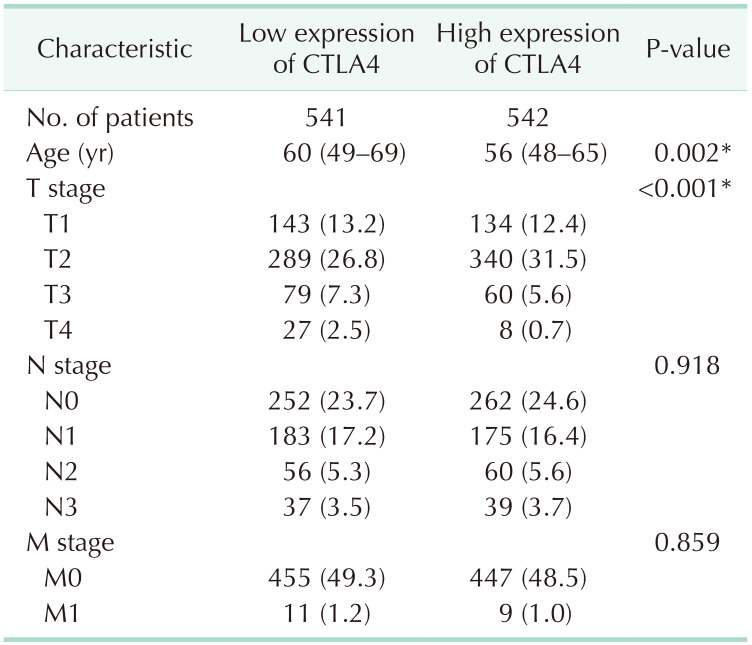
In the TCGA database, CTLA4 overexpression was connected to clinicopathological characteristics of BRCA patients (Table 1). Overexpression of CTLA4 was related to age, tumor size stage, ER status, PR status, and prediction analysis of microarray 50 (PAM50) subtypes in BRCA patients (P < 0.01). To validate the above findings, we examined the clinical characteristics of BRCA patients with low and high expression CTLA4 (Table 2). The results showed that the differential expression of CTLA4 was significantly related to age and T stage in BRCA patients (P < 0.01).

The relationship between CTLA4 expression and infiltration of immune cells

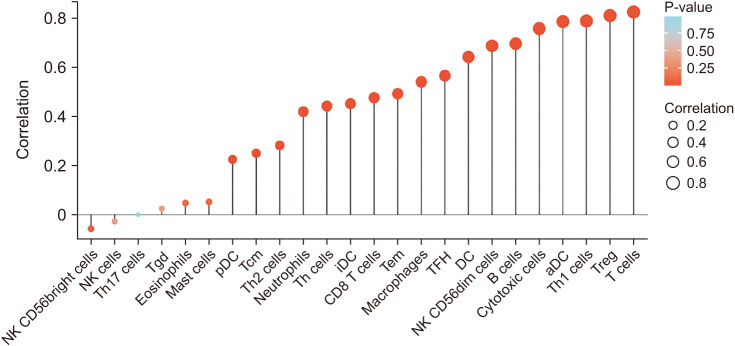
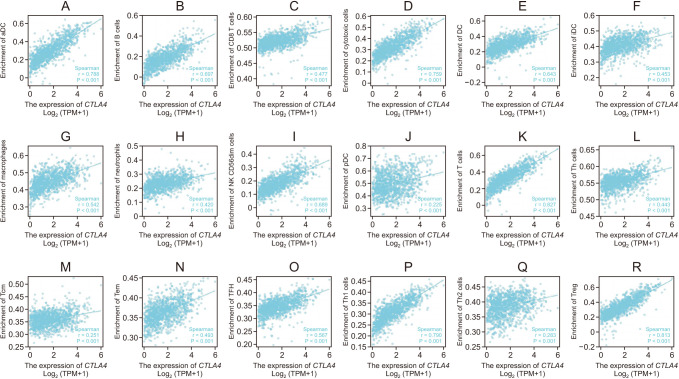
To understand the underlying mechanism of CTLA4 in BRCA, we investigated the associations between CTLA4 expression and immune cell infiltration in BRCA, as shown in Fig. 4. The results indicated that the expression of CTLA4 in BRCA was positively correlated with the infiltration of multiple immune cells (Fig. 4). CTLA4 mRNA expression was found to be positively correlated with the infiltration of activated dendritic cells (aDCs), B cells, CD8 T cells, cytotoxic cells, dendritic cells (DCs), immature DCs (iDCs), macrophages, neutrophils, natural killer CD56dim cells, plasmacytoid DCs (pDCs), T cells, T helper (Th) cells, T central memory, T effector memory, T follicular helper, Th1 cells, Th2 cells, and regulatory T cells (Tregs) in BRCA (P < 0.001, Fig. 5).

Functional enrichment analysis of samples with high and low CTLA4 expression

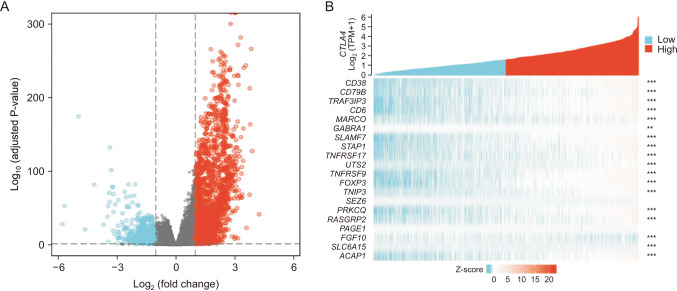
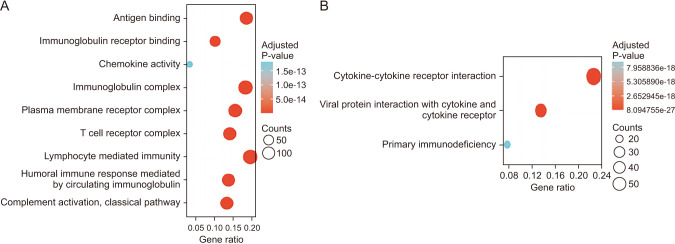
To further explore the potential mechanism of CTLA4 promoting antitumor immunity progression, we identified the DEGs and rich BP between the high expression group and the low expression group mediated by CTLA4. In the TCGA-BRCA transcriptome database, a total of 2936 DEGs were found, with 1,995 positively correlated genes and 941 negatively correlated genes for CTLA4 (Fig. 6A). The top 20 co-expressed genes with positive and negative correlations to CTLA4 were depicted in heat maps (Fig. 6B). Subsequently, the functions of the high expression group and the low expression of CTLA4 in patients with BRCA were predicted using GO and KEGG as shown in Fig. 6. The top GO enrichment items in the BP, CC, and MF groups were antigen binding, immunoglobulin complex, lymphocyte-mediated immunity (Fig. 7A). KEGG pathway analysis displayed that the high expression group and the low expression group mediated by CTLA4 were enriched in cytokine-cytokine receptor interaction (Fig. 7B).

Identification of known and predicted structural proteins essential for CTLA4 function

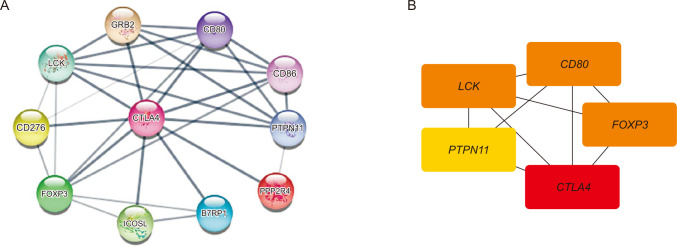
PPI networks are composed of proteins that interact with each other to participate in cellular processes such as biological signal transmission, gene expression regulation, energy and material metabolism, and cell cycle regulation. Therefore, additional interacting partners’ control of CTLA4 deserves further exploration. As shown in Fig. 8, we utilized the Cytoscape plug-in STRING protein query (set its parameter as Homo sapiens, with a confidence interval of 1) and Cytoscape plug-in cytoHubba to create a PPI network and analysis to hub genes. The predicted protein partners of CTLA4 along with their respective genes’ PPI networks were shown in Fig. 8A, which showed that there were 30 edges and 11 nodes. Further, the Cytoscape cytoHubba plug-in for hub genes analysis was used. We ran the cytoHubba application and extracted data from a degree of calculation methods. The top 5 hub genes were CTLA4, LCK, FOXP3, CD80, and PTPN11 (Fig. 8B). Thus, these predicted interacting partners of CTLA4 may be involved in the regulation of CTLA4-mediated anticancer progression and prognosis.

DISCUSSION

The relationship between CTLA4 expression profiles and clinical outcomes of BRCA was investigated in this study. BRCA is one of the most frequent cancers in women, and it is also the leading cause of cancer mortality in women [29]. Immune checkpoint inhibitors have been shown to increase survival in a variety of solid tumors and are now a standard part of treatment for many cancer types [30313233]. A previous study reported on targeted CTLA4 checkpoint blocking therapy, which has achieved remarkable efficacy in the treatment of different cancers [12]. It has been reported that high expression of CTLA4 correlates with poor survival in patients with melanoma, renal cell carcinoma, and colorectal cancer, and a significantly higher expression of it is present in patients with BRCA [34]. However, the mechanism of CTLA4 in BRCA progression is unclear. CTLA4 as a checkpoint predominantly functions early in the life cycle of the immune response, during T-cell priming and activation, and it enhances the immunosuppressive activity of Tregs [35]. Identifying aberrantly expressed genes in tumors is important for the development of individualized treatments, which can improve therapeutic outcomes [36]. Therefore, we first analyzed the expression of CTLA4 in BRCA tissues and normal breast tissues, finding that CTLA4 expression in BRCA tissues was higher than in normal tissues (P < 0.01). Then, we compared the expression of CTLA4 in different subtypes of BRCA and the expression of normal breast tissue using the UCLan (University of Central Lancashire) platform, and the results indicated that the expression of CTLA4 in BRCA subtypes Luminal, HER2 positive, and TNBC tissues was significantly higher than in normal tissues (P < 0.001).
Previous studies reported that high expression of CTLA4 correlates with poor survival of patients with melanoma, renal cell carcinoma, and colorectal cancer [3738]. However, it’s unclear what effect higher CTLA4 expression has on the OS of BRCA. In this study, we found that overexpression of CTLA4 mRNA levels was related to better OS (P < 0.05). It may be related to the fact that CTLA4 can relieve inhibitory signals of T-cell activation and thus enhance an effective antitumor response [39]. The previous study indicated that cancer cells express PD-L1 and CTLA4, which prevent the immune system from recognizing and destroying tumor cells, and PD-1 and CTLA4 blocking antibodies can activate the antitumor response, leading to tumor regression [40]. CTLA4 protein plays a key role in activating the antitumor response against cancer cells [41].
A study has reported that CTLA4 expression was associated with multiple lesions, larger tumor size, advanced lymph node stage, lymphovascular infiltration, and skin invasion in BRCA [42]. Our results indicated that overexpression of CTLA4 was related to age, tumor size stage, ER status, PR status, and PAM50 subtypes in BRCA patients (P < 0.01).
In this study, to comprehensively explore the mechanism of CTLA4 in BRCA, we investigated the associations between CTLA4 expression and immune cell infiltration, and the results showed that the expression of CTLA4 in BRCA was positively correlated with the infiltration of multiple immune cells. GO analysis found that the high expression group and the low expression of CTLA4 in BRCA were mainly involved in antigen binding, immunoglobulin complex, and lymphocyte-mediated immunity. KEGG pathway analysis showed that the high expression group and the low expression group mediated by CTLA4 were enriched in cytokine-cytokine receptor interaction. CTLA4 has 30 edges and 11 nodes in the PPI network, according to our findings, with the top 5 hub genes: CTLA4, LCK, FOXP3, CD80, and PTPN11. LCK (or lymphocyte-specific protein tyrosine kinase) is a member of the Src family and regulates the activation of T cells [9]. Previous studies have shown that LCK is expressed in various cancer types, such as BRCA, colon cancer, and lung carcinoma [434445]. LCK has been discovered to be expressed in BRCA and has been identified as a crucial participant in the HER2-enriched subtype network [44]. FOXP3 is a protein involved in immune system responses [46], which is expressed in BRCA and was associated with poor prognosis [47]. A member of the FOX protein family, FOXP3 appears to function as a master regulator of the regulatory pathway in the development and function of regulatory T cells [4849]. In addition, FOXP3 is the most specific and reliable marker of regulatory T cells, and elevated FOXP3 lymphocytes are thought to contribute to tumor-immune evasion in BRCA [50]. The cluster of differentiation 80 is a B7 type I membrane protein that regulates the immune system through an inhibitory interaction with CTLA4 [51]. PTPN11 has significant relevance in BRCA, and it encodes phosphatase SHP2, involved in BRCA progression [52].
CTLA4 may play an important regulatory role in the tumor-immune microenvironment of BRCA, which may serve as a potential indicator of prognosis and immunotherapy response for BRCA. Furthermore, CTLA4 may influence BRCA prognosis through antigen binding, immunoglobulin complexes, lymphocyte-mediated immunity, and cytokine-cytokine receptor interaction. These findings help us understand how CTLA4 plays a role in BRCA and set the stage for more research.

Notes

Fund/Grant Support: This study was supported by Konkuk University in 2022.

Conflict of Interest: No potential conflict of interest relevant to this article was reported.

Author Contributions:

  • Conceptualization: KSP.

  • Methodology: TYJ.

  • Validation: SHL.

  • Formal analysis: WCN.

  • Investigation: YBY.

  • Data curation: SEN.

  • Visualization: JHK.

  • Supervision: IJY.

  • Project administration: WSP.

  • Writing – Original Draft: TYJ.

  • Writing – Review & editing: All authors.

References

1. Sung H, Ferlay J, Siegel RL, Laversanne M, Soerjomataram I, Jemal A, et al. Global cancer statistics 2020: GLOBOCAN estimates of incidence and mortality worldwide for 36 cancers in 185 countries. CA Cancer J Clin. 2021; 71:209–249. PMID: 33538338.
2. Waks AG, Winer EP. Breast cancer treatment: a review. JAMA. 2019; 321:288–300. PMID: 30667505.
3. Cremasco V, Astarita JL, Grauel AL, Keerthivasan S, MacIsaac K, Woodruff MC, et al. FAP delineates heterogeneous and functionally divergent stromal cells in immune-excluded breast tumors. Cancer Immunol Res. 2018; 6:1472–1485. PMID: 30266714.
4. Mamessier E, Bertucci F, Sabatier R, Birnbaum D, Olive D. “Stealth” tumors: breast cancer cells shun NK-cells anti-tumor immunity. Oncoimmunology. 2012; 1:366–368. PMID: 22737617.
5. Barrueto L, Caminero F, Cash L, Makris C, Lamichhane P, Deshmukh RR. Resistance to checkpoint inhibition in cancer immunotherapy. Transl Oncol. 2020; 13:100738. PMID: 32114384.
6. Das M, Zhu C, Kuchroo VK. Tim-3 and its role in regulating anti-tumor immunity. Immunol Rev. 2017; 276:97–111. PMID: 28258697.
7. Yang J, He X, Lv Q, Jing J, Shi H. Management of adverse events in cancer patients treated with PD-1/PD-L1 blockade: focus on Asian populations. Front Pharmacol. 2019; 10:726. PMID: 31312140.
8. Yu J, Qin B, Moyer AM, Nowsheen S, Tu X, Dong H, et al. Author Correction: regulation of sister chromatid cohesion by nuclear PD-L1. Cell Res. 2020; 30:823. PMID: 32636455.
9. Sharma P, Allison JP. The future of immune checkpoint therapy. Science. 2015; 348:56–61. PMID: 25838373.
10. Iams WT, Porter J, Horn L. Immunotherapeutic approaches for small-cell lung cancer. Nat Rev Clin Oncol. 2020; 17:300–312. PMID: 32055013.
11. Emens LA. Breast cancer immunotherapy: facts and hopes. Clin Cancer Res. 2018; 24:511–520. PMID: 28801472.
12. Guan X, Wang Y, Sun Y, Zhang C, Ma S, Zhang D, et al. CTLA4-mediated immunosuppression in glioblastoma is associated with the infiltration of macrophages in the tumor microenvironment. J Inflamm Res. 2021; 14:7315–7329. PMID: 34992419.
13. Bour-Jordan H, Bluestone JA. Regulating the regulators: costimulatory signals control the homeostasis and function of regulatory T cells. Immunol Rev. 2009; 229:41–66. PMID: 19426214.
14. Egen JG, Kuhns MS, Allison JP. CTLA-4: new insights into its biological function and use in tumor immunotherapy. Nat Immunol. 2002; 3:611–618. PMID: 12087419.
15. Peggs KS, Quezada SA, Korman AJ, Allison JP. Principles and use of anti-CTLA4 antibody in human cancer immunotherapy. Curr Opin Immunol. 2006; 18:206–213. PMID: 16464564.
16. Schadendorf D, Hodi FS, Robert C, Weber JS, Margolin K, Hamid O, et al. Pooled analysis of long-term survival data from phase II and phase III trials of ipilimumab in unresectable or metastatic melanoma. J Clin Oncol. 2015; 33:1889–1894. PMID: 25667295.
17. AiErken N, Shi HJ, Zhou Y, Shao N, Zhang J, Shi Y, et al. High PD-L1 expression is closely associated with tumor-infiltrating lymphocytes and leads to good clinical outcomes in Chinese triple negative breast cancer patients. Int J Biol Sci. 2017; 13:1172–1179. PMID: 29104508.
18. Tomczak K, Czerwińska P, Wiznerowicz M. The Cancer Genome Atlas (TCGA): an immeasurable source of knowledge. Contemp Oncol (Pozn). 2015; 19(1A):A68–A77. PMID: 25691825.
19. Rhodes DR, Yu J, Shanker K, Deshpande N, Varambally R, Ghosh D, et al. ONCOMINE: a cancer microarray database and integrated data-mining platform. Neoplasia. 2004; 6:1–6. PMID: 15068665.
20. Tang Z, Li C, Kang B, Gao G, Li C, Zhang Z. GEPIA: a web server for cancer and normal gene expression profiling and interactive analyses. Nucleic Acids Res. 2017; 45(W1):W98–W102. PMID: 28407145.
21. Chandrashekar DS, Bashel B, Balasubramanya SA, Creighton CJ, Ponce-Rodriguez I, Chakravarthi BV, et al. UALCAN: a portal for facilitating tumor subgroup gene expression and survival analyses. Neoplasia. 2017; 19:649–658. PMID: 28732212.
22. Mizuno H, Kitada K, Nakai K, Sarai A. PrognoScan: a new database for meta-analysis of the prognostic value of genes. BMC Med Genomics. 2009; 2:18. PMID: 19393097.
23. Lánczky A, Nagy Á, Bottai G, Munkácsy G, Szabó A, Santarpia L, et al. miRpower: a web-tool to validate survival-associated miRNAs utilizing expression data from 2178 breast cancer patients. Breast Cancer Res Treat. 2016; 160:439–446. PMID: 27744485.
24. Hänzelmann S, Castelo R, Guinney J. GSVA: gene set variation analysis for microarray and RNA-seq data. BMC Bioinformatics. 2013; 14:7. PMID: 23323831.
25. Lu T, Zheng Y, Gong X, Lv Q, Chen J, Tu Z, et al. High expression of hyaluronan-mediated motility receptor predicts adverse outcomes: a potential therapeutic target for head and neck squamous cell carcinoma. Front Oncol. 2021; 11:608842. PMID: 33763352.
26. Bindea G, Mlecnik B, Tosolini M, Kirilovsky A, Waldner M, Obenauf AC, et al. Spatiotemporal dynamics of intratumoral immune cells reveal the immune landscape in human cancer. Immunity. 2013; 39:782–795. PMID: 24138885.
27. Yu G, Wang LG, Han Y, He QY. clusterProfiler: an R package for comparing biological themes among gene clusters. OMICS. 2012; 16:284–287. PMID: 22455463.
28. Shannon P, Markiel A, Ozier O, Baliga NS, Wang JT, Ramage D, et al. Cytoscape: a software environment for integrated models of biomolecular interaction networks. Genome Res. 2003; 13:2498–2504. PMID: 14597658.
29. Erratum: Global cancer statistics 2018: GLOBOCAN estimates of incidence and mortality worldwide for 36 cancers in 185 countries. CA Cancer J Clin. 2020; 70:313.
30. Wei SC, Duffy CR, Allison JP. Fundamental mechanisms of immune checkpoint blockade therapy. Cancer Discov. 2018; 8:1069–1086. PMID: 30115704.
31. Antonia SJ, Villegas A, Daniel D, Vicente D, Murakami S, Hui R, et al. Durvalumab after chemoradiotherapy in stage III non-small-cell lung cancer. N Engl J Med. 2017; 377:1919–1929. PMID: 28885881.
32. Powles T, O’Donnell PH, Massard C, Arkenau HT, Friedlander TW, Hoimes CJ, et al. Efficacy and safety of durvalumab in locally advanced or metastatic urothelial carcinoma: updated results from a phase 1/2 open-label study. JAMA Oncol. 2017; 3:e172411. PMID: 28817753.
33. Rini BI, Plimack ER, Stus V, Gafanov R, Hawkins R, Nosov D, et al. Pembrolizumab plus axitinib versus sunitinib for advanced renal-cell carcinoma. N Engl J Med. 2019; 380:1116–1127. PMID: 30779529.
34. Bassaro L, Russell SJ, Pastwa E, Somiari SA, Somiari RI. Screening for multiple autoantibodies in plasma of patients with breast cancer. Cancer Genomics Proteomics. 2017; 14:427–435. PMID: 29109092.
35. Topalian SL, Taube JM, Anders RA, Pardoll DM. Mechanism-driven biomarkers to guide immune checkpoint blockade in cancer therapy. Nat Rev Cancer. 2016; 16:275–287. PMID: 27079802.
36. Cao Z, Zhang S. An integrative and comparative study of pan-cancer transcriptomes reveals distinct cancer common and specific signatures. Sci Rep. 2016; 6:33398. PMID: 27633916.
37. Topalian SL, Hodi FS, Brahmer JR, Gettinger SN, Smith DC, McDermott DF, et al. Safety, activity, and immune correlates of anti-PD-1 antibody in cancer. N Engl J Med. 2012; 366:2443–2454. PMID: 22658127.
38. Gunturi A, McDermott DF. Potential of new therapies like anti-PD1 in kidney cancer. Curr Treat Options Oncol. 2014; 15:137–146. PMID: 24504486.
39. Azoury SC, Straughan DM, Shukla V. Immune checkpoint inhibitors for cancer therapy: clinical efficacy and safety. Curr Cancer Drug Targets. 2015; 15:452–462. PMID: 26282545.
40. Chen CF, Ruiz-Vega R, Vasudeva P, Espitia F, Krasieva TB, de Feraudy S, et al. ATR mutations promote the growth of melanoma tumors by modulating the immune microenvironment. Cell Rep. 2017; 18:2331–2342. PMID: 28273450.
41. Liyanage UE, Law MH, Han X, An J, Ong JS, Gharahkhani P, et al. Combined analysis of keratinocyte cancers identifies novel genome-wide loci. Hum Mol Genet. 2019; 28:3148–3160. PMID: 31174203.
42. Babteen NA, Fawzy MS, Alelwani W, Alharbi RA, Alruwetei AM, Toraih EA, et al. Signal peptide missense variant in cancer-brake gene CTLA4 and breast cancer outcomes. Gene. 2020; 737:144435. PMID: 32044407.
43. Clarke CN, Lee MS, Wei W, Manyam G, Jiang ZQ, Lu Y, et al. Proteomic features of colorectal cancer identify tumor subtypes independent of oncogenic mutations and independently predict relapse-free survival. Ann Surg Oncol. 2017; 24:4051–4058. PMID: 28936799.
44. Chakraborty G, Rangaswami H, Jain S, Kundu GC. Hypoxia regulates cross-talk between Syk and Lck leading to breast cancer progression and angiogenesis. J Biol Chem. 2006; 281:11322–11331. PMID: 16474166.
45. Mahabeleshwar GH, Kundu GC. Tyrosine kinase p56lck regulates cell motility and nuclear factor kappaB-mediated secretion of urokinase type plasminogen activator through tyrosine phosphorylation of IkappaBalpha following hypoxia/reoxygenation. J Biol Chem. 2003; 278:52598–52612. PMID: 14534291.
46. Brunkow ME, Jeffery EW, Hjerrild KA, Paeper B, Clark LB, Yasayko SA, et al. Disruption of a new forkhead/winged-helix protein, scurfin, results in the fatal lymphoproliferative disorder of the scurfy mouse. Nat Genet. 2001; 27:68–73. PMID: 11138001.
47. Liang YJ, Lao XM, Liang LZ, Liao GQ. Genome-wide analysis of cancer cell-derived Foxp3 target genes in human tongue squamous cell carcinoma cells. Int J Oncol. 2015; 46:1935–1943. PMID: 25779374.
48. Hori S, Nomura T, Sakaguchi S. Control of regulatory T cell development by the transcription factor Foxp3. Science. 2003; 299:1057–1061. PMID: 12522256.
49. Fontenot JD, Gavin MA, Rudensky AY. Foxp3 programs the development and function of CD4+CD25+ regulatory T cells. Nat Immunol. 2003; 4:330–336. PMID: 12612578.
50. Adams TA, Vail PJ, Ruiz A, Mollaee M, McCue PA, Knudsen ES, et al. Composite analysis of immunological and metabolic markers defines novel subtypes of triple negative breast cancer. Mod Pathol. 2018; 31:288–298. PMID: 28984302.
51. Chen R, Ganesan A, Okoye I, Arutyunova E, Elahi S, Lemieux MJ, et al. Targeting B7-1 in immunotherapy. Med Res Rev. 2020; 40:654–682. PMID: 31448437.
52. Gazinska P, Grigoriadis A, Brown JP, Millis RR, Mera A, Gillett CE, et al. Comparison of basal-like triple-negative breast cancer defined by morphology, immunohistochemistry and transcriptional profiles. Mod Pathol. 2013; 26:955–966. PMID: 23392436.
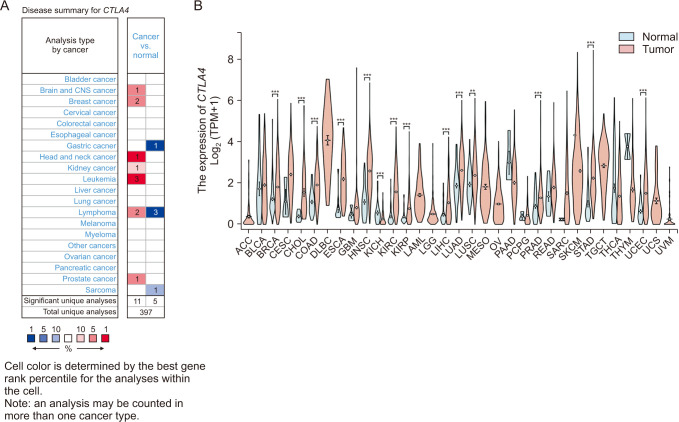
Fig. 1

The expression of CTLA4 messenger RNA (mRNA) in different types of cancers (Oncomine and The Cancer Genome Atlas [TCGA] database). (A) This graphic generated by Oncomine (https://www.oncomine.org/resource/login.html) indicates the numbers of datasets with statistically significant (P < 0.01) mRNA overexpression (red) or down-expression (blue) of CTLA4 (different types of cancer vs. corresponding normal tissue). The threshold was designed with the following parameters: P-value of 1e-4, fold change of 2, and gene ranking of 10%. (B) Human CTLA4 expression levels in different tumor types from the TCGA database were determined. ***P <0.001.

astr-106-263-g001
Fig. 2

The expression of CTLA4 messenger RNA in breast cancer (BRCA). (A) Expression of CTLA4 in cancer tissue and normal tissue generated by GEPIA web (Gene Expression Profiling Interactive Analysis; http://gepia.cancer-pku.cn/index.html), P < 0.01. (B) Expression of CTLA4 in BRCA based on BRCA subtypes by UALCAN web (Utility for Alleviating Laboratory, and Computational Analysis; http://ualcan.path.uab.edu/index.html). TCGA, The Cancer Genome Atlas; HER2, human epidermal growth factor 2.

astr-106-263-g002
Fig. 3

Overall survival (OS) of CTLA4 in breast cancer. (A) OS of CTLA4 in breast cancer using PrognoScan (http://dna00.bio.kyutech.ac.jp/PrognoScan-cgi/PrognoScan.cgi). (B) OS of CTLA4 in breast cancer using Kaplan-Meier plotter (https://kmplot.com/analysis/index.php?p=service). (C) OS of CTLA4 in breast cancer using R2: Kaplan-Meier scanner (https://hgserver1.amc.nl/cgi-bin/r2/main.cgi). HR, hazard ratio; CI, confidence interval; TCGA, The Cancer Genome Atlas.

astr-106-263-g003
Fig. 4

The relationship between CTLA4 expression and immune cell infiltration in breast cancer. NK, natural killer; Th, T helper; Tgd, T gamma delta; DC, dendritic cell; pDC, plasmacytoid DC; iDC, immature DC; aDC, activated DC; Tcm, T central memory; Tem, T effector memory; TFH, T follicular helper; Treg, regulatory T cell.

astr-106-263-g004
Fig. 5

The correlation between CTLA4 expression and immune cell infiltration in breast cancer. Correlation between CTLA4 expression and (A) activated dendritic cells (aDC), (B) B cells, (C) CD8 T cells, (D) cytotoxic cells, (E) dendritic cells (DC), (F) immature dendritic cells (iDC), (G) macrophages, (H) neutrophils, (I) natural killer (NK) CD56dim cells, (J) plasmacytoid DC (pDC), (K) T cells, (L) T helper (Th) cells, (M) T central memory (Tcm), (N) T effector memory (Tem), (O) T follicular helper (TFH), (P) Th1 cells, (Q) Th2 cells, and (R) regulatory T cells (Treg). TPM, transcripts per million. P < 0.001.

astr-106-263-g005
Fig. 6

Functional enrichment analysis of samples with high and low CTLA4 expression. (A) Volcano plot of differentially expressed genes (DEGs), |log2 (FC)| > 1 and adjusted P < 0.05. (B) Heatmap of DEGs. TPM, transcripts per million.**P < 0.01 and ***P < 0.001.

astr-106-263-g006
Fig. 7

Gene Ontology (GO) and Kyoto Encyclopedia of Genes and Genomes (KEGG) analysis of differentially expressed genes with low and high expression CTLA4 in breast cancer. (A) GO analysis. (B) KEGG analysis. P < 0.001.

astr-106-263-g007
Fig. 8

Identification of known and predicted structural proteins essential for CTLA4 functions and top 5 hub genes (cytoHubba). (A) The protein-protein interaction network of CTLA4 was generated using the Cytoscape STRING plug-in. GRB2, growth factor receptor-bound protein 2; CD80, T-lymphocyte activation antigen CD80; LCK, tyrosine-protein kinase Lck; CD86, T-lymphocyte activation antigen CD86; CD276, immune costimulatory protein b7-h3; PTPN11, tyrosine-protein phosphatase non-receptor type 11; FOXP3, forkhead box protein P3; ICOSL, ICOS ligand; B7RP1, inducible T-cell co-stimulator ligand; PPP2R4, serine/threonine-protein phosphatase 2A activator. (B) The top 5 hub genes were identified using the Cytoscape cytoHubba plug-in with extracted data from the degree of calculation methods.

astr-106-263-g008
Table 1

The relationships between CTLA4 expression and clinicopathological features in breast cancer

astr-106-263-i001

NS, no significance; ER, estrogen receptor; PR, progesterone receptor; HER2, human epidermal growth factor receptor 2; PAM50, prediction analysis of microarray 50; Lum, Luminal; HER2, human epidermal growth factor 2.

Table 2

Clinical characteristics of breast cancer patients with low and high expression CTLA4 in TCGA

astr-106-263-i002

Values are presented as number only, median (interquartile range), and number (%).

*P < 0.05.

TOOLS
Similar articles