

 PDF
PDF Citation
 Print
Print


INTRODUCTION
Neuroblastoma (NB) is the most common childhood extracranial solid tumor, originating from sympathetic neurons and neural crest precursor cells of adrenal chromaffin cells [1]. NB accounts for 7% to 8% of childhood malignancies, with an incidence of 10.2 cases per million children under 15 years of age and a median age at diagnosis of 17 months [2]. It also contributes to about 15% of all childhood cancer deaths [3]. NB is a complex disorder that exhibits different clinical, biological, and prognostic features depending on the location of the primary tumor, mostly in the adrenal medulla and a few in the paravertebral sympathetic ganglia of the neck, chest, abdomen, or pelvis [4]. Patients with low-risk NB have a good prognosis, with a 5-year survival rate of more than 90%. However, 60% of patients are high-risk NB, and the prognosis remains poor, with a 5-year survival rate of less than 50% [5]. Therefore, targeted treatment options for NB need to be further explored.
SRY-box transcription factor (TF) 11 (SOX11), a member of the SRY-related HMG-box C group, located on chromosome 2p25.3, is a single exon gene with a full-length complementary DNA (cDNA) of 8,743 bp and a long 3’ untranslated region. SOX11 has 2 functional domains: the N-terminal HMG domain and the conserved C-terminal transactivation domain [6]. SOX11 is considered an important regulator in embryonic development and is widely expressed during early embryogenesis but is largely unexpressed in most adult differentiated tissues [7]. The expression of SOX11 in different tissues and organs is different, and it can play both carcinogenic and cancer-suppressing effects. SOX11 can induce neuronal differentiation of NB cells SH-SY5Y by increasing LINE-1 activity [8]. There are only 2 studies of SOX11 in NB, one of which has reported that expression of SOX11 enhances SK-N-BE(2)C cell proliferation and migration [9], and the other demonstrates that SOX11 is a member of the adrenergic NB core regulatory circuit [10]. However, the exact mechanism by which SOX11 regulates the occurrence and development of NB is unknown.
This study aimed to investigate the potential regulatory role of TF SOX11 in NB. The expression of SOX11 at the messenger RNA (mRNA) level was studied through RNA-sequencing (RNA-seq) data, and the impact of SOX11 on the prognosis of NB was explored by analyzing clinical information. In this study, the NB cell line SK-N-SH that silenced SOX11 was constructed and its effect on NB proliferation, migration, and invasion was observed. Finally, the regulatory mechanism of SOX11 in NB was analyzed by metabolic pathway analysis and prediction of the downstream target gene of SOX11, thereby broadening our understanding of SOX11 in the occurrence and development of NB.
METHODS
The study was approved by the Institutional Review Board of The First Affiliated Hospital of Guangxi Medical University (No. 2023-E277-01). Informed consent from the subjects was exempted.
Data sources
We downloaded and extracted the RNA-seq dataset of NB and the clinicopathological parameters of NB children, including age, sex, relapse, Children’s Oncology Group (COG) risk group, MYCN status, International Neuroblastoma Staging System (INSS) stage, histology, from Therapeutically Applicable Research to Generate Effective Treatments (TARGET; https://www.cancer.gov/ccg/research/genome-sequencing/target) database. All samples were collected from the clinical trial research of COG, and the pathological diagnosis was clear [11]. RNA-seq data for normal adrenal tissue were downloaded from the GTEx Project is "Adult Genotype-Tissue Expression (GTEx) Project [12]. The 2 databases were merged, and the batch effect was removed by the ‘limma’ package in R software ver. 4.2.3 (The R Foundation), and the resultant dataset was normalized by log2 (x + 1).
Prognostic value of SOX11 in neuroblastoma
In this study, the clinicopathological features of NB in the TARGET database were collected, and the expression difference of SOX11 between the high-expression group and the low-expression group was determined by an independent sample t-test. The Kaplan-Meier curve was used to compare the survival rate between the high and low SOX11 expression groups. The log-rank test was used to test whether it was statistically significant.
Identification of differentially expressed genes and SOX11 co-expressed genes
Based on the expression matrix of NB tissue and adrenal tissue, differentially expressed genes (DEGs) were screened using the limma package in the R software ver. 4.2.3. The filter criteria for DEGs were |log2 fold change| >2 and adjusted P-value of <0.01. The correlation between SOX11 expression and all DEGs was analyzed, and Pearson correlation coefficients >0.5 and P < 0.05 were identified as co-expressed genes (CEGs).
Gene Ontology-Kyoto Encyclopedia of Genes and Genomes enrichment analysis
SOX11’s CEGs were stored in the DAVID (Database for Annotation, Visualization and Integrated Discovery) and analyzed by Gene Ontology (GO) and the Kyoto Encyclopedia of Genes and Genomes (KEGG). Based on the Sangerbox tool (http://www.sangerbox.com/tool), visualized the 10 most important biological processes (BP), cellular components, molecular functions, and KEGG projects. Using the data from TARGET, each gene was sorted according to the log2FC value, and the Gene Set Enrichment Analysis (GSEA) was performed in R software.
Cell culture and transfection
Human NB cell line SK-N-SH was purchased from Cybaikang Biotechnology Co., Ltd. and cultured using DMEM/F12 medium (C11995500, Gibco) in a humidified incubator containing 5% CO2 at 37 ℃. Seeded on 6-well plates at a density of 1 × 10⁵/well, when cells grew to 60%–80% confluence, small interfering (si) RNA was transfected into NB cells using Lipofectamine 3000 (L3000015, Thermo Fisher Scientific) according to the manufacturer’s specifications, and cells were harvested after 48 hours of transfection. The complex preparation method for negative control (NC) and transfection reagent was consistent with the preparation method for siRNA transfection complex.
Real-time polymerase chain reaction
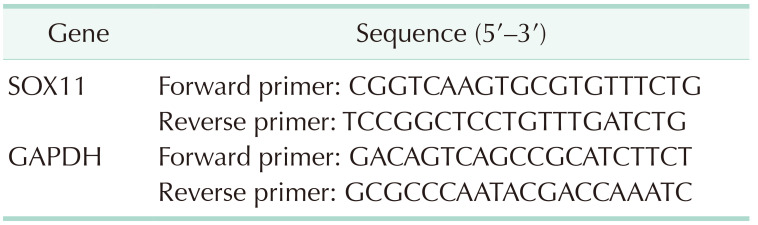
Total RNA was isolated from SK-N-SH cells using TriQuick Reagent (R1100-100 mL, Beijing Solarbio Science & Technology Co., Ltd) and prepared reaction systems to convert mRNA to cDNA according to the instructions using a reverse transcription kit (MR05101M, Mona Biotechnology Co., Ltd). After the reverse transcription was completed, a real-time polymerase chain reaction (PCR) was performed using a 2 × S6 Universal SYBR quantitative PCR (qPCR) mix (Q204-01, Xinbei Biotechnology Co., Ltd). After thawing the reaction reagents on ice, mixed well and added the following samples: SYBR qPCR mix, 10 µL; Primer-F, 0.4 µL; Primer-R, 0.4 µL; cDNA, 2 µL; and nuclease-free water (up to 20 µL). Using standard cycling conditions, predenaturation (95 ℃, 30 seconds, 1 cycle), denaturation (95 ℃, 3 seconds, 40 cycles), annealing and extension (60 ℃, 10 seconds), the relative expression levels of SOX11 in cell samples before and after transfection were detected on a real-time PCR instrument (MA-6000, Yarui Biotechnology Co., Ltd.). In this study, glyceraldehyde 3-phosphate dehydrogenase was used as the internal control (Table 1). The mRNA expression of SOX11 was calculated with the 2-ΔΔCt method.
Western blotting
We took 1 mL of radioimmunoprecipitation assay lysate lysate (89901, Thermo Fisher Scientific) and added 10-µL phosphatase protease inhibitor (78420, Thermo Fisher Scientific) to prepare whole cell lysate, removed cells pre-seeded in 6-well plates (density is about 70% or more), added lysate and extracted protein. We then separated the lysate on 10% Bis-Tris precast (NP0301BOX, Thermo Fisher Scientific) and transferred it to polyvinylidene difluoride (PVDF) membrane (ISEQ00010, Merck). We removed the PVDF membrane, determined the approximate position of the inner reference cyclophilin B and the protein to be tested according to the marker instructions, cut out the corresponding band and put it in the incubation box, and added blocking solution to block at room temperature for 1 hour. The membrane was incubated with cyclophilin B primary antibody (1:1,000, ab178397; Abcam) or SOX11 primary antibody (1:1,000, ab170916; Abcam) overnight, followed by incubation with secondary antibody (1:10,000, G-21234; Thermo Fisher Scientific). The samples were visualized using an enhanced chemiluminescence substrate (32109, Thermo Fisher Scientific).
CCK8
The CCK8 kit (CK04-500T, Dojindo) was used to detect cell proliferation by seeding transfected SK-N-SH cells into 96-well plates. The corresponding 96-well plates were removed at 48 hours and 72 hours, and then 10 µL of CCK-8 solution was added to each well. The plates were further incubated at 37 ℃ for another 1 hour. A wavelength of 450 nm was selected using a microplate reader for absorbance detection.
Wound healing assay
Place the transfected SK-N-SH cells in a 6-well plate until the cells are evenly spread at the bottom of the 6-well plate. Took a ruler as a reference and drew scratches. Phosphate-buffered saline washed off crossed-out cells and plates were cultured in a 37 ℃ and 5% CO2 cell culture incubator. Images were taken with an inverted microscope (CKX53, Olympus) at 0 and 24 hours. The resulting picture was measured with the microscope companion software for the ruler and scratch area.
Transwell invasion assay
Resuspended cells in medium containing 1% penicillin-streptomycin (15140122, Gibco), with 100 µL of cell suspension added to the upper chamber with Matrigel basement membrane matrix (356234, BD), and 500 µL of complete medium placed into the lower chamber. After incubation in a 37 ℃, 5% CO2 incubator for 24 hours, 4% paraformaldehyde (P1110-500 mL, Solarbio Life Sciences) was added to the lower chamber, cells were fixed, crystal violet (G1063-100 mL, Solarbio Life Sciences) 500 µL/well was added to the lower chamber, stained for 30 minutes and dried. We took pictures of the sample with 5 fields of view under a 10× microscope. We used Image J software to analyze the meter.
Potential SOX11 target genes
SOX11 target genes with a score of >0.5 were obtained using the Harmonizonme (Ma’ayan Laboratory; https://maayanlab.cloud/Harmonizome) dataset CHEA Transcription Factor Targets and the Cistrome Data Browser (Cistrome Project; http://cistrome.org/db/#/) database. The target genes and the upregulated DEGs were intersected, and whether the target gene had a binding peak with SOX11 was observed through the Cistrome Data Browser database. Subsequently, we also used the RNA-seq data downloaded from the TARGET database and the GTEx database described above to explore the expression of target genes in NB.
Statistical analysis
In this study, IBM SPSS Statistics ver. 25.0 (IBM Corp.), R software ver. 4.2.3, and GraphPad ver. 8.0.2 software (GraphPad Software, Inc.) was used for statistical analysis and graphing. The differences between the 2 groups were compared using the independent sample t-test. A P-value of <0.05 was regarded as statistically significant.
RESULTS
Clinicopathological parameters of neuroblastoma cases
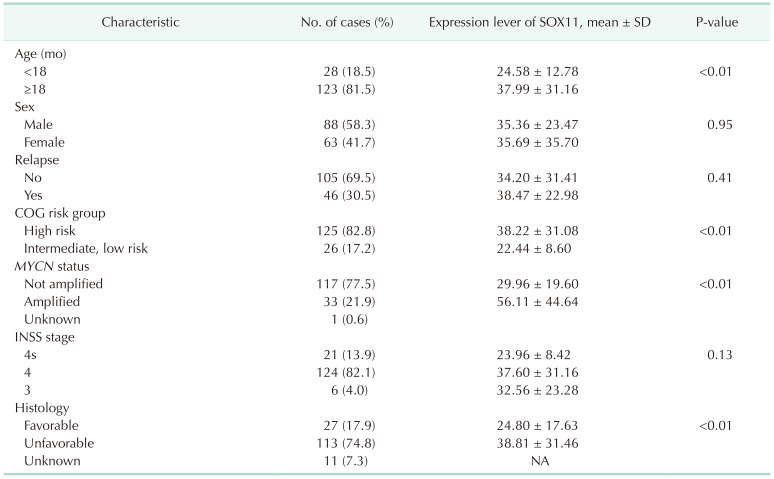
RNA-seq data from 151 cases of NB from the TARGET database and 258 cases of normal human adrenal tissue from the GTEx database were included. Among them, 28 children (18.5%) were less than 18 months, 123 (81.5%) were older than 18 months, 88 (58.3%) were male, and 63 (41.7%) were female (Table 2).
Upregulation of SOX11 messenger RNA expression in neuroblastoma
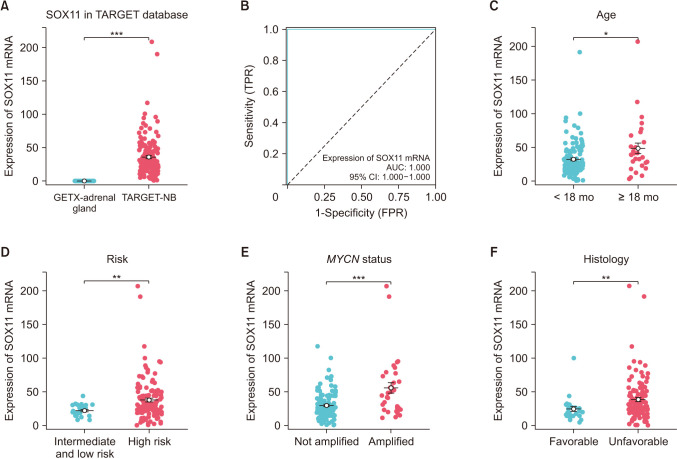
RNA-seq data showed that SOX11 mRNA was highly expressed in NB tissues compared to normal adrenal tissues. Receiver operating characteristic (ROC) curve analysis showed that SOX11 had a good ability to distinguish NB from normal tissue. In addition, we also found that the expression of SOX11 in children with an average age greater than or equal to 18 months was higher than in children with an average age of less than 18 months, higher in high-risk children than in children with intermediate and low risk, higher in children with MYCN amplification than in children with non-MYCN amplification, and higher in the group with poor histological prognosis than in the group with good histological prognosis (Fig. 1).
High SOX11 expression is associated with poor neuroblastoma prognosis
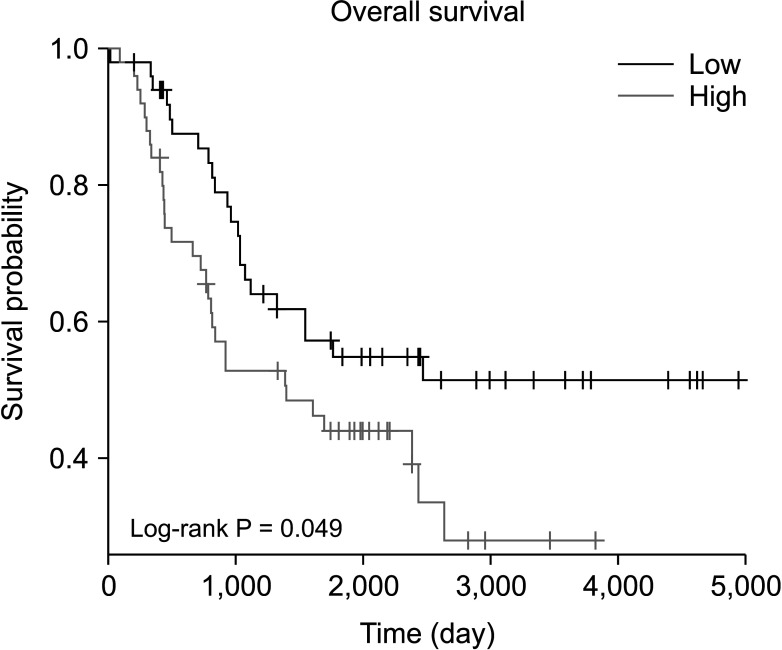
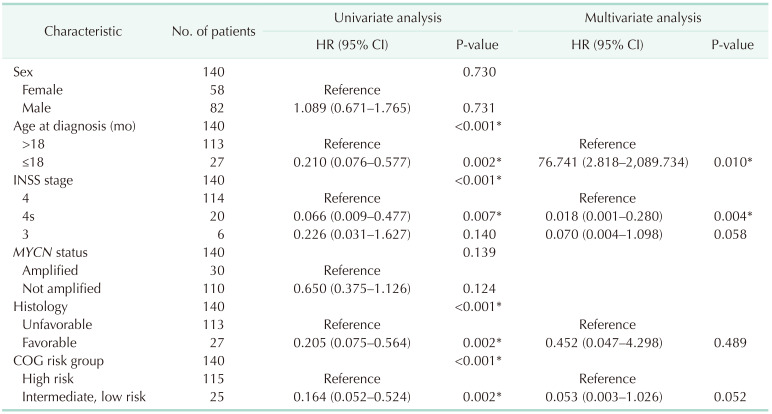
In order to further explore the relationship between SOX11 expression and prognosis in children with NB, we performed clinical parameter analysis based on the TARGET database (Table 2). We found that SOX11 expression was closely related to age, COG risk group, MYCN status, and histology (P < 0.05), and the Kaplan-Meier curve showed that the overall survival rate of NB children in the group with high SOX11 expression was lower (hazard ratio [HR], 1.719; P = 0.049) (Fig. 2). The results of univariate and multivariate COX analysis showed that younger than 18 months (HR, 76.741; 95% confidence interval [CI], 2.818–2,089.734; P = 0.01), 4-second period (HR, 0.018; 95% CI, 0.001–0.280; P = 0.004) were independently correlated with overall survival time, but INSS stage, risk grouping or MYCN status were not identified as relevant factors (Table 3).
SOX11 knockdown suppressed the migration of SK-N-SH
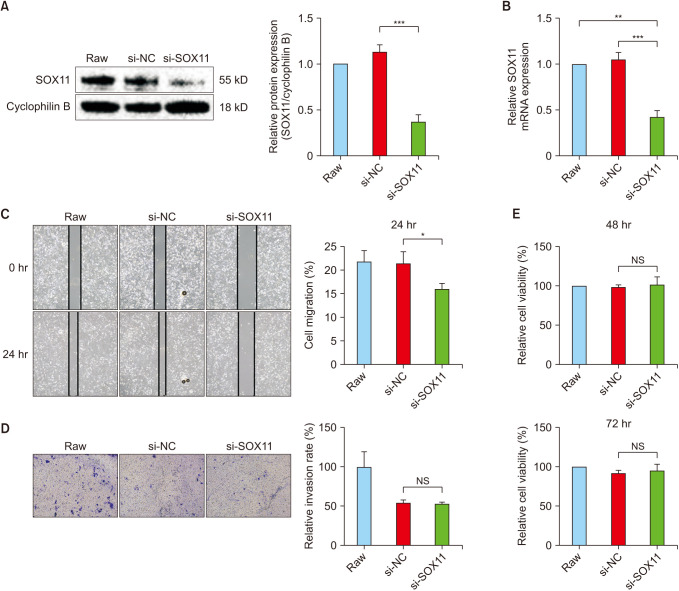
To investigate the biological function of SOX11 in NB progression, we controlled its endogenous expression in SK-N-SH cells by transfecting SOX11-targeting siRNA. Western blot (Fig. 3A) and qPCR results (Fig. 3B) showed that the expression of si-SOX11 protein and mRNA was significantly downregulated compared with the blank group and NC group (P < 0.01).
Next, to further determine the effect of SOX11 on the migration ability of SK-N-SH, we performed a wound healing assay. The results showed (Fig. 3C) that the mobility of the si-SOX11 group was lower than that of the raw and si-NC groups, indicating that SOX11 knockdown suppressed the migration of SK-N-SH cells (P < 0.05). To further determine the effect of SOX11 on SK-N-SH invasion and proliferation, we performed a transwell assay and CCK8 assay. The results of the transwell (Fig. 3D) showed that there was no significant difference in the relative invasion rate between si-NC and si-SOX11 (P > 0.05). CCK8 (Fig. 3E) results showed no significant differences in the cells in the si-SOX11 group compared to the other groups. In summary, it can be concluded that SOX11 knockdown does not affect the invasion and proliferation capacity of SK-N-SK cells.
SOX11 co-expressed genes enrichment analysis
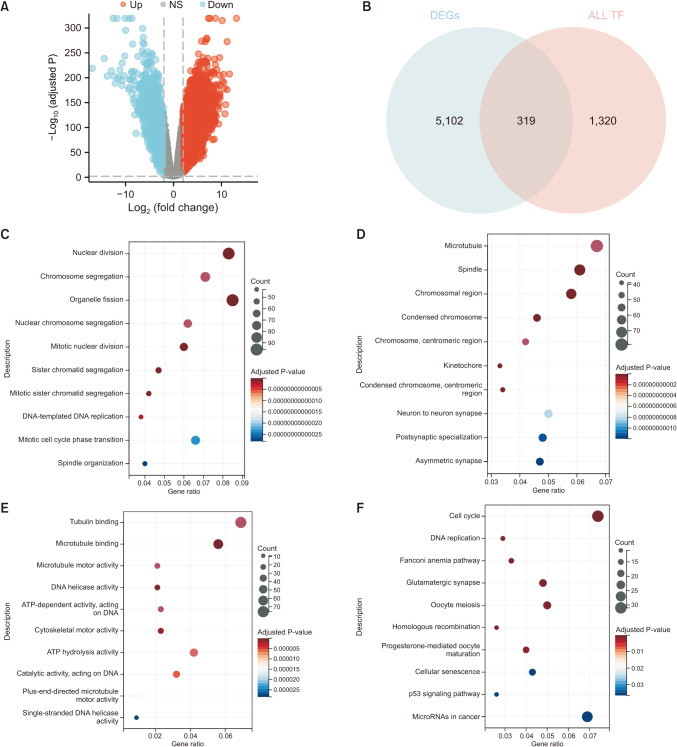
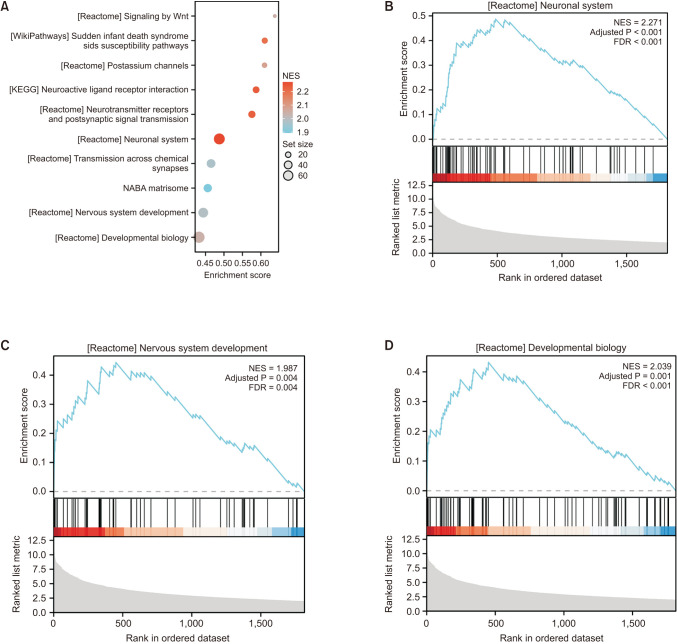
We combined the data from the TARGET database and the GTEx database, and calculated 5,421 significantly differentially expressed mRNAs using the limma package in R, of which 4,059 were significantly overexpressed mRNAs and 1362 significantly underexpressed mRNAs (|log2FC| > 2, adjusted P < 0.01) (Fig. 4A), and intersected DEGs with all TFs to obtain 319 TFs (Fig. 4B), and found that SOX11 was the most significantly upregulated TF. Next, the correlation between SOX11 expression and all DEGs expression was analyzed, and 1,901 CEGs were obtained for enrichment analysis. The BPs are mainly concentrated in the nuclear division, chromosome segregation, and organelle fission (Fig. 4C). The cell components are mainly enriched in microtubule, chromosomal region, spindle (Fig. 4D). In terms of molecular function, overlapping genes are mainly enriched in tubulin binding, microtubule binding, and microtubule motor activity (Fig. 4E). Regarding the KEGG pathway, overlapping genes are mainly concentrated in cell cycle, microRNAs (miRNAs) in cancer, p53 signaling pathway (Fig. 4F). GSEA analysis (Fig. 5) focused on the neuronal system, nervous system development, and developmental biology.
SOX11 activates the expression of enhancer of zeste homolog 2 (EZH2)
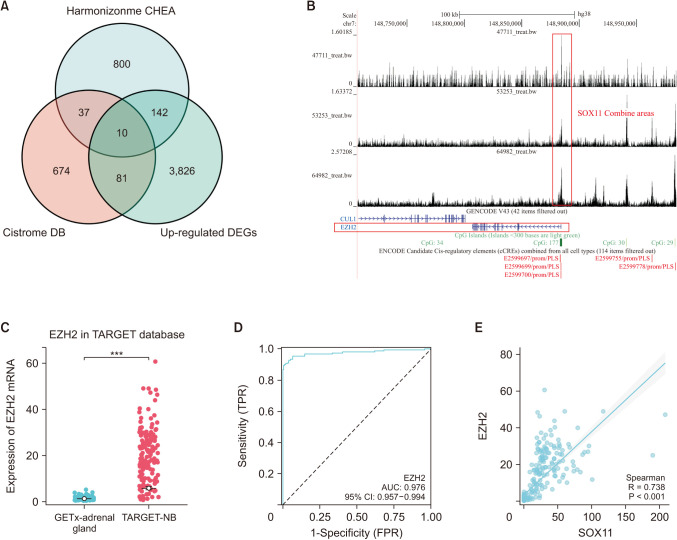
TF is a sequence-specific DNA-binding protein with important functions, which regulates the binding of RNA polymerase to DNA during transcription through interaction with cis-acting elements on the DNA sequence, thereby directly affecting the transcription of the target gene [13]. We obtained SOX11-targeting genes from the CHEA Transcription Factor Targets in the Harmonizonme and Cistrome dataset and intersected with upregulated differential genes to obtain 10 target genes (EZH2, RND1, PDE4D, NRXN2, PTPRN2, B4GALNT1, SVOP, NOVA2, LHX2) (Fig. 6A). At the same time, we found that SOX11 had a binding peak upstream of the DNA sequence of the EZH2 gene (Fig. 6B), and further analysis found that EZH2 was highly expressed in NB (Fig. 6C), ROC curve analysis showed that EZH2 had a good ability to distinguish between NB and normal tissues (Fig. 6D), and EZH2 was positively correlated with SOX11 expression (r = 0.738) (Fig. 6E). In addition, the enrichment analysis results revealed regulation of cell development, positive regulation of neuron projection development, regulation of neurogenesis, regulation of nervous system in BPs and miRNAs in cancer pathway in KEGG both include EZH2.
DISCUSSION
NB is an embryonic malignancy that is the second most common solid tumor in childhood after central nervous system tumors [4]. NB presents with genetic, morphological, and clinical heterogeneity, limiting the effectiveness of existing treatments. Therefore, further research on the molecular mechanism of NB is urgently needed. A growing number of studies have found that SOX11 regulates a variety of cellular phenotypes by affecting developmental, physiological, and carcinogenic expressions, becoming a regulator in various cancers. However, only 2 studies have reported on the biological function of SOX11 in NB. In this study, we not only constructed SK-N-SH cells that silence SOX11 to explore its biological function on NB. Most importantly, we revealed the underlying molecular function and downstream regulatory mechanisms of SOX11 in NB.
The expression of TF SOX11 in different tissues and organs is different, which can play both carcinogenic and cancer-suppressing effects. Recent studies have found that SOX11 knockdown in head and neck squamous cell carcinoma cell lines significantly inhibited proliferation, migration, invasion, and resistance to cisplatin in head and neck squamous cell carcinoma [14]. MiR-145 significantly inhibited the proliferation, migration, and invasion of endometrial cancer cells by reducing the expression of SOX11 [15]. The knockdown of SOX11 also inhibited the proliferation, migration, and invasion of pancreatic cancer cells [16]. These results suggest that SOX11 promoted tumor proliferation, migration, and invasion. Interestingly, SOX11 played a cancer-suppressing role in some cancers. For example, in mantle cell lymphoma, overexpressing SOX11 inhibited cell proliferation, and silencing SOX11 promoted cell proliferation [17]. Overexpression of SOX11 promoted growth inhibition and apoptosis of the hepatocellular carcinoma (HCC) cell line HuH-7, which was identified as a potential tumor suppressor in HCC [18]. More interestingly, a study on gastric cancer demonstrated through in vivo and in vitro experiments that overexpression of SOX11 did not inhibit the growth of gastric cancer cells, and cell cycle distribution and apoptosis rates did not show significant differences between vector control and SOX11 overexpressed cells [19].
In NB, the clinical significance of upregulation of SOX11 expression has been revealed. In one study using immunohistochemistry, high SOX11 protein levels were associated with poor overall survival, and high SOX11 mRNA levels (4th quantile) were significantly associated with poor overall survival and progression-free survival in the 276 and 498 NB patients [10]. We analyzed data from 151 NB patients in the TARGET database and 258 normal adrenal tissue cases in the GTEx database and confirmed that SOX11 expression was upregulated at the mRNA level in NB, and found that high expression of SOX11 was associated with a poor prognosis for V NB. In addition, we found that the high expression of SOX11 was closely related to clinical parameters including month age, COG risk group, MYCN amplification status, and histology. These analysis results suggest that the upward regulation of SOX11 is likely to play an important role in the development of NB.
However, in NB cytology functional experiments, our study differs from others. Studies have shown that overexpression of SOX11 can enhance the proliferation and migration ability of SK-N-BE(2)C cells, and can also save the proliferation and migration reduction of cells caused by LINC01296-KD, and promote apoptosis [9]. Similarly, in another study, in NGP, CLBGA cell lines, silencing SOX11 induced G0/G1 growth arrest and decreased proliferation, in MR-32 cells, silencing SOX11 inhibited cell proliferation and migration, and in SH-EP cells, overexpression of SOX11 enhanced the migration ability of NB cells [10]. Our results suggested that silencing SOX11 inhibited the migration ability of SK-N-SH, but did not affect the proliferation and invasion of NB. We speculate that this may be due to differences in cell lines that cause this result.
Although SOX11 has been reported in some cancers, its regulatory mechanism in NB still needs further study. Through KEGG enrichment analysis, SOX11-related genes were mainly enriched in the cell cycle, miRNAs in cancer, and the p53 signaling pathway. Key genetic factors for the development of NB included amplification of MYCN, deletion of TP53, mutation or amplification of ALK [20]. Curcumin promoted excessive production of reactive oxygen species and apoptosis in NB cells by activating p53 and Bcl-2 signaling pathways [21]. Another study showed that 3FB3FA8H increased mRNA levels of P53 leading to apoptosis in NB cells [22]. In addition, in the study of mantle cell lymphoma, SOX11 expression correlated with the mutation rate of TP53 [23]. Therefore, we speculate that SOX11 may influence the occurrence and development of NB through the P53 pathway. In addition, we predicted the downstream target gene of SOX11 and found that SOX11 has a binding peak in the DNA sequence of EZH2, and EZH2 was highly expressed in NB and positively correlated with the expression of SOX11. GO analysis results showed that EZH2 was involved in BPs such as regulation of cell development, regulation of neurogenesis, and regulation of nervous system development. EZH2 is a member of the polycomb-group (PcG) family and mediates repression of target genes by trimethylation of Lys 27 in histone 3 (H3K27me3) [24]. EZH2 was highly expressed in NB tissues and was associated with a poor prognosis. The reduction and inhibition of EZH2 successfully induced NTRK1 transcription, and EZH2-related NTRK1 transcription regulation may be a key pathway for NB cell differentiation [25]. EZH2 knockdown inhibited NB proliferation and tumor growth in vivo [26]. Depletion of EZH2 induced MYC(N) degradation and inhibited tumor cell growth in MYC(N)-driven NB and small cell lung cancer [27]. Studies have found that PRC2 regulated a large number of developmental genes in embryonic stem cells, such as the HOX gene cluster, SOX, PAX, and WNT gene families [28]. SOX11 is a member of the SOX TF family and is involved in the regulation of embryonic development. Therefore, we speculate that SOX11 may co-regulate the occurrence and development of NB with EZH2. However, this conjecture needs further experimental verification.
In summary, the findings of this study expanded the knowledge base in the field and provided a basis for further research. However, the limitations of this study should also be considered. First, the analysis between mRNA expression of SOX11 and clinicopathological parameters is limited in the TARGET database. At the same time, there is a lack of sufficient NB samples with SOX11 expression and more clinical follow-up and investigation of NB children are encouraged to better evaluate the expression of SOX11 in NB tissues and the significance of clinical parameters. Secondly, the exact mechanism of SOX11 and EZH2 in NB has not been experimentally confirmed, and further in vivo and in vitro experiments are needed to confirm this conclusion.
 XML Download