Abstract
Purpose
Methods
Results
Notes
Funding
This study received no specific grant from any funding agency in the public, commercial, or not-for-profit sectors.
References
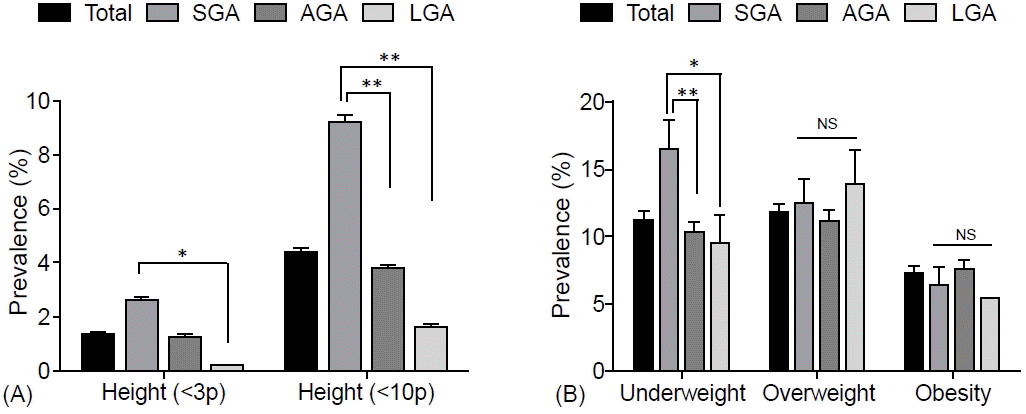
Fig. 1.

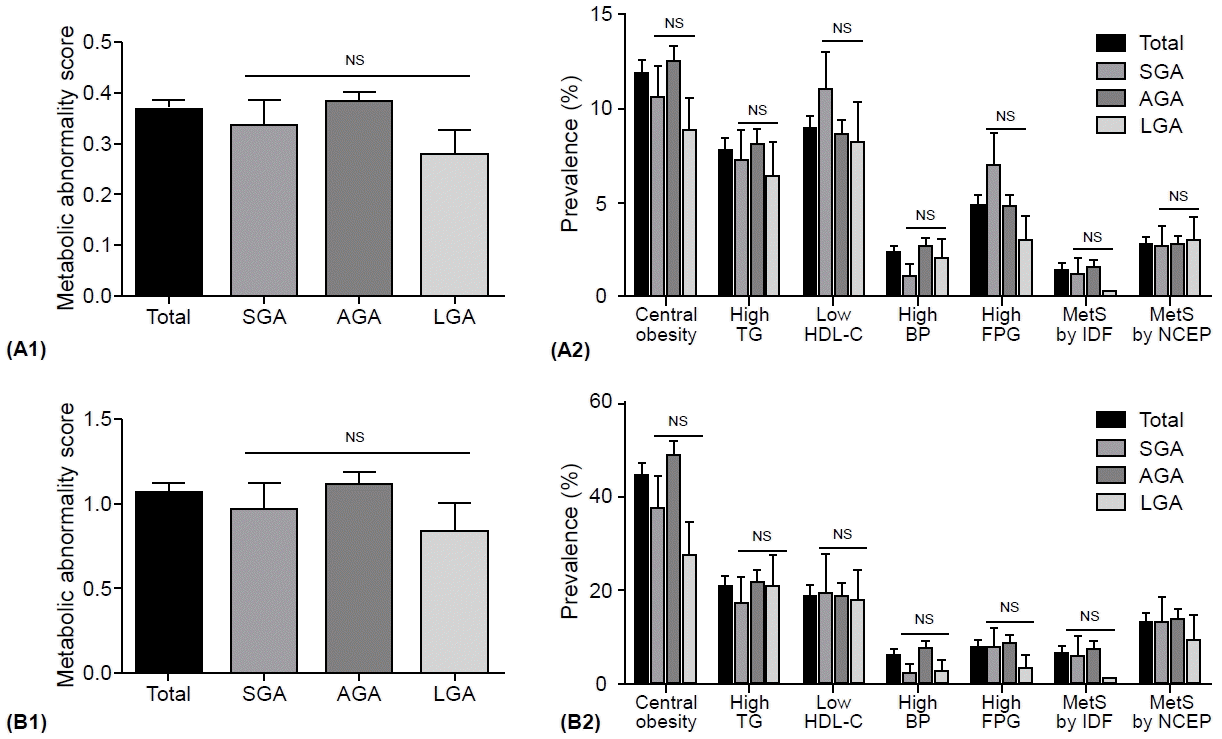
Fig. 2.

Table 1.
| Variable | SGA (N=272) | AGA (N=1,286) | LGA (N=190) | P-value* |
|---|---|---|---|---|
| Age (yr) | 13.8±2.6 | 13.6±2.5 | 13.8±2.5 | 0.333 |
| Male sex | 139 (50.9) | 700 (54.3) | 92 (48.4) | 0.230 |
| Height (cm) | 157.8±12.0a) | 159.6±11.7a) | 162.4±10.4b) | <0.001 |
| Weight (kg) | 50.5±13.7a) | 52.7±14.1b) | 55.8±13.9c) | <0.001 |
| BMI (kg/m2) | 20.0±3.7a) | 20.4±3.7a,b) | 20.9±3.5b) | 0.024 |
| WC (cm) | 67.4±10.0a) | 68.7±10.1a,b) | 70.0±9.1b) | 0.020 |
| SBP (mmHg) | 105.6±9.8 | 105.6±11.0 | 105.9±9.4 | 0.912 |
| DBP (mmHg) | 64.9±9.9 | 65.7±9.1 | 66.1±9.0 | 0.316 |
| TG (mg/dL) | 82.1±40.2 | 82.8±50.7 | 77.7±41.0 | 0.435 |
| TC (mg/dL) | 155.8±24.7 | 158.6±26.9 | 159.8±25.0 | 0.236 |
| HDL-C (mg/dL) | 53.6±9.7 | 54.3±10.6 | 55.7±11.2 | 0.138 |
| ALT (IU/L) | 13.9±10.2 | 15.4±15.8 | 14.0±10.1 | 0.248 |
| FPG (mg/dL) | 88.9±6.7 | 89.1±9.6 | 88.9±5.3 | 0.925 |
| Insulin (μIU/mL) | 13.4±5.6 | 14.0±6.8 | 13.4±5.6 | 0.546 |
| HOMA-IR | 3.0±1.4 | 3.1±1.5 | 3.0±1.3 | 0.701 |
| Birth history | ||||
| Birth weight (g) | 2644.3±265.3a) | 3278.3±318.7b) | 3927.1±534.8c) | <0.001 |
| Macrosomia | 0 (0)a | 6 (5.4)a) | 105 (94.6)b) | <0.001 |
| LBW | 40 (14.7)a) | 16 (1.2)b) | 6 (3.2)b) | <0.001 |
| VLBW | 2 (0.7) | 2 (0.2) | 1 (0.5) | 0.215 |
| GA (wk) | 39.5±1.3a) | 39.6±1.4a) | 39.0±2.9b) | <0.001 |
| Premature | 11 (4.0)a) | 36 (2.8)a) | 18 (9.5)b) | <0.001 |
| Postmature | 3 (1.1) | 43 (3.4) | 7 (3.7) | 0.125 |
| Maternal age (yr) | 27.7±4.1 | 28.2±4.1 | 28.4±4.0 | 0.078 |
| C/Sec | 95 (34.8) | 472 (36.6) | 77 (40.5) | 0.445 |
| Household income (1–4)† | 2.8±1.0 | 2.9±1.0 | 2.9±1.0 | 0.218 |
| Physical activity, none | 140 (51.3) | 684 (53.2) | 94 (49.7) | 0.602 |
| Current smoking | 12 (3.7) | 64 (5.0) | 16 (8.4) | 0.108 |
| Current alcohol‡ | 50 (24.2) | 184 (15.3) | 38 (25.7) | 0.211 |
| Calorie intake (kcal/day) | 2156.3±856.0 | 2176.1±860.2 | 2217.3±860.3 | 0.772 |
| Food intake | ||||
| Carbohydrate (g/day) | 331.9±128.0 | 336.6±124.0 | 340.9±129.8 | 0.785 |
| Protein (g/day) | 77.3±38.0 | 78.4±42.2 | 79.0±39.5 | 0.905 |
| Fat (g/day) | 58.2±37.9 | 57.3±36.5 | 59.0±38.5 | 0.815 |
Values are presented as mean±standard deviation or number (%).
SGA, small for gestational age; AGA, appropriate for gestational age; LGA, large for gestational age; BMI, body mass index; WC, weight circumference; SBP, systolic blood pressure; DBP, diastolic blood pressure; TG, triglyceride; TC, total cholesterol; HDL-C, high-density lipoprotein-cholesterol; ALT, alanine transaminase; FPG, fasting plasma glucose; HOMA-IR, homeostasis model of assessment–insulin resistance; LBW, low birth weight; VLBW, very low birth weight; GA, gestational age; C/sec, cesarean section.
Table 2.
The odds ratios of short stature and underweight in Korean children and adolescents according to birth weight at gestational age from multiple logistic regression analysis.
Model 1, nonadjusted; model 2, adjusted for age and sex; model 3, adjusted for age, sex, low birth weight, and prematurity; OR, odds ratio; CI, confident interval; SGA, small for gestational age; AGA, appropriate for gestational age; LGA, large for gestational age; BMI, body mass index.
Table 3.
| Variable |
Male (N=642) |
Female (N=550) |
||||||
|---|---|---|---|---|---|---|---|---|
| SGA (n=102) | AGA (n=473) | LGA (n=67) | P-value* | SGA (n=87) | AGA (n =401) | LGA (n=62) | P-value* | |
| Anthropometric parameter | ||||||||
| Age (yr) | 13.6±2.5 | 13.6±2.5 | 13.6±2.5 | 0.968 | 13.7±2.6 | 13.5±2.5 | 13.6±2.6 | 0.816 |
| Height (cm) | 161.4±14.2 | 161.9±13.1 | 164.1±13.3 | 0.406 | 154.5±7.3a) | 156.4±8.8a) | 159.5±7.0b) | 0.002 |
| Weight (kg) | 54.0±15.2 | 55.2±15.6 | 56.1±13.6 | 0.678 | 46.6±10.1a) | 49.7±11.5a,b) | 52.2±11.4b) | 0.010 |
| BMI (kg/m2) | 20.4±3.8 | 20.7±3.9 | 20.5±3.0 | 0.758 | 19.4±3.3 | 20.1±3.5 | 20.4±3.7 | 0.144 |
| Body composition | ||||||||
| Lean mass (kg) | 40.6±10.9 | 41.1±11.1 | 41.9±10.7 | 0.749 | 31.6±5.3 | 33.2±6.3 | 34.5±5.2 | 0.014 |
| Lean mass ratio† (%) | 75.6±8.1 | 75.2±8.3 | 74.7±6.4 | 0.757 | 68.8±5.9 | 67.6±5.5 | 67.2±7.0 | 0.185 |
| LMI (kg/m2) | 15.2±2.2 | 15.4±2.2 | 15.3±2.1 | 0.867 | 13.2±1.5 | 13.5±1.6 | 13.5±1.4 | 0.280 |
| Fat mass (kg) | 13.1±6.7 | 13.6±7.1 | 13.7±5.0 | 0.783 | 14.6±5.4a) | 16.1±5.9a,b) | 17.4±7.1b) | 0.016 |
| Fat mass ratio‡ (%) | 23.7±8.4 | 24.1±8.4 | 24.5±6.7 | 0.832 | 30.4±5.8 | 31.6±5.5 | 32.4±7.1 | 0.098 |
| FMI (kg/m2) | 5.0±2.4 | 5.2±2.6 | 5.1±1.9 | 0.836 | 6.0±2.1 | 6.5±2.1 | 6.8±2.6 | 0.095 |
| Truncal fat (kg) | 5.6±3.6 | 5.8±3.7 | 5.7±2.6 | 0.830 | 6.0±2.7a) | 6.8±3.3a,b) | 7.4±3.7b) | 0.036 |
| Truncal fat ratio§ (%) | 40.9±5.4 | 41.0±5.5 | 40.3±4.9 | 0.603 | 40.2±4.6 | 41.0±5.0 | 41.1±5.2 | 0.365 |
| BMCWB (kg) | 1.8±0.5 | 1.9±0.6 | 1.9±0.6 | 0.672 | 1.6±0.4 | 1.7±0.4 | 1.8±0.3 | 0.076 |
| Bone mineral density | ||||||||
| LS z-score | 0.01±1.11 | -0.56±1.02 | 0.01±0.95 | 0.778 | -0.22±1.02 | -0.01±1.05 | 0.09±0.88 | 0.177 |
| FN z-score | -0.13±0.96 | -0.05±1.04 | -0.01±0.84 | 0.722 | -0.20±0.96 | -0.02±1.02 | 0.07±0.92 | 0.226 |
| WB z-score | -0.10±0.98 | -0.01±0.94 | 0.02±0.83 | 0.612 | -0.18±0.93 | 0.00±0.93 | 0.08±0.77 | 0.162 |
Values are presented as mean±standard deviation.
Comparison of body composition and bone density in Korean children and adolescents according to birth weight at gestational age SGA, small for gestational age; AGA, appropriate for gestational age; LGA, large for gestational age; BMI, body mass index; LMI, lean body mass index; FMI, fat mass index, BMCWB, whole-body bone mass; LS, total lumbar spine; FN femur neck; WB, whole-body bone.


 PDF
PDF Citation
 Print
Print


 XML Download