

 PDF
PDF Citation
 Print
Print


INTRODUCTION
Korea’s suicide rate has consistently ranked first or second among Organization for Economic Cooperation and Development countries since the 2000s.12 However, prior to this period, suicide was not as prevalent in Korea. The annual suicide rate in Korea stayed relatively low, hovering around 10 per 100,000, for about a decade after official statistics were initiated in 1985.3 After the 1997 Asian financial crisis, the suicide rate in Korea surpassed 20 per 100,000, reaching 30 per 100,000 in 2004. It peaked at approximately 36 per 100,000 in 2009 following the global financial crisis caused by the subprime mortgage crisis.4 Since then, the suicide rate has gradually declined, hovering around 25 per 100,000 since 2015.5 This suggests significant fluctuations in Korea’s annual suicide rate over the past few decades.
Compared to many other countries, the suicide trends in Korea between the 1980s and 2000s seem to deviate from typical patterns.2 In Western countries, suicide rates have generally remained stable or experienced modest declines since the 1960s, typically staying below 15 per 100,000.6 Japan, often compared to Korea, maintained a suicide rate above 20 per 100,000 for much of the period from the 1960s to the 2000s, except for the 1990s.7 After falling below 20 per 100,000 in the early 2010s, Japan’s suicide rate has continued to decrease, reaching around 15 per 100,000 in recent years.8 These statistics suggest that in socio-economically stable countries, suicide rates typically remain constant or experience gradual declines.9 In contrast, Korea’s suicide trend has been characterized by significant volatility, marked by sharp increases and decreases within a relatively short span of time.
The reasons behind these significant fluctuations in Korean suicide trends remain unclear. Some explanations point to rapid social, cultural, and economic changes, such as the erosion of traditional family values and financial crises in Korea.10 Additionally, it should be considered that incomplete death registration and ascertainment procedures in the past may contribute to the volatile nature of suicide trends.1112 Researchers have suggested that prior to the 2000s, many suicides may have been incorrectly classified as accidental or undetermined deaths in Korea, and later improvements in the misclassification of suicides may have contributed to the surge in suicide rates during that period.13 Therefore, to better understand the past fluctuations in suicide trends in Korea and its related factors, it is necessary to first identify the structural change-points at which suicide rates suddenly began to increase or decrease, and then to examine the historical context of the death statistics system, as well as the social, cultural, and economic environments.
The purpose of this study is to analyze structural changes in the time series of suicide rates, aiming to comprehend the dramatic fluctuations in Korea’s suicide rate from the 1990s to the 2010s. This study employed a change-point detection method to identify pivotal points in the time series of suicides, as well as accidental and ill-defined deaths. Change-point analysis is a statistical technique that identifies significant shifts in the underlying trend or structure of time series data.14 These change-points could be linked to various factors, including policy changes, natural disasters, or alterations in data collection methods. We hypothesized that changes in the relevant socio-economic environment or the death registration system would coincide with the sudden changes in suicide rates. Additionally, interrupted time series analyses were conducted to assess the change in suicide trends before and after these change-points, offering insights into estimating the actual prevalence of suicide in Korea in the past.
METHODS
Data sources and study population
In this study, data on the sex, age, date of death, and cause of death were obtained from Statistics Korea’s Microdata Integrated Service, covering a total of 6,573,370 deaths that occurred between 1997 and 2021.15 Out of the 103 (104 in 2021) causes of death categories classified by Statistics Korea, this study focused on intentional self-harm (suicide), six categories of external causes of mortality (accidental deaths), and symptoms, signs, and abnormal clinical and laboratory findings not elsewhere classified (ill-defined deaths).
Specifically, the codes assigned to suicide were X60–X84 in accordance with the International Statistical Classification of Diseases and Related Health Problems, 10th Revision (ICD-10).16 The categories of accidental deaths included deaths due to transport accidents (V01–V99), falls (W00–W19), accidental drowning and submersion (W65–W74), exposure to smoke, fire, and flames (X00–X09), accidental poisoning by and exposure to noxious substances (X40–X49), and all other external causes (W20–W64, W75–W99, X10–X39, X50–X59, and Y10–Y89). The category of other external causes included events of undetermined intent (Y10–Y34). Ill-defined deaths included cases coded R00–R99 in ICD-10. The specific ICD codes Y10–Y34 and R00–R99 are recognized as indicators of potentially poor-quality coding in the death registration system.17 Their inappropriate overuse could compromise the quality and utility of cause of death information. In total, this study analyzed 1,477,792 deaths, which included 296,985 suicides, 190,697 deaths from transport accidents, 66,475 deaths resulting from falls, 21,600 deaths due to drowning, 10,018 deaths due to fire-related incidents, 8,880 deaths due to poisoning, 136,968 deaths attributed to other external causes, and 746,169 ill-defined deaths.
Additionally, population data, segmented into 5-year age groups (0–4, 5–9, … 75–79, 80+) for each year between 1997 and 2021, and the total population for mid-2005 (used as the standard population), were obtained from the Korean Statistical Information Service.18 These population figures were utilized to calculate age-adjusted death rates.
Statistical analysis
Suicide, accidental death, and ill-defined death rates per month from 1997 to 2021 were age-adjusted to the mid-2005 population as a standard population. First, age-specific death rates per month were computed by dividing the number of deaths in each 5-year age group for each month by the population of that age group in the middle of the corresponding year. Subsequently, the expected number of deaths in each age group for each month was calculated by multiplying the age-specific death rate for that age group by the population of that age group in mid-2005. Following that, the total expected number of deaths for each month was obtained by summing the expected number of deaths across all age groups. Finally, age-adjusted death rates were determined by dividing the total expected number of deaths for each month by the mid-2005 population and multiplying by 100,000 to express the rate per 100,000.
Before conducting the change-point and interrupted time series analyses, the overall trends in suicides, accidental deaths, and ill-defined deaths were modeled. Taking into consideration their non-linear nature, we utilized a locally estimated scatterplot smoothing smoother.
To detect structural changes in the age-adjusted death rates of suicide, accidental deaths, and ill-defined deaths between 1997 and 2021, the ‘strucchange’ package in R was utilized.19 The ‘breakpoints’ function was applied to estimate the number and location of change-points. This method identifies all potential change-points in the time series data by comparing the sum of squared residuals of a model fit to data before and after each potential change-point. It is known for its ability to detect multiple change-points in both linear and highly non-linear regressions.20 An optimal number of change-points was selected by comparing Bayesian Information Criterion (BIC) values for different numbers of change-points, with the model having the lowest BIC value considered optimal. Confidence intervals for the change-points were estimated and plotted along with the death rates.
Interrupted time series analyses were carried out to assess the changes in the level and slope of death rates before and after the change-points.21 Quasi-Poisson regression models were fitted, using the following equation:
Here, Y represents the suicide rate, Time is a continuous variable indicating the time elapsed from the start of the observation period, Change-point is a dummy variable indicating whether observations were collected before (= 0) or after (= 1) the change-point, and Time since change-point is a continuous variable indicating the time elapsed since the change-point occurred (before the change-point occurred, Time since change-point is equal to 0).
Statistical significance was determined with P < 0.05. All statistical analyses were conducted using R (version 4.1.0; R Foundation for Statistical Computing, Vienna, Austria).
RESULTS
Fig. 1 depicts the age-adjusted suicide rates per month along with its smooth trend, change-points, and segmented regression models. The suicide trend in Korea has shown a rapid rise since 1997, peaking around 2010 before experiencing a decline and plateauing around 2021 (Fig. 1). The optimal number of change-points for suicide rates was three, identified in February 2003, September 2008, and June 2012. Interrupted time series analysis revealed statistically significant level changes at these points, with no significant differences observed in slope changes before and after (Table 1). The segmented regressions show that the suicide rates in Korea had been cascading up until mid-2012, with level jumps in the 2003 and 2008 change-points (Fig. 1). However, the slope of the suicide rate was a very modest increase between 1997 and 2003, and even downward between 2003 and 2008, and between 2008 and 2012 (Table 1). After a level drop at the 2012 change-point, the decline in suicide rates between 2012 and 2021 exhibited a more moderate slope compared to the previous period.
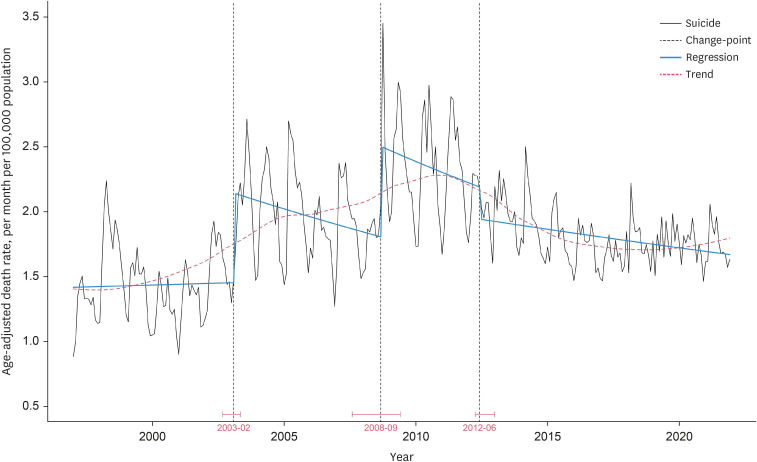

Fig. 1
Change-points and interrupted time series analysis of suicide rate (per month per 100,000 population) in Korea. The blue line represents the segmented regression models. In the quasi-Poisson regression model, the following equation was employed to assess the suicide rate (Y): Y = b0 + b1 × Time + b2 × Change-point + b3 × Time since change-point + e. The red dashed line indicates the trend line estimated by a locally estimated scatterplot smoothing.
![]()
Table 1
Interrupted time series analyses of suicide rate changes before and after change-points in Korea
In the quasi-Poisson regression models, the following equation was employed to assess the suicide rate (Y): Y = b0 + b1 × Time + b2 × Change-point + b3 × Time since change-point + e. The time coefficient indicates the slope before the change-point. The ‘Change-point’ coefficient indicates the level jump or drop immediately after the change-point. The ‘Time’ since change-point coefficient indicates a change in slope after the occurrence of the change-point.
SE = standard error.
![]()
Fig. 2 presents the age-adjusted rates of accidental deaths. While most accidental death rates showed a gradual and steady decline over time, death rates due to falls and other external causes initially increased and then declined (Fig. 2). Change-point analyses identified two change-points for death rates due to drowning (August 2001 and August 2008), fire (May 2003 and April 2008), and poisoning (September 2000 and December 2006), as well as three change-points for death rates due to transport accidents (December 2000, December 2004, and December 2012) (Fig. 2). Moreover, there were more than four change-points for death rates due to falls (September 2000, July 2004, April 2008, and November 2013) and other external causes (September 2000, June 2004, April 2010, January 2014, and January 2018) (Fig. 2). The results of the interrupted time series analyses of accidental death rates are provided in Supplementary Tables 1, 2, 3, 4, 5, 6.
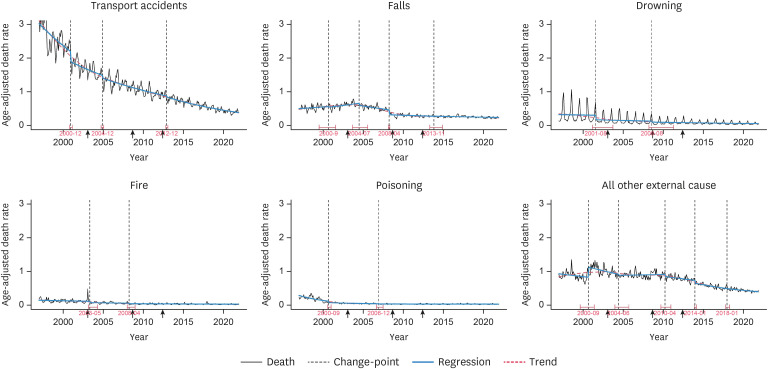
Fig. 2
Change-points and interrupted time series analyses of accidental death rates (per month per 100,000 population) in Korea. The blue line represents the segmented regression models. In the quasi-Poisson regression models, the following equation was employed to assess the accidental death rates (Y): Y = b0 + b1 × Time + b2 × Change-point + b3 × Time since change-point + e. The red dashed line represents the trend line estimated by a locally estimated scatterplot smoothing. The arrows on the x-axis indicate the timing of the change-points in the suicide rate.
![]()
Fig. 3 displays the age-adjusted rates of ill-defined deaths. The ill-defined death rate exhibited a consistent downward trend, characterized by notably steep declines observed between 1997–2000 and 2007–2011 (Fig. 3). This rate revealed three change-points in December 2000, January 2007, and March 2011 (Fig. 3), with significant drops in levels observed in 2000 and 2007. The results of the interrupted time series analyses of the ill-defined death rate are presented in Supplementary Table 7.
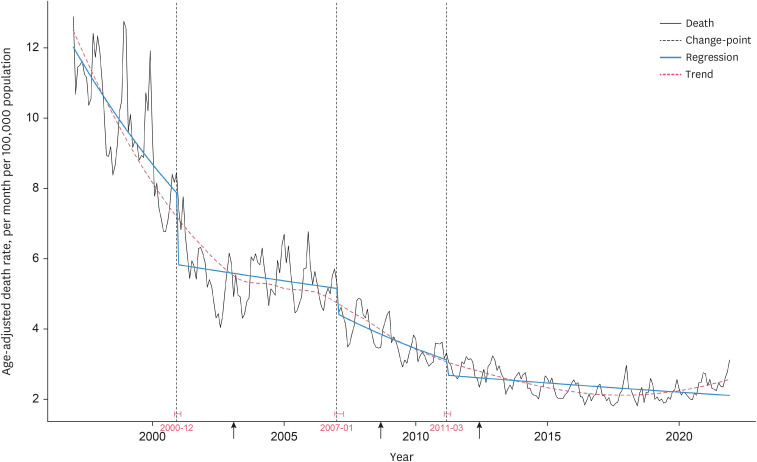
Fig. 3
Change-points and interrupted time-series analysis of ill-defined death rate (per month per 100,000 population) in Korea. The blue line represents the segmented regression models. In the quasi-Poisson regression models, the following equation was employed to assess the ill-defined death rate (Y): Y = b0 + b1 × Time + b2 × Change-point + b3 × Time since change-point + e. The red dashed line represents the trend line estimated by a locally estimated scatterplot smoothing. The arrows on the x-axis indicate the timing of the change-points in the suicide rate.
![]()
DISCUSSION
This study aimed to elucidate the fluctuations in Korea’s suicide trends over the past decades. Change-point analysis was employed to investigate structural changes in time series data on suicides, accidental deaths, and ill-defined deaths from 1997 to 2021. The results revealed three change-points in Korea’s suicide rates, which occurred in February 2003, September 2008, and June 2012. The interrupted time series analysis indicated that between 2003 and 2012, suicide trends exhibited a stair-step pattern, characterized by a significant increase in levels followed by a decline in slope. Several change-points were also identified in accidental and ill-defined death rates in the early to mid-2000s. These findings demonstrate that there were significant shifts in the trends of suicide and other external causes of death in Korea during the 2000s.
A change-point, representing an abrupt shift in level or slope within time series data, signifies a transition that could be linked to alterations in government policies, economic conditions, or data collection methods.1422 Change-point analysis can explore temporal coincidences between change-points in time series data and related events, although establishing causality is difficult. Thus, change-point analyses have been utilized in suicide studies to investigate factors influencing fluctuations in suicide trends. For instance, Myung et al.23 examined the impact of paraquat prohibition in November 2011 on suicides in Korea, identifying a change-point in March 2012 and a subsequent 10.0% decline in the suicide rate. Gusmao et al.24 explored structural shifts in suicide and other external causes of death in Portugal over 106 years, identifying change-points potentially linked to changes in death registration procedures or methodologies. In this regard, we hypothesized that the marked fluctuations in Korea’s suicide trend might have been accompanied by multiple change-points, and expected that identifying coincidental shifts in socio-economic conditions, suicide prevention policies, and the classification of the manner of death would provide clues as to why suicide trends have changed so dramatically.
We observed that two change-points occurred in 2003 and 2008, during which the suicide rates steadily increased, and another in 2012 when the rates declined after peaking in 2009. The interrupted time series analysis revealed that the rise in suicide rates in the 2000s was largely attributed to two level-to-level jumps at the 2003 and 2008 change-points, rather than a gradual increase. Conversely, within the 2003–2008 and 2008–2012 periods, suicide rates seemed to decrease with a downward slope. The surge in suicide rates in Korea from the 1990s to the 2000s has been largely attributed to the socio-economic shifts during that period, including rapid economic growth followed by financial crises.252627 However, the stair-step trend we observed in this study is unlikely to be solely a result of natural increases in suicides due to socio-economic factors.28 Therefore, it is worth investigating whether past systemic changes in the classification of the manner of death could have contributed to these sharp changes in suicide rates. In addition, most accidental death rates in the 2000s declined, suggesting that the Korean government’s efforts to reduce deaths from traffic and industrial accidents have resulted in a safer society. The ill-defined death rate also displayed sharp declines with notable level drops in the early and late 2000s, largely attributed to improvements in the quality of coding in death ascertainment procedures.
Given the inaccuracies in death ascertainment procedures in Korea’s past, it is likely that Korean suicide statistics were less reliable and undercounted before the 2000s.2930 Official death statistics in Korea primarily relied on cause of death data from death notification cards filled out by the deceased’s family members and death certificates issued by hospital physicians.31 However, due to a low proportion of deaths certified by clinical diagnosis or autopsy and possible false reporting by family members, many suicide cases in Korea may have been registered as other causes of death in the past.1232 Cultural factors such as Confucian values, familyism, and collectivism in Korea may contribute to fear of stigma and shame attached to suicides and their family members.1133 There is also a legal issue of denying life insurance claims to suicides, which makes it difficult for family members to accept that the cause of death was suicide.34 In the socio-cultural context of suicide, family members or physicians may be reluctant to record the cause of death as suicide on the death notification card or certificate form.11 This is supported by a study by Im et al.,12 which showed that about 40% of all suicide deaths in Korea between 2004 and 2006 were initially compiled on death notification cards as a cause of death other than suicide and were later corrected to show suicide as the cause. Acknowledging the unreliability of cause of death information, the Korean government has been improving death ascertainment procedures since the 2000s by increasing the percentage of medically certified deaths, revising the death certificate form multiple times, and cross-checking data from Statistics Korea and the Korean National Police Agency.1135 These changes in the classification of the manner of death in Korea may have played a role in the shifts observed in suicide rates, as well as accidental and ill-defined death rates during the 2000s. A study by Chan et al.13 examining the proportional change of suicide, undetermined death, and accidental death in Hong Kong, Japan, and Korea in the 1990s–2000s found that the increasing burden of suicide in Korea was initially masked by misclassification during the mid-1990s and beyond. This study suggested that the later apparent rapid increase in suicides in Korea was a result of both improving suicide classification and a fundamental increase in the suicide rate.
The level jumps in official suicide rates at the 2003 and 2008 change-points can be largely attributed to enhanced accuracy in the classification of suicides. Since 2003, official suicide statistics in Korea have been improved by cross-checking data from Statistics Korea and the Korean National Police Agency.11 This process has significantly reduced the annual discrepancy in reported suicides from about 4,000–5,000 to around 2,000 between the two agencies, aligning Statistics Korea’s figures more closely with those of the police.11 Interestingly, the increase in the official number of suicides after the double-checking was roughly similar to the increase observed after the 2003 change-point in this study (average number of suicides per year of 11,390 (average suicide rate per month of 1.97) in the 2003–2008 period – average number of suicides per year of 8,123 ([average suicide rate per month of 1.44] in the 1997–2003 period = 3,267 suicides per year). On the other hand, in the fall of 2008, two major events occurred in Korea that could have influenced suicide rates: the global financial crisis following the bankruptcy of Lehman Brothers in September, and the suicide of a high-profile celebrity in October. However, the socio-economic impact of the 2008 financial crisis seemed less severe than that of the 1997 Asian financial crisis.36 Also, according to studies of copycat suicides in Korea, the effects of the celebrity suicide lasted only a few months.3738 In this context, we assume that the 2008 change-point was also largely due to improvements in the classification of suicides. The revision of the death certificate form in early 2009, which incorporated a determination of intentionality in the case of external causes of deaths, could have significantly influenced the suicide trend in the years following the 2008 change-point.35 Our estimation suggests that the number of suicides increased by an average of about 2,500 per year in the 2008–2012 period (average suicide rate per month of 2.34), compared to the 2003–2008 period (average suicide rate per month of 1.97). Further analysis is needed to determine the extent to which clarifying intentionality in the death ascertainment procedures has actually influenced changes in suicide trends. In addition, the accidental and ill-defined death rates dropped sharply through change-points around the same time as the suicide change-points in the early to mid-2000s, leading to the assumption that some of these reduced deaths were classified as suicides, leading to the spike in the suicide rate at that time. Collectively, these findings suggest that much of the rapid increase in official suicide rates in Korea in the 2000s might be attributable to improvements in death ascertainment processes and suicide classification.
In contrast to the spikes in suicide rates at the 2003 and 2008 change-points, within the 2003–2008 and 2008–2012 periods, suicide rates declined with a downward slope. A series of sudden level jumps followed by a decreasing slope does not seem like a natural progression in a time series of suicide rates. One possibility is that the number of suicides increased by almost 300 per month immediately after a very powerful socio-economic crisis and then tapered off over the subsequent several years. Another possibility is that, as discussed above, improvements in the classification of the manner of death led to official suicide statistics more closely representing the actual suicides, resulting in level jumps at both change-points, but the actual suicide rates had already been declining before then, resulting in downward slopes within the 2003–2008 and 2008–2012 periods. We found the latter assumption more plausible, as it seemed unlikely that social or economic events alone could sustain such high suicide rates for years beyond a temporary rise.363738 In particular, this suggests that the peak of Korea’s suicide rates actually occurred in the early 2000s or even earlier. The official rates of 10–15 per 100,000 in the 1980s and 1990s may have substantially underestimated the actual prevalence of suicides. The overall development of the Korean social system, as evidenced by the significant decline in deaths from transport accidents and homicides since 2000, alongside the Korean government's suicide prevention policies implemented since 2004, may have played a role in gradually reducing or containing suicide rates in the early 2000s.39
The sharp drop in the suicide rates at the 2012 change-point may be attributed to the Korean government banning the production of paraquat in late 2011 as a suicide prevention measure.40 Paraquat, a highly lethal herbicide, was the most frequent means of suicide in rural areas at that time, accounting for 35.5% of all pesticide-related deaths in Korea.41 Our finding is consistent with a study by Myung et al.,23 which identified a change-point in Korea’s suicide trends in early 2012 and linked the decrease in suicides to the paraquat ban. Cha et al.40 also estimated that there were about 850 to 1,000 fewer pesticide-induced suicides in 2013 than before the paraquat ban, which is broadly in line with our finding of a level drop in the suicide rate from 2.19 to 1.94 at the 2012 change-point, equivalent to about 120 fewer suicides per month.40 These support that blocking potentially lethal methods of accidental suicide attempts may be quite effective in reducing suicide rates. However, since 2012, the decline in suicide rates appears to have been more modest than the slopes observed between 2003 and 2008 and between 2008 and 2012. This suggests that the decline in the suicide trend may have slowed down in more recent years. In fact, annual suicide rates have remained around 25 per 100,000 from the mid-2010s to the early-2020s, showing little decline.4243 In addition to the ban on paraquat, this recent slowdown in the downward trend of suicides, despite the Korean government’s ongoing efforts, warrants further examination.44
The results of this study support the view that suicides in Korea may have been undercounted in the past and that improving the misclassification of suicides may have revealed a hidden proportion of suicides. Furthermore, it could be hypothesized that actual suicide rates prior to the 2000s may have been as high as recent rates of about 25 per 100,000, suggesting that Korea may have actually been in a chronic state of high suicide rate, similar to Japan in the past. Several studies have raised concerns about misclassification of suicides in statistics across many countries, with underreporting rates estimated to be around 10–20%, even in Western countries.454647 However, the limited research on the reliability of suicide statistics in Korea makes it challenging to quantify the extent of underreporting. Underreporting of suicides undermines the reliability of statistics, obscures public and government awareness of the pervasiveness of suicide, and hinders the development, implementation, and evaluation of effective prevention policies.48 Therefore, accurate suicide statistics are crucial for a better understanding of suicides in Korea, predicting future trends, and developing more effective prevention policies. In addition, more fundamental measures beyond risk factor detection and management should be required, including cultural and educational policies to shift societal values about life and death, along with research from a socio-cultural perspective to better understand suicide in Korea.
This study had some limitations. First, only one algorithm, ‘breakpoints,’ was used to detect change-points. The change-points identified in this study are not absolute, and different algorithms may yield different results. However, ‘breakpoints’ is more reliable in detecting change-points in linear and non-linear data compared to other algorithms.20 Using multiple algorithms can complicate the interpretation of results in long-term time series. Second, this study used suicide and death statistics from 1997 onwards, which are publicly available from Statistics Korea, so it was not possible to analyze monthly suicide and death trends prior to 1997.15 Notably, the Asian financial crisis, which would have had a major impact on suicide trends in Korea, occurred in 1997. The annual suicide rate in Korea officially remained at a low level of around 10 per 100,000 until the 1980s and mid-1990s.3 Therefore, further research is needed to analyze fluctuations in suicide trends in Korea, including data from the 1980–1990s. Third, this study was not able to analyze deaths due to events of undetermined intent (Y10–Y34), which are lumped together with other external causes in accidental deaths in Statistics Korea’s cause of death classification.15 As undetermined deaths are a potential source of suicide misclassification, examining them is crucial to understanding changes in suicide trends resulting from improvements in suicide classification. Fourth, change-point analysis and interrupted time series analysis were used to explore possible events that may have influenced the change in suicide trends around the change-points, but the causal relationship between the changes in suicide rates and these factors could not be verified. Moreover, this study did not explore the interactive effects of socio-economic factors and improvements in suicide classification on the fluctuation of suicide trends in Korea. Therefore, further research is needed to provide comprehensive insights into Korea’s suicide trends by analyzing the causal relationships between related factors.
In conclusion, this study shows that Korea's suicide trends have not followed a gradual pattern but have been marked by abrupt changes over short periods. The spikes observed in suicide rates in 2003 and 2008 were likely a result of changes in the death statistics system, specifically improvements in the classification of suicides. These findings also suggest that actual suicide rates in Korea in the 2000s and earlier may have been significantly higher than the official rate, potentially declining since the 2000s, contrary to official figures. Rapid fluctuations in a country’s suicide trends may be attributed to changes in the death statistics system, socio-economic conditions, or the implementation of suicide prevention policies. Therefore, in order to better understand a country’s suicide trends, it is necessary to first examine its death registration system, as well as the historical context of the society, economy, and culture.
 XML Download