

 PDF
PDF Citation
 Print
Print


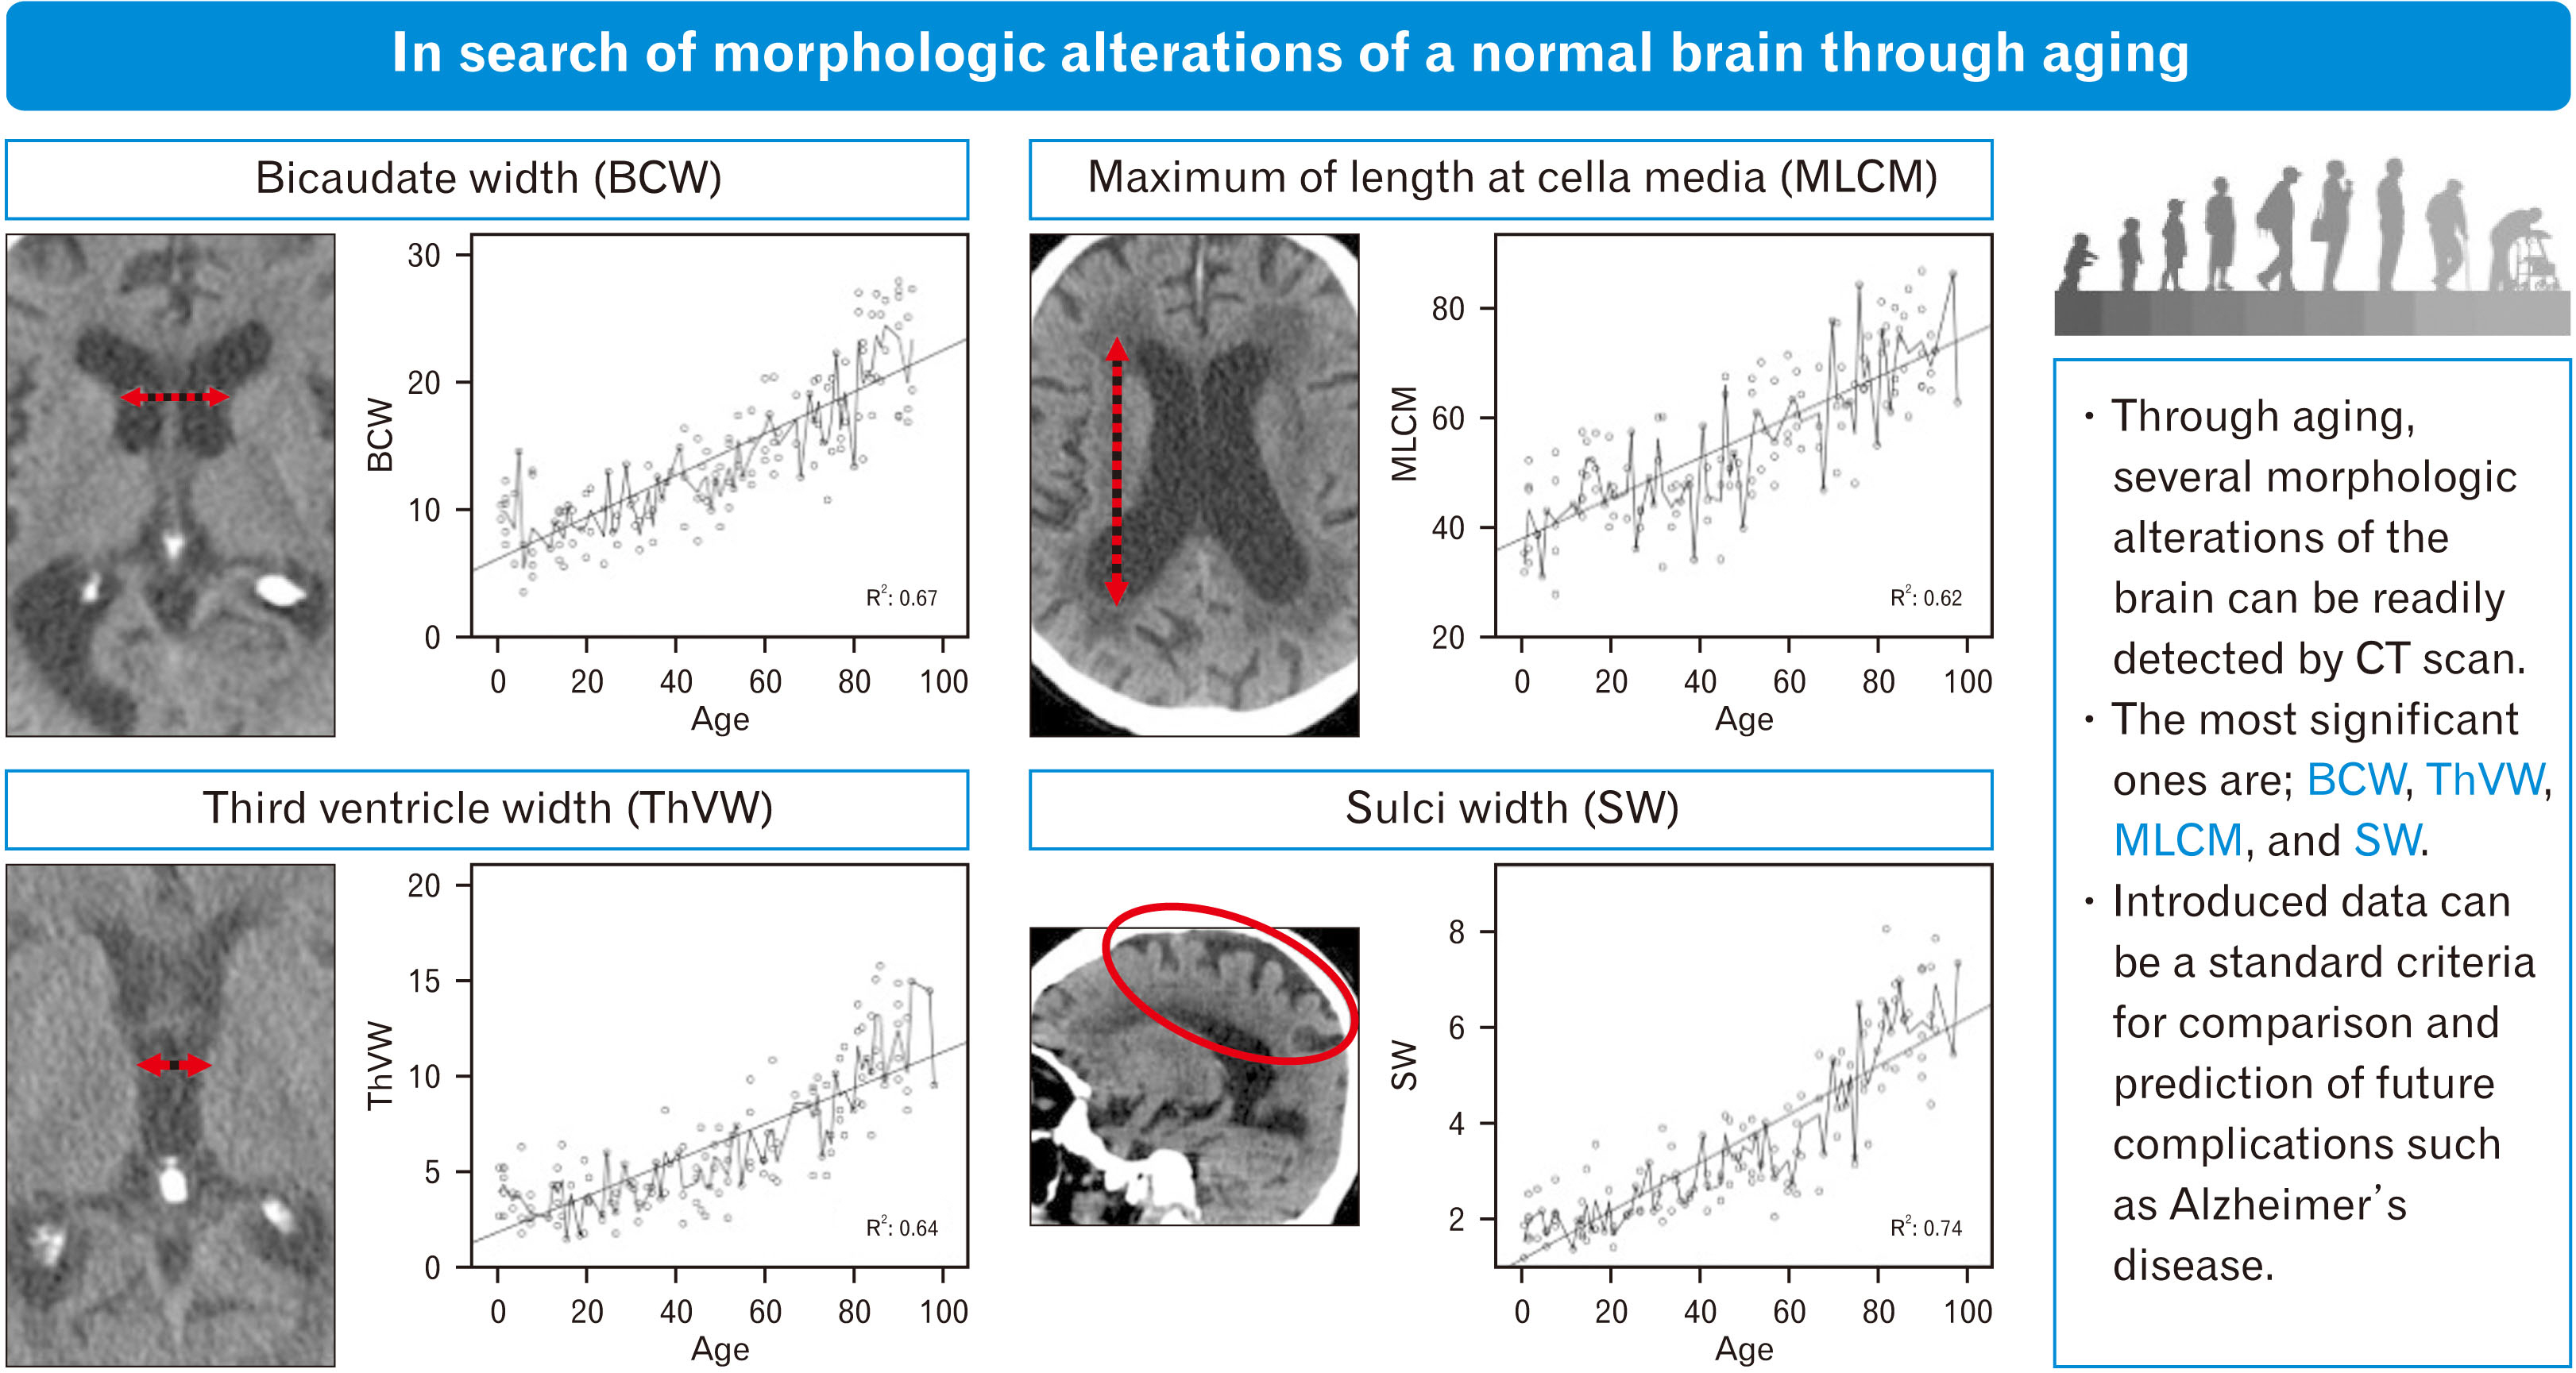
Introduction
Materials and Methods
Participants and computed tomography
Subcortical atrophy
 | Fig. 1Ventricular parameters. A1, maximum width of frontal horns; A2, maximum inner diameter of cranium; A3, maximum inner diameter of cranium at the level of A1; B1, minimum bicaudate width at the level of A1; B2, maximum inner diameter of cranium at the level of B1; C1, bioccipital width of occipital horns of lateral ventricles; C2, maximum inner diameter of cranium at the level of C1; D1, maximum width of third ventricle; D2, maximum inner diameter of cranium at the level of D1; E1, bitemporal width of temporal horns of lateral ventricles; E2, maximum inner diameter of cranium at the level of E1; F1, maximum width of lateral ventricles at the level of cella media; F2, maximum inner diameter of cranium at the level of F1; G1, maximum length of lateral ventricles at the level of cella media; G2, maximum inner diameter of cranium at the level of G1; H, width of neural tissue between lateral ventricles at cella media. *Third ventricle, ***temporal horn of left lateral ventricle.
|
Symmetry of frontal horns of lateral ventricles
Cortical atrophy
Statistical analysis
Results
Demographic data
Table 1
![]()
Major ventricular parameters
 | Fig. 4Distribution of three significant major ventricular parameter with age. (A) Total bicaudate width distribution with age (R2=0.67), (B) bicaudate width distribution within age groups (*vs. 1–9 yr [P≤0.05]), (C) computed tomography (CT) images showing bicaudate width through aging (double head dashed arrow shows bicaudate width in an 85 year old male). (D) Total third ventricle width distribution with age (R2=0.64), (E) third ventricle width distribution within age groups (*vs. 1–9 yr, 10–19 yr, and 20–29 yr; #vs. 30–39 yr, 40–49 yr, and 50–59 yr; @vs. 60–69 yr and 70–79 yr [P≤0.05]), (F) CT images showing third ventricle width through aging (double head dashed arrow shows third ventricle width in a 92 year old male). (G) Total maximum length of lateral ventricle at cella media distribution with age (R2=0.62), (H) maximum length of lateral ventricle at cella media distribution within age groups (*vs. 1–9 yr, #vs. 10–19 yr, 20–29 yr, 30–39 yr, and 40–49 yr [P≤0.05]), (I) CT images showing maximum length of lateral ventricle at cella media through aging (double head dashed arrow shows maximum length of lateral ventricle at cella media in a 92 year old male). Left column diagrams demonstrate linear interpolation and line of best fit from linear regression. Right column diagrams demonstrate male, female, and mean distribution within age groups (data are shown as mean±SD).
|
Table 2
| Group | Variable | ||||||||||||||||
|---|---|---|---|---|---|---|---|---|---|---|---|---|---|---|---|---|---|
| A1 | A2 | A3 | B1 | B2 | C1 | C2 | D1 | D2 | E1 | E2 | F1 | F2 | G1 | G2 | H | J | |
| 1–9 yr, M | 25.85±7.14 | 128.06±4.57 | 110.44±7.00 | 11.36±2.08 | 115.44±5.47 | 57.90±5.11 | 122.39±5.90 | 4.14±1.38 | 120.51±5.78 | 62.23±5.03 | 116.76±7.85 | 30.76±2.62 | 125.07±4.33 | 39.66±6.88 | 144.81±9.89 | 2.61±0.83 | 2.59±0.80 |
| 1–9 yr, F | 22.54±8.18 | 125.52±5.38 | 106.32±5.96 | 6.33±1.85 | 94.77±37.68 | 59.17±4.31 | 120.58±5.16 | 3.01±0.71 | 117.12±7.71 | 60.54±3.66 | 115.49±6.95 | 29.10±3.65 | 124.10±4.56 | 40.65±9.10 | 141.25±10.57 | 2.21±0.73 | 2.58±0.84 |
| 10–19 yr, M | 28.10±7.85 | 131.46±3.52 | 112.98±5.03 | 8.48±1.73 | 115.22±5.84 | 61.11±4.56 | 126.42±4.96 | 2.92±1.21 | 121.78±4.58 | 63.82±5.74 | 122.84±6.61 | 31±3.95 | 125.04±4.33 | 48.87±5.76 | 153.69±6.42 | 2.54±0.98 | 3.46±1.06 |
| 10–19 yr, F | 30.50±3.12 | 127.75±4.46 | 104.83±3.64 | 8.21±1.61 | 111.28±3.88 | 58.06±5.29 | 122.32±6.44 | 4.30±0.56 | 119.47±3.08 | 62.46±5.00 | 116.48±5.43 | 26.01±4.01 | 123.88±3.61 | 48.95±5.07 | 151.07±5.02 | 2.26±0.50 | 3.18±0.85 |
| 20–29 yr, M | 33.33±3.05 | 130.50±5.07 | 113.38±7.26 | 11.02±2.57 | 120.10±7.80 | 62.63±4.22 | 127.30±6.73 | 4±1.11 | 124.82±8.72 | 68.13±9.63 | 124.7±11.41 | 24.70±3.75 | 125.92±3.76 | 47.23±5.94 | 155.45±2.86 | 3.16±1.10 | 3.60±1.18 |
| 20–29 yr, F | 29.97±4.70 | 125.21±4.13 | 103.34±3.05 | 8.58±2.38 | 109.56±4.009 | 56.14±4.09 | 121.11±4.31 | 3.38±1.32 | 117.30±4.93 | 63.68±2.73 | 116±5.26 | 24.02±5.38 | 119.84±3.23 | 44.40±6.95 | 146.57±3.37 | 3.34±0.94 | 2.75±0.82 |
| 30–39 yr, M | 32.81±3.03 | 129.60±4.59 | 109.57±6.16 | 10.41±2.28 | 116.87±6.61 | 60.60±4.44 | 126.46±5.16 | 4.04±1.10 | 121.79±7.02 | 66.81±8.85 | 123.67±6.36 | 27.21±3.97 | 126.75±3.98 | 46.81±10.91 | 158.99±7.98 | 2.28±0.59 | 3.30±1.31 |
| 30–39 yr, F | 26.94±5.13 | 124.40±5.91 | 103.63±4.93 | 10.48±1.91 | 110.16±5.89 | 58.04±4.79 | 119.84±6.39 | 4.62±1.62 | 115.69±6.08 | 58.24±4.30 | 117.99±5.06 | 24.38±5.22 | 121.90±3.17 | 46.21±4.11 | 150.57±7.42 | 2.70±0.88 | 2.84±0.66 |
| 40–49 yr, M | 31.67±4.69 | 129.77±4.69 | 109.21±6.11 | 12.60±3.25 | 115.96±5.07 | 63.14±5.40 | 126.41±4.56 | 4.67±1.71 | 119.66±5.39 | 65.72±2.48 | 121.06±5.72 | 27.31±3.78 | 124.44±4.92 | 52.52±12.14 | 155.21±5.89 | 2.40±0.46 | 3.32±0.95 |
| 40–49 yr, F | 33.41±3.08 | 124.10±5.15 | 104.46±4.34 | 11.68±1.88 | 110.37±5.06 | 59.70±5.71 | 123.23±10.36 | 4.8±1.23 | 116.54±4.68 | 63.08±3.52 | 115.74±1.92 | 25.75±3.14 | 118.37±4.04 | 49.52±2.69 | 151.46±6.02 | 2.24±0.75 | 3.14±0.74 |
| 50–59 yr, M | 34.24±3.70 | 126.33±4.83 | 106.04±4.46 | 13.95±2.95 | 98.74±30.15 | 62.40±4.70 | 122.46±4.51 | 6.25±2.14 | 117.16±5.66 | 66.35±4.02 | 117.51±6.05 | 27.18±3.14 | 122.46±4.15 | 56.73±11.54a) | 158.34±7.80 | 3±1.1 | 2.78±0.84 |
| 50–59 yr, F | 31.72±4.04 | 125.29±6.83 | 105.79±6.65 | 12.80±2.24 | 111.86±6.42 | 62.15±6.67 | 120.01±5.24 | 5.63±1.26 | 115.43±6.32 | 65.17±5.24 | 114.97±5.86 | 26.55±4.13 | 120.77±6.24 | 55.54±8.06a) | 153.86±6.68 | 2.72±0.56 | 3.28±1.14 |
| 60–69 yr, M | 34.25±5.96 | 127.90±4.77 | 108.06±5.53 | 17.11±2.89 | 115.24±6.76 | 67.75±4.64 | 125.10±4.33 | 7.35±2.11a) | 120.79±5.58 | 69.01±4.31 | 119.59±6.71 | 28.54±3.70 | 123.91±4.85 | 62.25±5.95a) | 152.31±4.62 | 3.78±1.11 | 3.61±1.01 |
| 60–69 yr, F | 34.20±6.08 | 126.17±5.47 | 107.02±5.83 | 14.18±1.27 | 111.97±6.77 | 61.24±3.58 | 121.08±5.50 | 5.37±0.87 | 118.30±5.55 | 66.40±1.76 | 118.37±4.14 | 22.02±2.45 | 119.70±5.32 | 57.95±7.84a) | 150.37±8.59 | 3.30±0.43 | 3.46±0.96 |
| 70–79 yr, M | 37.28±4a) | 129.23±6.92 | 110.49±6.41 | 18.93±2.67 | 116.54±7.65 | 69.80±5.41 | 124.37±6.60 | 9.01±1.41a),b) | 120.07±7.23 | 72.68±5.29a) | 121.70±8.37 | 29.96±2.11 | 124.87±6.25 | 69.97±7.90a),b) | 160.06±4.94 | 4.13±1.24a) | 3.67±1.04 |
| 70–79 yr, F | 33.33±2.77 | 126.46±2.67 | 101.86±2.70 | 15.60±2.73 | 109.70±2.54 | 64.37±2.33 | 122.01±3.09 | 7.13±2.11a) | 119.51±2.22 | 65.77±4.40 | 118.19±3.25 | 26.25±3.70 | 119.04±2.22 | 61.71±10.11a),b) | 151.51±4.74 | 3.27±1.04 | 2.96±0.74 |
| 80–89 yr, M | 37.30a)±5.09 | 127.41±4.21 | 108.67±4.02 | 21.92±4.37 | 114.13±5.10 | 73±5.90 | 124.49±4.15 | 10.61±3.01a),b) | 118.47±7.19 | 70.72±8.59 | 119.79±6.13 | 33.84±4.09a) | 122.51±4.47 | 68.87±8.78a),b) | 158.24±7.85 | 4.45±0.78a) | 5.44±1.1a) |
| 80–89 yr, F | 38.41a)±5.10 | 123.39±6.04 | 103.41±6.07 | 21.29±4.44 | 109.97±6.81 | 67.47±6.40 | 120.02±5.79 | 11.24±2.02a),b) | 115.01±6.50 | 69.57±3.75 | 117.05±7.11 | 30.60±4.87 | 119.18±6.15 | 72.95±7.92a),b) | 152.76±9.19 | 5.31±1.45a) | 5.10±1.21a) |
| 90–99 yr, M | 39.90a)±4.32 | 131.90±4.31 | 99.47±28.07 | 25.04±3.63 | 119.37±3.67 | 76.61±7.17 | 129.90±6.79 | 12.71±1.90a),b) | 124.36±4.67 | 76.84±6.50a),b) | 125.07±5.78 | 35.22±4.76a) | 127.22±4.27 | 75.10±8.77a),b) | 158.76±7.87 | 6.68±1.23a),b) | 8.07±1.75a),b) |
| 90–99 yr, F | 34.97±2.08 | 123.32±8.29 | 104.05±1.83 | 17.75±1.09 | 110.55±2.98 | 68.42±4.54 | 121.57±8.93 | 10.52±2.99a) | 115.18±7.01 | 69.67±2.35 | 117.62±3.20 | 25.05±1.84 | 114.82±5.99 | 67.80±3.29a) | 149.70±5.76 | 5±1.4a) | 5.12±1.2a) |
Values are presented as mean±SD. M, male; F, female; MA1, maximum width of frontal horns; A2, maximum inner diameter of cranium; A3, maximum inner diameter of cranium at the level of A1; B1, minimum bicaudate width at the level of A1; B2, maximum inner diameter of cranium at the level of B1; C1, bioccipital width of occipital horns of lateral ventricles; C2, maximum inner diameter of cranium at the level of C1; D1, maximum width of third ventricle; D2, maximum inner diameter of cranium at the level of D1; E1, bitemporal width of temporal horns of lateral ventricles; E2, maximum inner diameter of cranium at the level of E1; F1, maximum width of lateral ventricles at the level of cella media; F2, maximum inner diameter of cranium at the level of F1; G1, maximum length of lateral ventricles at the level of cella media; G2, maximum inner diameter of cranium at the level of G1; H, maximum width of left temporal horn of lateral ventricles; J, maximum width of right temporal horn of lateral ventricle. a)Versus 1–9 and 10–19 yr; b)vs. 20–29 and 30–39 yr (P≤0.05).
![]()
Table 3
| Variable | R2 | P-value | Regression formula | Sensitivity (%) |
|---|---|---|---|---|
| Major ventricular parameters | ||||
| BW | 0.67 | <0.001 | –8.61+4.08×BW | 54.2 |
| ThVW | 0.64 | <0.001 | 5.15+6.78×ThVW | 48.3 |
| MLCM | 0.62 | <0.001 | –45.63+1.69×MLCM | 51.1 |
| Three variablesa) | 0.74 | <0.001 | –28.49+1.81×BW+1.93×ThVW+0.7×MLCM | 56.1 |
| Derived ventricular indices | ||||
| EI | 0.56 | <0.001 | –63.12+434.58×EI | 41.2 |
| BFI | 0.44 | <0.001 | –53.43+334.49×BFI | 57.1 |
| BCI | 0.71 | <0.001 | –13.59+490.54×BCI | 60.2 |
| CMI3 | 0.64 | <0.001 | –56.28+288.27×CMI3 | 48.1 |
| CMI4 | 0.60 | <0.001 | –28.88+394.41×CMI4 | 46.3 |
| ThVI | 0.65 | <0.001 | 4.20+803.20×ThVI | 50.2 |
| Six variablesb) | 0.76 | <0.001 | –32.93–66.06×EI+80.77×BFI+249.27×BCI+36.17×CMI3+134.83×CMI4+55.88×ThVI | 64.1 |
| Cortical atrophy | ||||
| IHSW | 0.63 | <0.001 | –0.73+8.62×IHSW | 48.1 |
| RHSD | 0.74 | <0.001 | –4.02+14.63×RHSD | 61.2 |
| LHSD | 0.73 | <0.001 | –1.66+13.44×LHSD | 57.2 |
| Three variablesc) | 0.78 | <0.001 | –7.87+2.68×IHSW+6.27×RHSD+4.98×LHSD | 65.1 |
BW, bicaudate width; ThVW, third ventricle width; MLCM, maximum length of lateral ventricles at cella media; EI, Evans’ index; BFI, bifrontal index; BCI, bicaudate index; CMI3, 4, cella media index 3, 4; ThVI, third ventricle index; IHSW, interhemispheric width; RHSD, right hemisphere sulci diameter; LHSD, left hemisphere sulci diameter. a)Multiple linear regression with BCW, ThVW, and MLCM; b)multiple linear regression with EI, BFI, BCI, CMI3, CMI4, and ThVI; c)multiple linear regression with IHSW, RHSD, and LHSD.
![]()
Frontal horns of lateral ventricle asymmetry
Ventricular indices
 | Fig. 6Distribution of six significant derived ventricular indices with age. (A) Total Evans’ index distribution with age (R2=0.56), (B) Evans’ index distribution within age groups (*vs. 1–9 yr, #vs. 10–19 yr, @vs. 20–29 yr, 30–39 yr, and 40–49 yr [P≤0.05]), (C) total bifrontal index distribution with age (R2=0.44), (D) bifrontal index width distribution within age groups (*vs. 1–9 yr, #vs. 10–19 yr, 20–29 yr, and 30–39 yr (P≤0.05]), (E) total bicaudate width distribution with age (R2=0.70), (F) bicaudate width distribution within age groups (*vs. 1–9 yr; #vs. 10–19 yr, 20–29 yr, 30–39 yr, and 40–49 yr; @vs. 50–59 yr, 60–69 yr, and 70–79 yr [P≤0.05]). (G) Total cella media index 3 distribution with age (R2=0.64), (H) cella media index 3 distribution within age groups (*vs. 1–9 yr; #vs. 10–19 yr, 20–29 yr, and 30–39 yr; @vs. 40–49 yr, 50–59 yr, and 60–69 yr [P≤0.05]). (I) Total cella media index 4 distribution with age (R2=0.60), (J) cella media index 4 within age groups (*vs. 1–9 yr; #vs. 10–19 yr, 20–29 yr, and 30–39 yr [P≤0.05]). (K) Total third ventricle index distribution with age (R2=0.65), (L) third ventricle index distribution within age groups (*vs. 1–9 yr; #vs. 10–19 yr, 20–29 yr, 30–39 yr, and 40–49 yr; @vs. 50–59 yr and 60–69 yr [P≤0.05]). Left column diagrams demonstrates linear interpolation and line of best fit from linear regression. Right column diagrams demonstrate male, female, and mean distribution within age groups (data are shown as mean±SD).
|
Table 4
| Group | Derived ventricular indices | |||||||||||
|---|---|---|---|---|---|---|---|---|---|---|---|---|
| EI | BFI | BCI | CMI1 | CMI2 | CMI3 | CMI4 | PORI | TRI | TWI | HI | ThVI | |
| 1–9 yr, M | 0.2±0.05 | 0.23±0.07 | 0.1±0.01 | 0.24±0.02 | 0.24±0.02 | 0.26±0.03 | 0.1±0.02 | 0.47±0.02 | 0.52±0.06 | 5.20±1.53 | 44.58±7.61 | 0.03±0.01 |
| 1–9 yr, F | 0.15±0.03 | 0.21±0.08 | 0.06±0.01 | 0.23±0.03 | 0.26±0.09 | 0.27±0.04 | 0.10±0.05 | 0.47±0.03 | 0.50±0.05 | 4.80±1.21 | 31.38±14.1 | 0.025±0.005 |
| 10–19 yr, M | 0.23±0.02a) | 0.28±0.03 | 0.08±0.02 | 0.23±0.03 | 0.25±0.02 | 0.31±0.03 | 0.15±0.02 | 0.48±0.02 | 0.51±0.06 | 5.72±1.21 | 47.62±13.78 | 0.02±0.005 |
| 10–19 yr, F | 0.23±0.02a) | 0.29±0.02 | 0.07±0.01 | 0.20±0.03 | 0.22±0.01 | 0.32±0.02 | 0.20±0.02 | 0.47±0.03 | 0.52±0.06 | 5.45±0.66 | 31.76±7.82 | 0.03±0.005 |
| 20–29 yr, M | 0.25±0.01a) | 0.29±0.02 | 0.10±0.02 | 0.18±0.02 | 0.19±0.02 | 0.30±0.04 | 0.17±0.03 | 0.49±0.01 | 0.54±0.07 | 5.94±0.84 | 43.73±13.51 | 0.03±0.01 |
| 20–29 yr, F | 0.23±0.03a) | 0.29±0.04 | 0.08±0.01 | 0.20±0.03 | 0.22±0.02 | 0.31±0.04 | 0.15±0.03 | 0.46±0.02 | 0.54±0.01 | 6.10±1.62 | 53.71±14.11 | 0.03±0.01 |
| 30–39 yr, M | 0.25±0.01a) | 0.30±0.02 | 0.09±0.01 | 0.20±0.02 | 0.21±0.02 | 0.30±0.05 | 0.18±0.03a) | 0.47±0.02 | 0.53±0.04 | 5.58±1.79 | 48.65±11.87 | 0.033±0.008 |
| 30–39 yr, F | 0.22±0.02a) | 0.27±0.03 | 0.095±0.01 | 0.20±0.032 | 0.22±0.02 | 0.30±0.02 | 0.19±0.03a) | 0.48±0.02 | 0.49±0.04 | 5.54±1.20 | 47.34±6.48 | 0.04±0.01 |
| 40–49 yr, M | 0.25±0.03a) | 0.29±0.04a) | 0.10±0.02 | 0.21±0.03 | 0.22±0.02 | 0.35±0.05 | 0.20±0.02a) | 0.50±0.03 | 0.54±0.03 | 6.03±1.04 | 48.35±9.19 | 0.04±0.01 |
| 40–49 yr, F | 0.27±0.02a) | 0.32±0.02a) | 0.10±0.01 | 0.20±0.02 | 0.21±0.02 | 0.32±0.01 | 0.21±0.02a) | 0.47±0.07 | 0.52±0.04 | 5.68±0.85 | 44.85±8.75 | 0.041±0.01 |
| 50–59 yr, M | 0.27±0.02a) | 0.32±0.03a) | 0.12±0.02 | 0.21±0.02 | 0.22±0.02 | 0.38±0.04a) | 0.22±0.02a) | 0.50±0.028 | 0.56±0.025 | 5.78±1.75 | 51.80±10.32 | 0.06±0.01a) |
| 50–59 yr, F | 0.25±0.02a) | 0.30±0.028a) | 0.11±0.01 | 0.22±0.019 | 0.22±0.019 | 0.36±0.04a) | 0.21±0.02a) | 0.51±0.03 | 0.56±0.04 | 6.01±0.99 | 50.75±6.93 | 0.05±0.015a) |
| 60–69 yr, M | 0.28±0.02a) | 0.31±0.04a) | 0.15±0.01a) | 0.23±0.02 | 0.23±0.02 | 0.40±0.04a) | 0.23±0.02a) | 0.54±0.02 | 0.59±0.04 | 7.81±1.7 | 46.85±8.12 | 0.06±0.01a) |
| 60–69 yr, F | 0.27±0.04a) | 0.31±0.04a) | 0.13±0.01a) | 0.23±0.09 | 0.18±0.01 | 0.36±0.05a) | 0.18±0.01a) | 0.54±0.07 | 0.57±0.019 | 6.76±0.96 | 50.58±10.12 | 0.05±0.009a) |
| 70–79 yr, M | 0.30±0.02a),b) | 0.33±0.03a) | 0.16±0.02a) | 0.23±0.01 | 0.24±0.02 | 0.42±0.03a) | 0.24±0.019a) | 0.56±0.038a) | 0.60±0.026a) | 8.37±1.51 | 50.88±9.45 | 0.075±0.01a),b) |
| 70–79 yr, F | 0.26±0.02a) | 0.32±0.02a) | 0.14±0.02a) | 0.22±0.01 | 0.23±0.02 | 0.38±0.05a) | 0.22±0.03a) | 0.51±0.038 | 0.55±0.036 | 6.88±0.75 | 47.81±12.21 | 0.065±0.01a) |
| 80–89 yr, M | 0.30±0.03a),b) | 0.34±0.04a) | 0.20±0.018a),b) | 0.26±0.03 | 0.27±0.03 | 0.43±0.04a),b) | 0.26±0.02a),b) | 0.58±0.03a),b) | 0.59±0.05 | 10.7±2.45a),b) | 49.85±5.62 | 0.09±0.01a),b) |
| 80–89 yr, F | 0.32±0.03a),b) | 0.38±0.03a),b) | 0.19±0.02a),b) | 0.25±0.03 | 0.26±0.03 | 0.47±0.05a),b) | 0.26±0.03a),b) | 0.56±0.03a),b) | 0.60±0.03a) | 10.82±2.42a),b) | 48.85±5.62 | 0.098±0.01a),b) |
| 90–99 yr, M | 0.32±0.04a),b) | 0.37±0.05a),b) | 0.22±0.02a),b) | 0.26±0.035a) | 0.28±0.03 | 0.50±0.06a),b) | 0.27±0.03a),b) | 0.60±0.03a),b) | 0.61±0.04a) | 15.80±2.01a),b) | 48.25±6.85 | 0.10±0.018a),b) |
| 90–99 yr, F | 0.30±003a) | 0.33±0.021a) | 0.16±0.01a) | 0.21±0.01 | 0.23±0.01 | 0.45±0.02a),b) | 0.23±0.01a) | 0.53±0.05a) | 0.60±0.03a) | 11.16±1.87a),b) | 51.32±6.41 | 0.09±0.01a),b) |
Values are presented as mean±SD. M, male; F, female; EI, Evans’ index; BFI, bifrontal index; BCI, bicaudate index; CMI1, 2, 3, 4, cella media index 1, 2, 3, 4; PORI, parieto-occipital ratio index; TRI, temporal ratio index; TWI, temporal width index; HI, Huckman index; ThVI, third ventricle index. a)Versus 1–9 and 10–19 yr, b)vs. 20–29 and 30–39 yr (P≤0.05).
![]()
Cortical atrophy
 | Fig. 7Distribution of cortical atrophy parameters with age. (A) Total interhemispheric sulcus width distribution with age (R2=0.63), (B) interhemispheric sulcus width distribution within age groups (*vs. 1–9 yr; #vs. 10–19 yr, 20–29 yr, and 30–39 yr; @vs. 40–49 yr and 50–59 yr [P≤0.05]). (C) Total right hemisphere sulci diameter distribution with age (R2=0.74), (D) right hemisphere sulci diameter distribution within age groups (*vs. 1–9 yr; #vs. 10–19 yr, 20–29 yr, and 30–39 yr; @vs. 40–49 yr and 50–59 yr [P≤0.05]). (E) Total left hemisphere sulci diameter distribution with age (R2=0.73), (F) left hemisphere sulci diameter distribution within age groups (*vs. 1–9 yr; #vs. 10–19 yr, 20–29 yr, and 30–39 yr; @vs. 40–49 yr and 50–59 yr [P≤0.05]). Left column diagrams demonstrates linear interpolation and line of best fit from linear regression. Right column diagrams demonstrate male, female, and mean of male and female distribution within age groups.
|

Multiple linear regression studies
Table 5
IHSW, interhemispheric width; BW, bicaudate width; ThVW, third ventricle width; MLCM, maximum length of lateral ventricles at cella media; EI, Evans’ index; BFI, bifrontal index; BCI, bicaudate index; CMI3, 4, cella media index 3, 4; ThVI, third ventricle index; RHSD, right hemisphere sulci diameter; LHSD, left hemisphere sulci diameter.
![]()
 XML Download