Abstract
Purpose
Materials and Methods
Results
Conclusion
*Regional Cancer Registry Committee
Electronic Supplementary Material
Notes
Author Contributions
Conceived and designed the analysis: Jung KW.
Collected the data: Jung KW, Regional Cancer Registry Committee.
Contributed data or analysis tools: Park EH, Jung KW, Kong HJ, Kang MJ, Yun EH.
Performed the analysis: Park NJ.
Wrote the paper: Park EH, Jung KW.
Interpretation and review: Jung KW, Kang MJ.
Review and comment: Kim HJ, Kim JE, Im JS, Seo HG.
Acknowledgments
References
Fig. 1.
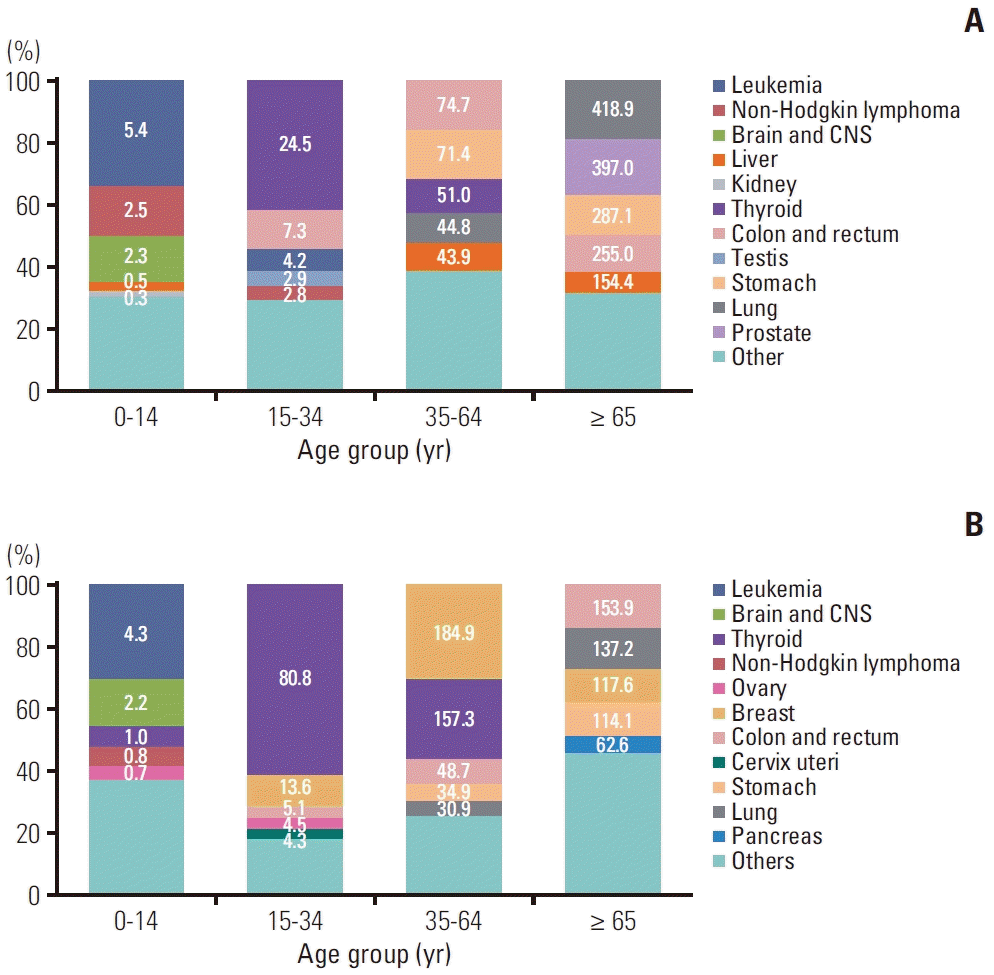
Fig. 3.
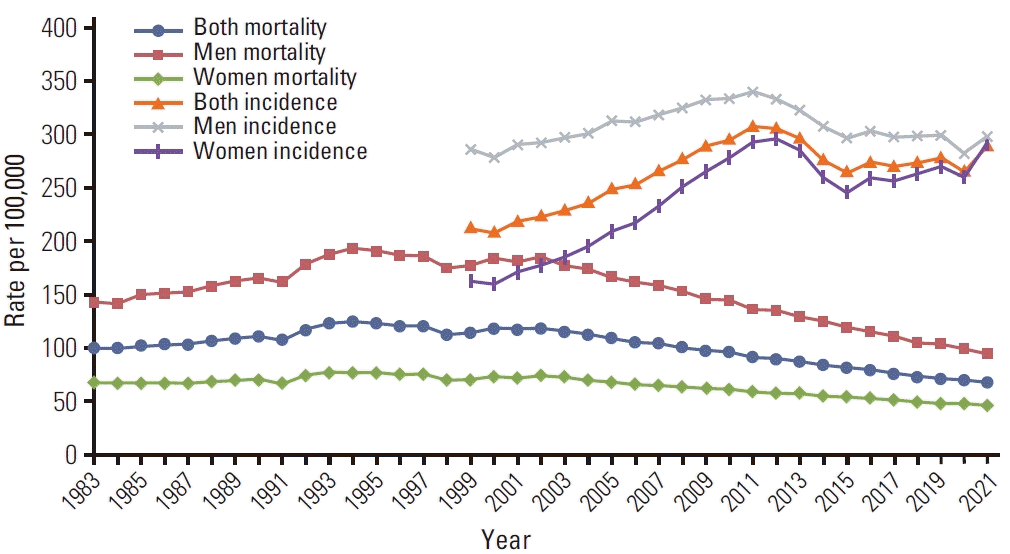
Fig. 4.
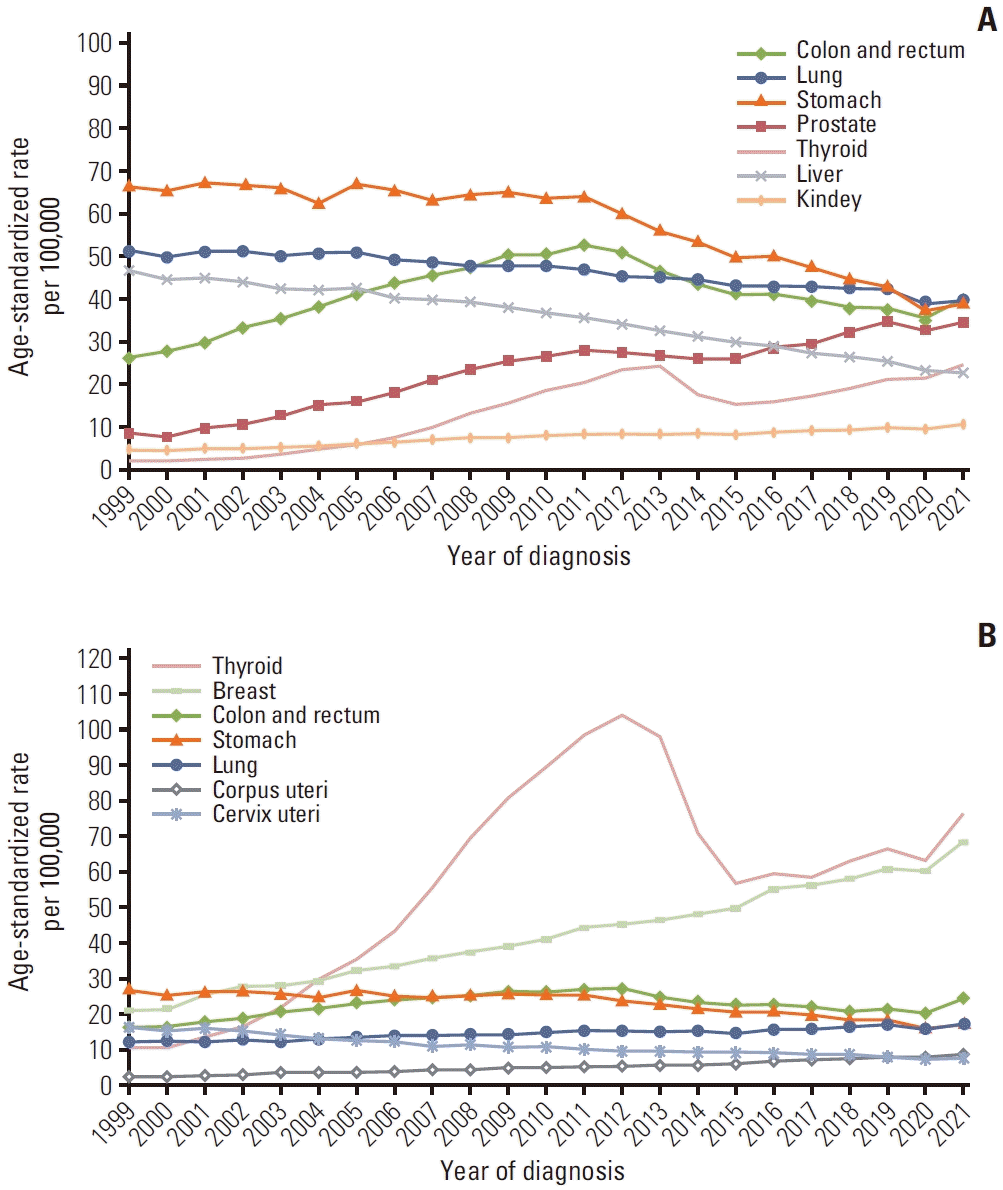
Fig. 5.
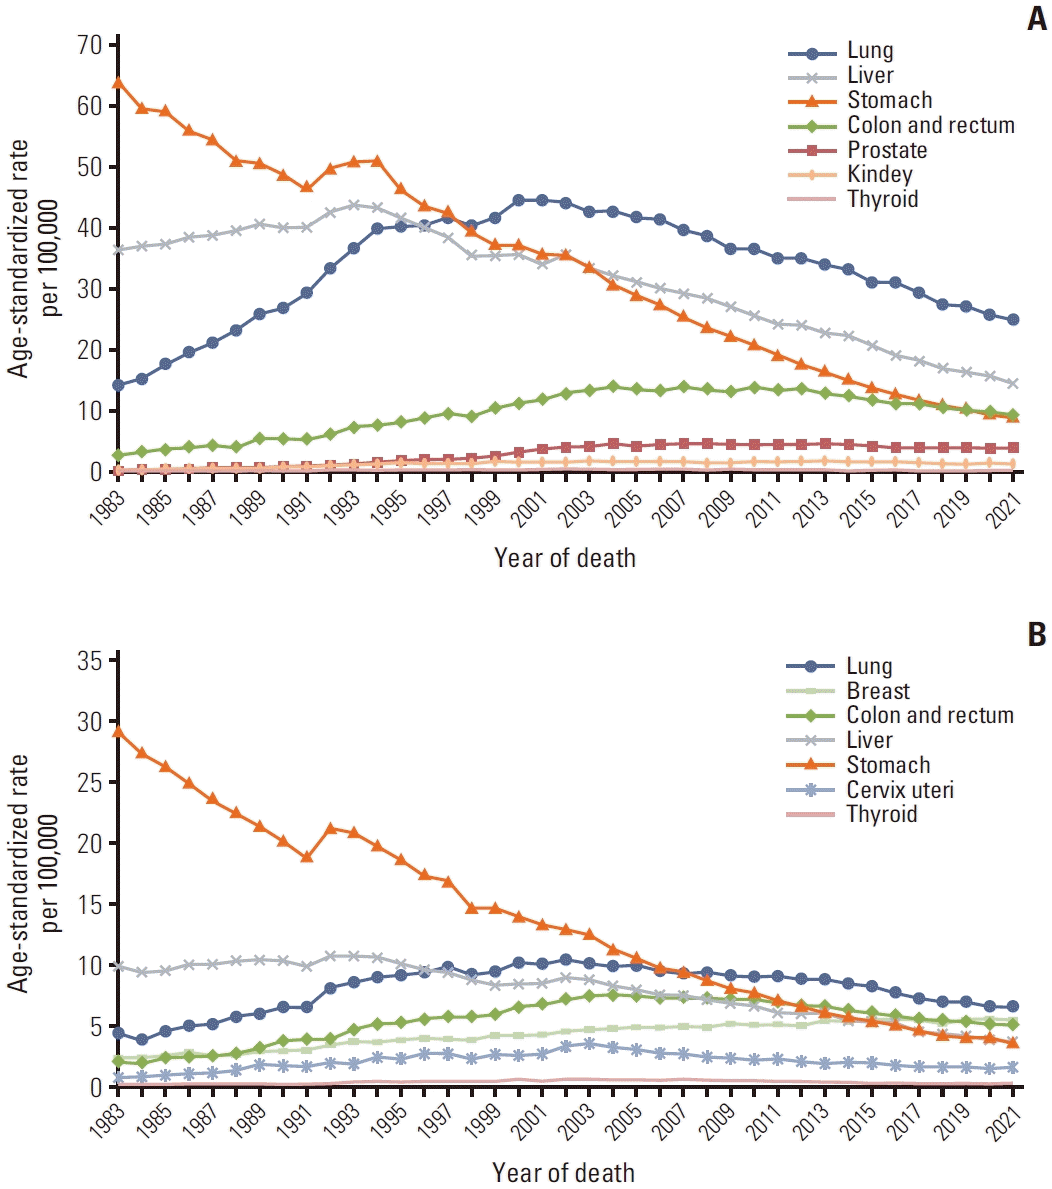
Fig. 6.
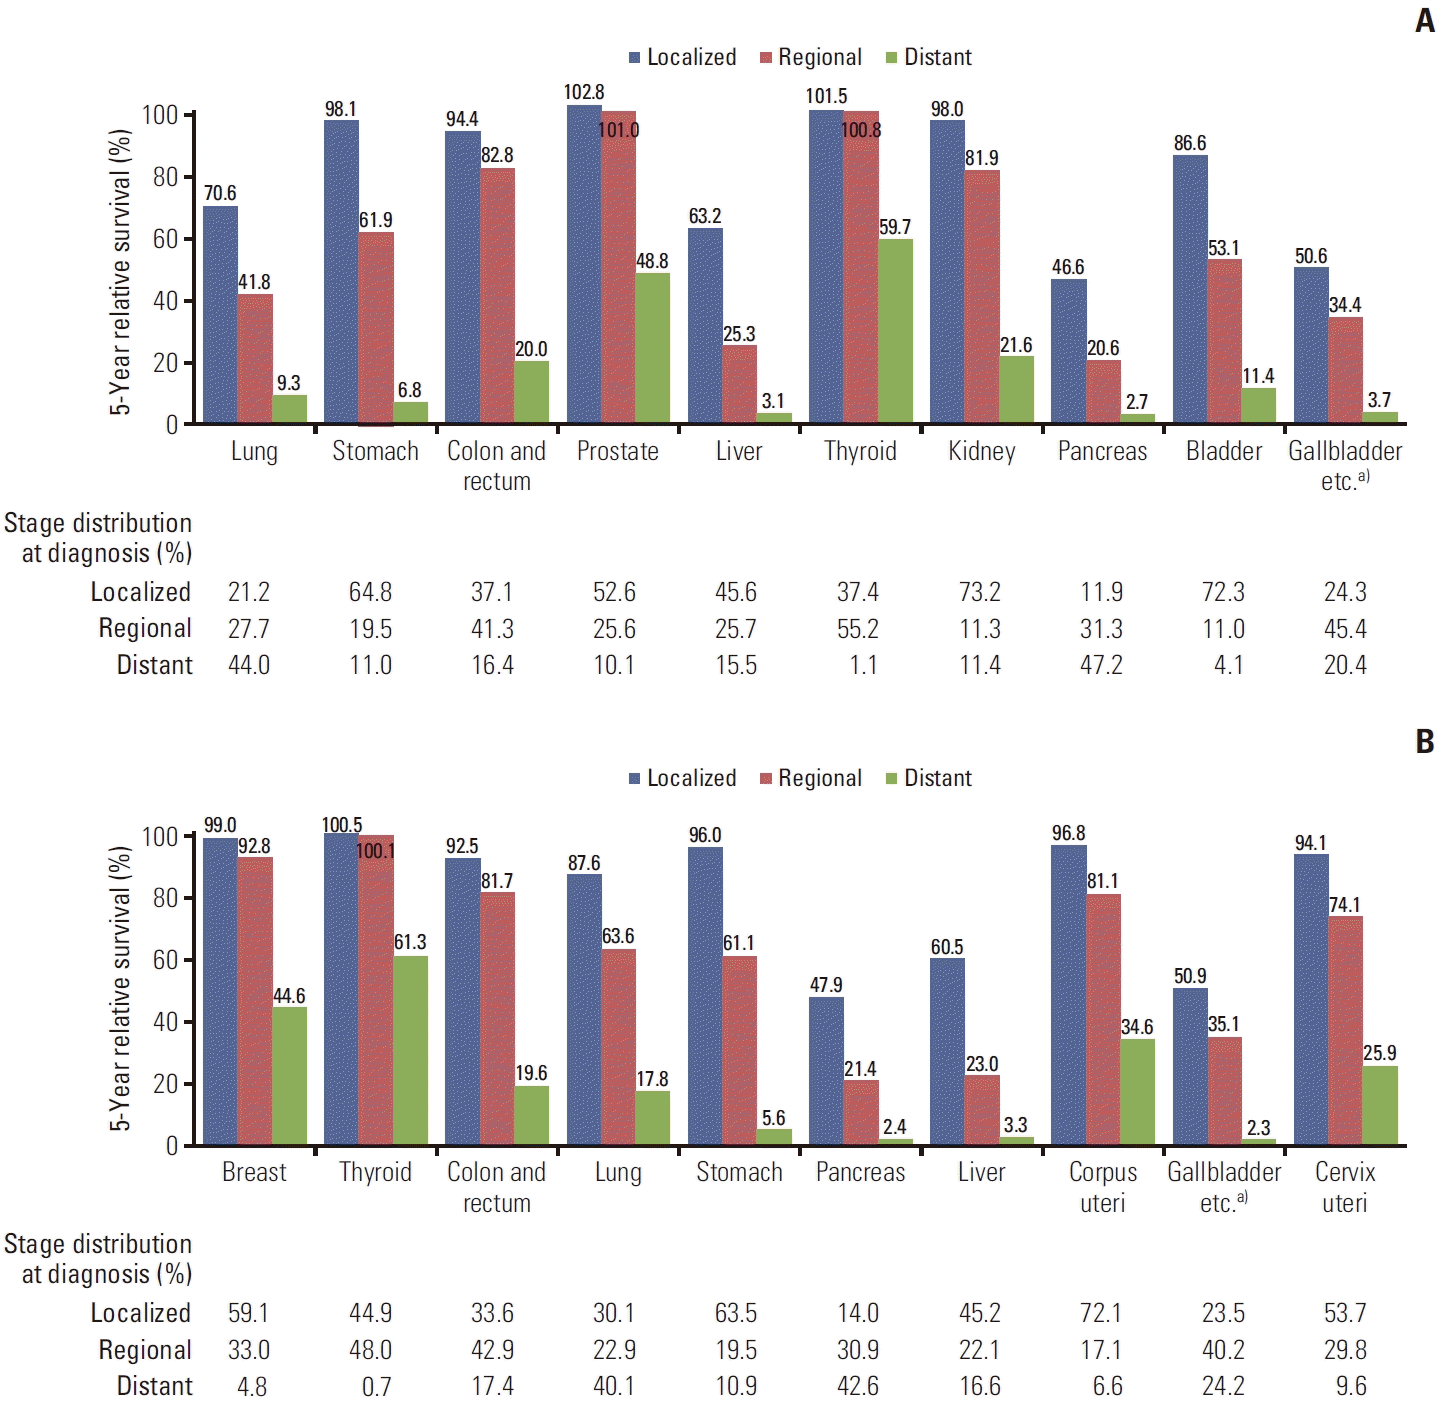
Fig. 7.
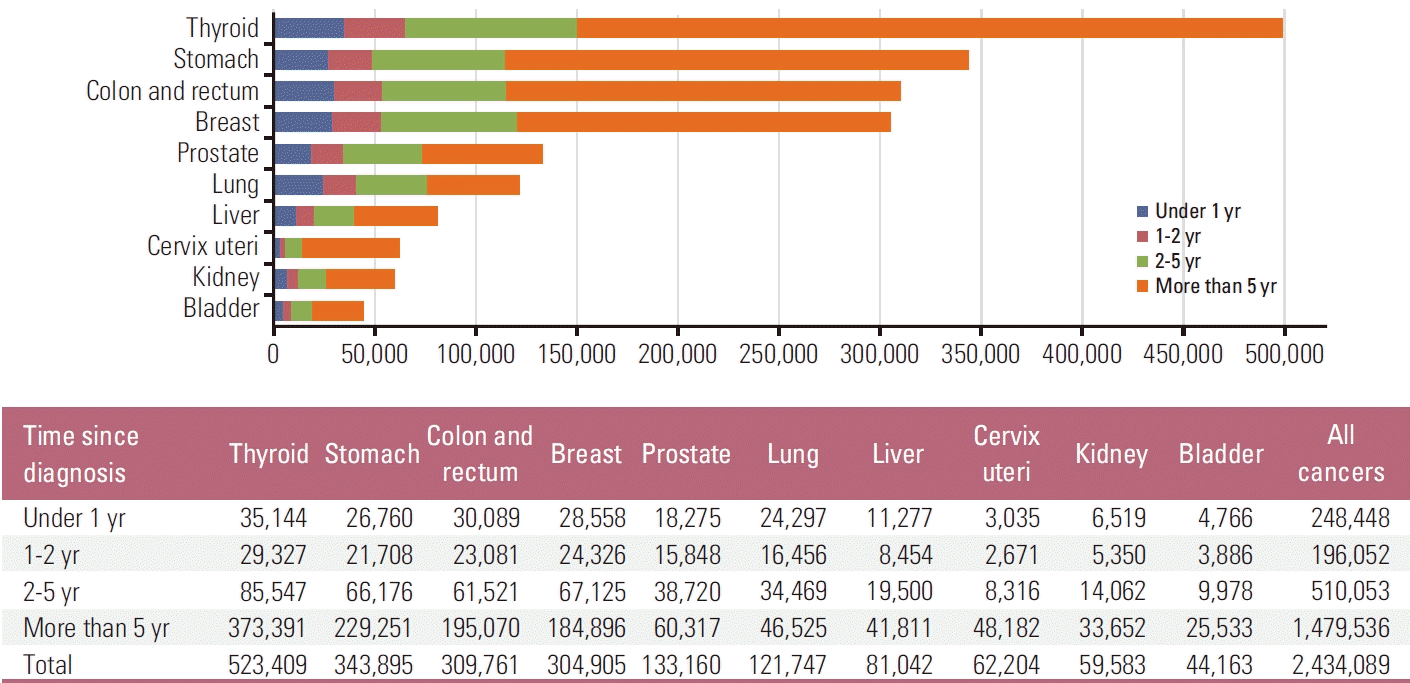
Table 1.
| Site/Type |
New cases |
Deaths |
Prevalent casesa) |
||||||
|---|---|---|---|---|---|---|---|---|---|
| Both sexes | Men | Women | Both sexes | Men | Women | Both sexes | Men | Women | |
| All sites | 277,523 | 143,723 | 133,800 | 82,688 | 50,922 | 31,766 | 2,434,089 | 1,066,228 | 1,367,861 |
| Lip, oral cavity, and pharynx | 4,371 | 3,159 | 1,212 | 1,226 | 941 | 285 | 33,749 | 22,507 | 11,242 |
| Esophagus | 2,954 | 2,615 | 339 | 1,569 | 1,408 | 161 | 13,510 | 11,953 | 1,557 |
| Stomach | 29,361 | 19,533 | 9,828 | 7,249 | 4,769 | 2,480 | 343,895 | 226,327 | 117,568 |
| Colon and rectum | 32,751 | 19,142 | 13,609 | 8,902 | 4,981 | 3,921 | 309,761 | 182,877 | 126,884 |
| Liver | 15,131 | 11,207 | 3,924 | 10,255 | 7,524 | 2,731 | 81,042 | 60,491 | 20,551 |
| Gallbladderb) | 7,617 | 4,085 | 3,532 | 5,277 | 2,724 | 2,553 | 28,061 | 14,586 | 13,475 |
| Pancreas | 8,872 | 4,592 | 4,280 | 6,931 | 3,600 | 3,331 | 18,178 | 9,134 | 9,044 |
| Larynx | 1,302 | 1,226 | 76 | 340 | 316 | 24 | 12,697 | 11,931 | 766 |
| Lung | 31,616 | 21,176 | 10,440 | 18,902 | 13,953 | 4,949 | 121,747 | 71,731 | 50,016 |
| Breast | 28,861 | 141 | 28,720 | 2,744 | 19 | 2,725 | 304,905 | 1,101 | 303,804 |
| Cervix uteri | 3,173 | - | 3,173 | 853 | - | 853 | 62,204 | - | 62,204 |
| Corpus uteri | 3,749 | - | 3,749 | 429 | - | 429 | 36,809 | - | 36,809 |
| Ovary | 3,221 | - | 3,221 | 1,376 | - | 1,376 | 27,510 | - | 27,510 |
| Prostate | 18,697 | 18,697 | - | 2,360 | 2,360 | - | 133,160 | 133,160 | - |
| Testis | 347 | 347 | - | 16 | 16 | - | 4,699 | 4,699 | - |
| Kidney | 6,883 | 4,775 | 2,108 | 1,029 | 725 | 304 | 59,583 | 40,363 | 19,220 |
| Bladder | 5,169 | 4,201 | 968 | 1,534 | 1,159 | 375 | 44,163 | 36,018 | 8,145 |
| Brain and CNS | 2,055 | 1,116 | 939 | 1,399 | 782 | 617 | 14,052 | 7,210 | 6,842 |
| Thyroid | 35,303 | 8,771 | 26,532 | 395 | 131 | 264 | 523,409 | 99,877 | 423,532 |
| Hodgkin lymphoma | 356 | 244 | 112 | 55 | 37 | 18 | 3,926 | 2,442 | 1,484 |
| Non-Hodgkin lymphoma | 5,726 | 3,292 | 2,434 | 1,913 | 1,104 | 809 | 43,765 | 24,793 | 18,972 |
| Multiple myeloma | 2,018 | 1,095 | 923 | 1,044 | 548 | 496 | 9,079 | 4,809 | 4,270 |
| Leukemia | 3,983 | 2,297 | 1,686 | 2,038 | 1,167 | 871 | 28,969 | 16,100 | 12,869 |
| Other and ill-defined | 24,007 | 12,012 | 11,995 | 4,852 | 2,658 | 2,194 | 175,216 | 84,119 | 91,097 |
Table 2.
| Site/Type |
Crude incidence rate per 100,000 |
Age-standardized incidence rate per 100,000a) |
||||
|---|---|---|---|---|---|---|
| Both sexes | Men | Women | Both sexes | Men | Women | |
| All sites | 540.6 | 561.7 | 519.7 | 289.3 | 298.2 | 292.5 |
| Lip, oral cavity, and pharynx | 8.5 | 12.3 | 4.7 | 4.6 | 6.8 | 2.5 |
| Esophagus | 5.8 | 10.2 | 1.3 | 2.7 | 5.1 | 0.6 |
| Stomach | 57.2 | 76.3 | 38.2 | 27.5 | 38.9 | 17.5 |
| Colon and rectum | 63.8 | 74.8 | 52.9 | 31.9 | 40.0 | 24.5 |
| Liver | 29.5 | 43.8 | 15.2 | 14.1 | 22.7 | 6.4 |
| Gallbladderb) | 14.8 | 16.0 | 13.7 | 6.1 | 7.6 | 4.8 |
| Pancreas | 17.3 | 17.9 | 16.6 | 7.8 | 8.9 | 6.9 |
| Larynx | 2.5 | 4.8 | 0.3 | 1.2 | 2.4 | 0.1 |
| Lung | 61.6 | 82.8 | 40.6 | 27.3 | 39.6 | 17.5 |
| Breast | 56.2 | 0.6 | 111.6 | 34.4 | 0.3 | 68.6 |
| Cervix uteri | 6.2 | - | 12.3 | 3.9 | - | 7.8 |
| Corpus uteri | 7.3 | - | 14.6 | 4.4 | - | 8.8 |
| Ovary | 6.3 | - | 12.5 | 3.9 | - | 7.7 |
| Prostate | 36.4 | 73.1 | - | 15.7 | 34.5 | - |
| Testis | 0.7 | 1.4 | - | 0.7 | 1.3 | - |
| Kidney | 13.4 | 18.7 | 8.2 | 7.5 | 10.7 | 4.4 |
| Bladder | 10.1 | 16.4 | 3.8 | 4.3 | 7.9 | 1.4 |
| Brain and CNS | 4.0 | 4.4 | 3.6 | 2.9 | 3.2 | 2.6 |
| Thyroid | 68.8 | 34.3 | 103.1 | 50.1 | 24.6 | 76.5 |
| Hodgkin lymphoma | 0.7 | 1.0 | 0.4 | 0.6 | 0.7 | 0.4 |
| Non-Hodgkin lymphoma | 11.2 | 12.9 | 9.5 | 6.3 | 7.7 | 5.0 |
| Multiple myeloma | 3.9 | 4.3 | 3.6 | 1.8 | 2.1 | 1.5 |
| Leukemia | 7.8 | 9.0 | 6.5 | 5.9 | 7.0 | 4.9 |
| Other and ill-defined | 46.8 | 46.9 | 46.6 | 23.9 | 26.1 | 22.1 |
Table 3.
| Rank | Cause of death | No. of deaths | Percentage of all deaths | Age-standardized death rate per 100,000a) |
|---|---|---|---|---|
| All causes | 317,655 | 100.0 | 248.3 | |
| 1 | Cancer | 82,688 | 26.0 | 67.6 |
| 2 | Heart disease | 31,569 | 9.9 | 22.4 |
| 3 | Cerebrovascular disease | 22,607 | 7.1 | 16.2 |
| 4 | Pneumonia | 22,812 | 7.2 | 14.3 |
| 5 | Intentional self-harm (suicide) | 13,352 | 4.2 | 18.2 |
| 6 | Diabetes mellitus | 8,961 | 2.8 | 6.5 |
| 7 | Disease of liver | 7,129 | 2.2 | 7.1 |
| 8 | Chronic lower respiratory diseases | 5,357 | 1.7 | 3.4 |
| 9 | Hypertensive diseases | 6,223 | 2.0 | 3.8 |
| 10 | Transport accidents | 3,624 | 1.1 | 4.3 |
| Others | 113,358 | 35.7 | 84.6 |
Source: Mortality Data, 2021, Statistics Korea [1].
Table 4.
| Site/Type |
Crude mortality rate per 100,000 |
Age-standardized mortality rate per 100,000a) |
||||
|---|---|---|---|---|---|---|
| Both sexes | Men | Women | Both sexes | Men | Women | |
| All sites | 161.1 | 199.0 | 123.4 | 67.6 | 95.2 | 46.6 |
| Lip, oral cavity, and pharynx | 2.4 | 3.7 | 1.1 | 1.1 | 1.8 | 0.4 |
| Esophagus | 3.1 | 5.5 | 0.6 | 1.3 | 2.6 | 0.2 |
| Stomach | 14.1 | 18.6 | 9.6 | 5.9 | 8.9 | 3.5 |
| Colon and rectum | 17.3 | 19.5 | 15.2 | 7.0 | 9.3 | 5.1 |
| Liver | 20.0 | 29.4 | 10.6 | 8.8 | 14.5 | 3.7 |
| Gallbladderb) | 10.3 | 10.6 | 9.9 | 3.9 | 4.9 | 3.1 |
| Pancreas | 13.5 | 14.1 | 12.9 | 5.6 | 6.7 | 4.5 |
| Larynx | 0.7 | 1.2 | 0.1 | 0.3 | 0.6 | - |
| Lung | 36.8 | 54.5 | 19.2 | 14.5 | 25.0 | 6.5 |
| Breast | 5.3 | 0.1 | 10.6 | 2.8 | - | 5.5 |
| Cervix uteri | 1.7 | - | 3.3 | 0.8 | - | 1.6 |
| Corpus uteri | 0.8 | - | 1.7 | 0.4 | - | 0.8 |
| Ovary | 2.7 | - | 5.3 | 1.3 | - | 2.4 |
| Prostate | 4.6 | 9.2 | - | 1.6 | 4.0 | - |
| Testis | - | 0.1 | - | - | - | - |
| Kidney | 2.0 | 2.8 | 1.2 | 0.9 | 1.4 | 0.4 |
| Bladder | 3.0 | 4.5 | 1.5 | 1.0 | 2.0 | 0.4 |
| Brain and CNS | 2.7 | 3.1 | 2.4 | 1.6 | 1.9 | 1.3 |
| Thyroid | 0.8 | 0.5 | 1.0 | 0.3 | 0.2 | 0.3 |
| Hodgkin lymphoma | 0.1 | 0.1 | 0.1 | - | 0.1 | - |
| Non-Hodgkin lymphoma | 3.7 | 4.3 | 3.1 | 1.6 | 2.1 | 1.1 |
| Multiple myeloma | 2.0 | 2.1 | 1.9 | 0.8 | 1.0 | 0.7 |
| Leukemia | 4.0 | 4.6 | 3.4 | 2.1 | 2.6 | 1.6 |
| Other and ill-defined | 9.5 | 10.4 | 8.5 | 4.1 | 5.3 | 3.2 |
Table 5.
| Site/Type |
Incidence |
Mortality |
||||||||||||||
|---|---|---|---|---|---|---|---|---|---|---|---|---|---|---|---|---|
| 1999 | 2021 |
Trend 1 |
Trend 2 |
Trend 3 |
1999 | 2021 |
Trend 1 |
Trend 2 |
Trend 3 |
|||||||
| Years | APC | Years | APC | Years | APC | Years | APC | Years | APC | Years | APC | |||||
| All sites | 212.1 | 289.3 | 1999-2012 | 3.3a) | 2012-2015 | –5.3 | 2015-2021 | 1.0a) | 115.1 | 67.6 | 1999-2002 | 0.9 | 2002-2013 | –2.8a) | 2013-2021 | –3.2a) |
| Lip, oral cavity, and pharynx | 3.6 | 4.6 | 1999-2021 | 0.8a) | - | - | - | - | 1.1 | 1.1 | 1999-2021 | –1.8a) | - | - | - | - |
| Esophagus | 4.1 | 2.7 | 1999-2016 | –2.2a) | 2016-2021 | –0.6 | - | - | 3.1 | 1.3 | 1999-2021 | –4.2a) | - | - | - | - |
| Stomach | 43.7 | 27.5 | 1999-2011 | –0.2 | 2011-2021 | –4.6a) | - | - | 23.9 | 5.9 | 1999-2002 | –2.5a) | 2002-2010 | –6.4a) | 2010-2021 | –7.1a) |
| Colon and rectum | 20.6 | 31.9 | 1999-2010 | 5.8a) | 2010-2019 | –3.8a) | 2019-2021 | 5.5 | 7.8 | 7.0 | 1999-2003 | 6.5a) | 2003-2012 | –0.5a) | 2012-2021 | –3.5a) |
| Liver | 27.9 | 14.1 | 1999-2010 | –1.7a) | 2010-2021 | –4.3a) | - | - | 20.6 | 8.8 | 1999-2002 | 0.7 | 2002-2014 | –3.7a) | 2014-2021 | –5.8a) |
| Gallbladderb) | 6.5 | 6.1 | 1999-2004 | 1.4 | 2004-2018 | –0.3 | 2018-2021 | –3.2a) | 5.2 | 3.9 | 1999-2001 | 7.6 | 2001-2013 | –2.8a) | 2013-2021 | –0.9a) |
| Pancreas | 5.6 | 7.8 | 1999-2021 | 1.6a) | - | - | - | - | 5.5 | 5.6 | 1999-2021 | 0.1 | - | - | - | - |
| Larynx | 2.4 | 1.2 | 1999-2021 | –3.4a) | - | - | - | - | 1.6 | 0.3 | 1999-2005 | –8.1a) | 2005-2008 | –15.8a) | 2008-2021 | –6.9a) |
| Lung | 28.5 | 27.3 | 1999-2021 | –0.3a) | - | - | - | - | 22.5 | 14.5 | 1999-2001 | 3.6 | 2001-2013 | –1.9a) | 2013-2021 | –3.6a) |
| Breast | 11.0 | 34.4 | 1999-2007 | 6.4a) | 2007-2021 | 4.3a) | - | - | 2.3 | 2.8 | 1999-2004 | 3.0a) | 2004-2021 | 0.7a) | - | - |
| Cervix uteri | 8.6 | 3.9 | 1999-2007 | –4.6a) | 2007-2021 | –3.1a) | - | - | 1.4 | 0.8 | 1999-2003 | 10.1a) | 2003-2008 | –7.2a) | 2008-2021 | –4.0a) |
| Corpus uteri | 1.4 | 4.4 | 1999-2021 | 5.1a) | - | - | - | - | 0.1 | 0.4 | 1999-2003 | 35.5a) | 2003-2021 | 2.5a) | - | - |
| Ovary | 2.7 | 3.9 | 1999-2021 | 1.8a) | - | - | - | - | 0.9 | 1.3 | 1999-2021 | 0.6a) | - | - | - | - |
| Prostate | 3.1 | 15.7 | 1999-2009 | 14.8a) | 2009-2015 | 1.2 | 2015-2021 | 5.0a) | 0.9 | 1.6 | 1999-2002 | 15.1a) | 2002-2010 | 1.7a) | 2010-2021 | –0.9a) |
| Testis | 0.3 | 0.7 | 1999-2021 | 4.7a) | - | - | - | - | 0.0 | 0.0 | 1999-2021 | –2.5a) | - | - | - | - |
| Kidney | 3.0 | 7.5 | 1999-2008 | 6.6a) | 2008-2021 | 2.7a) | - | - | 1.1 | 0.9 | 1999-2015 | –0.1 | 2015-2021 | –3.7a) | - | - |
| Bladder | 4.7 | 4.3 | 1999-2004 | 1.9 | 2004-2021 | –1.0a) | - | - | 1.3 | 1.0 | 1999-2001 | 10.9 | 2001-2021 | –2.0a) | - | - |
| Brain and CNS | 2.9 | 2.9 | 1999-2021 | 0.1 | 1.9 | 1.6 1 | 999-2002 | 6.4a) | 2002-2008 | –3.5a) | 2008-2021 | –0.9a) | ||||
| Thyroid | 6.5 | 50.1 | 1999-2011 | 22.5a) | 2011-2016 | –12.3a) | 2016-2021 | 6.0a) | 0.4 | 0.3 | 1999-2003 | 7.2a) | 2003-2021 | –4.4a) | - | - |
| Hodgkin lymphoma | 0.3 | 0.6 | 1999-2011 | 4.8a) | 2011-2021 | 1.9a) | - | - | 0.0 | 0.0 | 1999-2004 | 25.0a) | 2004-2021 | –2.8a) | - | - |
| Non-Hodgkin lymphoma | 4.3 | 6.3 | 1999-2019 | 2.3a) | 2019-2021 | –1.1 | - | - | 2.1 | 1.6 | 1999-2021 | –1.2a) | - | - | - | - |
| Multiple myeloma | 1.0 | 1.8 | 1999-2013 | 3.6a) | 2013-2021 | 0.6 | - | - | 0.6 | 0.8 | 1999-2003 | 13.0a) | 2003-2016 | 0.7 | 2016-2021 | –4.6a) |
| Leukemia | 4.7 | 5.9 | 1999-2021 | 1.0a) | - | - | - | - | 2.9 | 2.1 | 1999-2021 | –1.8a) | - | - | - | - |
| Other and ill-defined | 15.0 | 23.9 | 1999-2021 | 2.2a) | - | - | - | - | 7.8 | 4.1 | 1999-2021 | –2.7a) | - | - | - | - |
Table 6.
| Site/Type |
Both sexes |
Men |
Women |
|||||||||||||||||||||
|---|---|---|---|---|---|---|---|---|---|---|---|---|---|---|---|---|---|---|---|---|---|---|---|---|
| 1993-1995 | 1996-2000 | 2001-2005 | 2006-2010 | 2011-2015 | 2016-2020 | 2017-2021 | Changea) | 1993-1995 | 1996-2000 | 2001-2005 | 2006-2010 | 2011-2015 | 2016-2020 | 2017-2021 | Changea) | 1993-1995 | 1996-2000 | 2001-2005 | 2006-2010 | 2011-2015 | 2016-2020 | 2017-2021 | Changea) | |
| All sites | 42.9 | 45.2 | 54.2 | 65.5 | 70.8 | 71.6 | 72.1 | 29.2 | 33.2 | 36.4 | 45.6 | 56.9 | 63.1 | 65.6 | 66.1 | 33.0 | 55.2 | 56.4 | 64.3 | 74.5 | 78.3 | 77.9 | 78.2 | 23.1 |
| All sites excluding thyroid | 41.2 | 43.4 | 50.9 | 59.1 | 64.3 | 67.4 | 67.8 | 26.6 | 32.7 | 35.9 | 44.7 | 54.6 | 60.4 | 63.5 | 63.9 | 31.2 | 52.6 | 53.5 | 59.1 | 65.0 | 69.4 | 72.3 | 72.7 | 20.1 |
| Lip, oral cavity, and pharynx | 42.2 | 47.4 | 54.5 | 61.1 | 65.5 | 69.3 | 69.8 | 27.6 | 36.7 | 41.8 | 49.7 | 57.0 | 61.9 | 66.5 | 66.6 | 29.9 | 59.4 | 64.5 | 68.1 | 72.1 | 74.6 | 76.5 | 77.7 | 18.2 |
| Esophagus | 14.0 | 15.7 | 21.5 | 30.0 | 36.6 | 42.4 | 42.8 | 28.8 | 13.0 | 14.7 | 20.8 | 29.4 | 36.3 | 42.0 | 42.2 | 29.2 | 25.0 | 25.9 | 29.8 | 37.3 | 39.8 | 46.5 | 48.2 | 23.2 |
| Stomach | 43.9 | 47.3 | 58.0 | 68.4 | 75.9 | 77.9 | 77.9 | 34.0 | 43.9 | 47.6 | 58.7 | 69.1 | 76.8 | 78.8 | 78.6 | 34.7 | 43.7 | 46.8 | 56.6 | 67.0 | 74.0 | 76.1 | 76.4 | 32.7 |
| Colon and rectum | 56.2 | 58.9 | 66.9 | 73.9 | 76.1 | 74.3 | 74.3 | 18.1 | 56.7 | 59.8 | 68.8 | 75.8 | 77.8 | 75.5 | 75.3 | 18.7 | 55.7 | 57.7 | 64.4 | 71.1 | 73.6 | 72.5 | 72.7 | 17.1 |
| Liver | 11.8 | 14.1 | 20.6 | 28.3 | 34.5 | 38.8 | 39.3 | 27.5 | 10.8 | 13.8 | 20.4 | 28.3 | 35.0 | 39.4 | 39.8 | 29.0 | 15.1 | 15.1 | 21.0 | 28.3 | 32.9 | 37.4 | 37.6 | 22.5 |
| Gallbladderb) | 18.7 | 20.7 | 23.1 | 26.9 | 28.8 | 28.7 | 28.9 | 10.2 | 18.0 | 21.1 | 23.5 | 27.8 | 29.5 | 29.7 | 30.0 | 12.0 | 19.3 | 20.3 | 22.7 | 26.0 | 28.0 | 27.7 | 27.7 | 8.4 |
| Pancreas | 10.6 | 8.7 | 8.4 | 8.6 | 11.0 | 15.1 | 15.9 | 5.3 | 10.0 | 8.3 | 8.4 | 8.4 | 10.4 | 14.1 | 14.8 | 4.8 | 11.5 | 9.3 | 8.4 | 8.9 | 11.6 | 16.2 | 17.2 | 5.6 |
| Larynx | 61.6 | 63.3 | 66.6 | 73.2 | 75.3 | 80.2 | 80.3 | 18.7 | 62.2 | 63.7 | 67.2 | 73.5 | 75.7 | 80.3 | 80.3 | 18.1 | 56.3 | 58.9 | 58.7 | 68.0 | 69.4 | 78.8 | 80.3 | 24.0 |
| Lung | 12.5 | 13.7 | 16.6 | 20.3 | 27.6 | 37.2 | 38.5 | 26.0 | 11.6 | 12.4 | 15.3 | 18.0 | 23.4 | 30.8 | 31.9 | 20.3 | 15.8 | 17.5 | 20.2 | 26.0 | 37.4 | 50.8 | 52.4 | 36.6 |
| Breast | 79.2 | 83.7 | 88.7 | 91.2 | 92.8 | 93.8 | 93.8 | 14.6 | 77.1 | 84.3 | 87.5 | 89.9 | 90.7 | 90.3 | 90.0 | 12.9 | 79.3 | 83.7 | 88.7 | 91.2 | 92.8 | 93.8 | 93.8 | 14.6 |
| Cervix uteri | 78.3 | 80.3 | 81.5 | 80.7 | 80.4 | 80.2 | 79.9 | 1.6 | - | - | - | - | - | - | - | - | 78.3 | 80.3 | 81.5 | 80.7 | 80.4 | 80.2 | 79.9 | 1.6 |
| Corpus uteri | 82.9 | 82.0 | 84.8 | 86.5 | 87.7 | 89.4 | 89.6 | 6.7 | - | - | - | - | - | - | - | - | 82.9 | 82.0 | 84.8 | 86.5 | 87.7 | 89.4 | 89.6 | 6.7 |
| Ovary | 60.2 | 59.4 | 61.8 | 61.4 | 64.9 | 65.1 | 65.9 | 5.7 | - | - | - | - | - | - | - | - | 60.2 | 59.4 | 61.8 | 61.4 | 64.9 | 65.1 | 65.9 | 5.7 |
| Prostate | 59.1 | 69.4 | 81.0 | 92.0 | 94.2 | 95.6 | 96.0 | 36.9 | 59.1 | 69.4 | 81.0 | 92.0 | 94.2 | 95.6 | 96.0 | 36.9 | - | - | - | - | - | - | - | - |
| Testis | 87.4 | 90.4 | 90.7 | 93.2 | 94.9 | 96.0 | 95.6 | 8.1 | 87.4 | 90.4 | 90.7 | 93.2 | 94.9 | 96.0 | 95.6 | 8.1 | - | - | - | - | - | - | - | - |
| Kidney | 64.2 | 67.0 | 73.7 | 78.6 | 82.6 | 85.7 | 86.4 | 22.1 | 63.5 | 65.4 | 73.0 | 78.5 | 82.2 | 85.8 | 86.3 | 22.8 | 65.8 | 70.3 | 74.9 | 78.9 | 83.4 | 85.4 | 86.6 | 20.8 |
| Bladder | 70.7 | 73.6 | 76.0 | 77.3 | 76.6 | 76.8 | 77.0 | 6.3 | 71.6 | 75.1 | 77.8 | 79.3 | 78.5 | 78.7 | 78.8 | 7.3 | 67.2 | 67.2 | 69.1 | 69.2 | 68.5 | 69.0 | 69.5 | 2.3 |
| Brain and CNS | 40.4 | 40.0 | 41.2 | 42.9 | 42.0 | 40.4 | 39.7 | –0.7 | 39.0 | 38.7 | 40.5 | 41.4 | 40.6 | 38.3 | 37.4 | –1.6 | 42.3 | 41.5 | 41.9 | 44.7 | 43.6 | 42.8 | 42.4 | 0.1 |
| Thyroid | 94.5 | 95.0 | 98.4 | 100.0 | 100.2 | 100.0 | 100.1 | 5.5 | 87.9 | 89.7 | 96.0 | 100.2 | 100.6 | 100.3 | 100.5 | 12.6 | 95.7 | 96.0 | 98.7 | 99.9 | 100.1 | 99.9 | 99.9 | 4.3 |
| Hodgkin lymphoma | 70.2 | 71.9 | 76.8 | 81.1 | 82.3 | 87.0 | 86.4 | 16.3 | 69.4 | 69.3 | 74.8 | 80.8 | 81.8 | 87.2 | 86.3 | 16.9 | 71.5 | 77.3 | 80.7 | 81.6 | 83.3 | 86.7 | 86.6 | 15.1 |
| Non-Hodgkin lymphoma | 48.3 | 51.1 | 56.0 | 59.4 | 62.9 | 65.3 | 65.4 | 17.1 | 46.8 | 49.6 | 55.0 | 59.2 | 62.9 | 65.6 | 65.3 | 18.4 | 50.7 | 53.3 | 57.5 | 59.7 | 62.8 | 64.8 | 65.5 | 14.9 |
| Multiple myeloma | 23.7 | 21.0 | 29.8 | 35.0 | 41.6 | 50.3 | 50.1 | 26.5 | 23.2 | 19.1 | 30.0 | 35.3 | 41.2 | 50.6 | 50.6 | 27.3 | 24.1 | 23.2 | 29.7 | 34.8 | 42.1 | 50.0 | 49.6 | 25.5 |
| Leukemia | 27.5 | 34.3 | 41.9 | 47.7 | 52.0 | 55.2 | 55.4 | 27.8 | 27.3 | 33.3 | 41.8 | 46.9 | 52.3 | 54.8 | 55.2 | 28.0 | 27.9 | 35.5 | 42.1 | 48.7 | 51.7 | 55.6 | 55.5 | 27.6 |
| Other and ill-defined | 44.5 | 48.4 | 57.9 | 67.7 | 72.9 | 76.3 | 76.5 | 32.0 | 39.6 | 44.7 | 54.1 | 63.8 | 69.4 | 73.4 | 73.6 | 33.9 | 50.1 | 52.7 | 62.0 | 71.6 | 76.3 | 79.3 | 79.5 | 29.3 |
Table 7.
| Site/Type |
Crude prevalence rate per 100,000a) |
Age-standardized prevalence rate per 100,000b) |
||||
|---|---|---|---|---|---|---|
| Both sexes | Men | Women | Both sexes | Men | Women | |
| All sites | 4,741.7 | 4,166.7 | 5,313.3 | 2,467.3 | 2,182.1 | 2,835.3 |
| Lip, oral cavity, and pharynx | 65.7 | 88.0 | 43.7 | 34.8 | 47.6 | 23.3 |
| Esophagus | 26.3 | 46.7 | 6.0 | 11.6 | 22.3 | 2.6 |
| Stomach | 669.9 | 884.5 | 456.7 | 304.3 | 434.1 | 195.9 |
| Colon and rectum | 603.4 | 714.7 | 492.9 | 273.9 | 355.8 | 206.1 |
| Liver | 157.9 | 236.4 | 79.8 | 77.1 | 122.0 | 36.1 |
| Gallbladderc) | 54.7 | 57.0 | 52.3 | 23.1 | 27.2 | 19.7 |
| Pancreas | 35.4 | 35.7 | 35.1 | 17.7 | 18.5 | 17.1 |
| Larynx | 24.7 | 46.6 | 3.0 | 10.7 | 22.2 | 1.2 |
| Lung | 237.2 | 280.3 | 194.3 | 106.7 | 135.4 | 84.6 |
| Breast | 594.0 | 4.3 | 1,180.1 | 327.4 | 2.2 | 645.7 |
| Cervix uteri | 121.2 | - | 241.6 | 65.6 | - | 128.9 |
| Corpus uteri | 71.7 | - | 143.0 | 39.4 | - | 77.8 |
| Ovary | 53.6 | - | 106.9 | 32.4 | - | 64.6 |
| Prostate | 259.4 | 520.4 | - | 101.6 | 234.7 | - |
| Testis | 9.2 | 18.4 | - | 8.1 | 15.7 | - |
| Kidney | 116.1 | 157.7 | 74.7 | 61.2 | 86.7 | 37.8 |
| Bladder | 86.0 | 140.8 | 31.6 | 36.0 | 66.8 | 11.7 |
| Brain and CNS | 27.4 | 28.2 | 26.6 | 22.1 | 23.4 | 20.6 |
| Thyroid | 1,019.6 | 390.3 | 1,645.2 | 619.1 | 244.5 | 992.7 |
| Hodgkin lymphoma | 7.6 | 9.5 | 5.8 | 6.0 | 7.2 | 4.8 |
| Non-Hodgkin lymphoma | 85.3 | 96.9 | 73.7 | 52.6 | 62.8 | 42.8 |
| Multiple myeloma | 17.7 | 18.8 | 16.6 | 8.3 | 9.4 | 7.3 |
| Leukemia | 56.4 | 62.9 | 50.0 | 48.4 | 54.3 | 42.5 |
| Other and ill-defined | 341.3 | 328.7 | 353.9 | 179.3 | 189.1 | 171.3 |
a) Crude prevalence rate: number of prevalent cases divided by the corresponding person-years of observation. Prevalent cases were defined as patients who were diagnosed between January 1, 1999 and December 31, 2021 and who were alive on January 1, 2022. Multiple primary cancer cases were counted multiple times,


 PDF
PDF Citation
 Print
Print


 XML Download