Abstract
Purpose
Materials and Methods
Results
Conclusion
Electronic Supplementary Material
Notes
Ethical Statement
This study was approved by the Institutional Review Board (IRB) of Yonsei University Health System Clinical Trials Center (IRB No. 4-2022-0634). Informed consent was waived because of the retrospective analysis of anonymous clinical data.
Author Contributions
Conceived and designed the analysis: Kim DS, Suh CO, Lyu CJ, Han JW.
Collected the data: Ahn WK, Lee J, Kim SH, Han JW.
Contributed data or analysis tools: Ahn WK, Hahn SM, Yoon HI, Lee J, Park EK, Shim KW, Kim DS, Suh CO, Kim SH, Lyu CJ, Han JW.
Performed the analysis: Ahn WK, Kim SH, Han JW.
Wrote the paper: Ahn WK, Han JW.
References
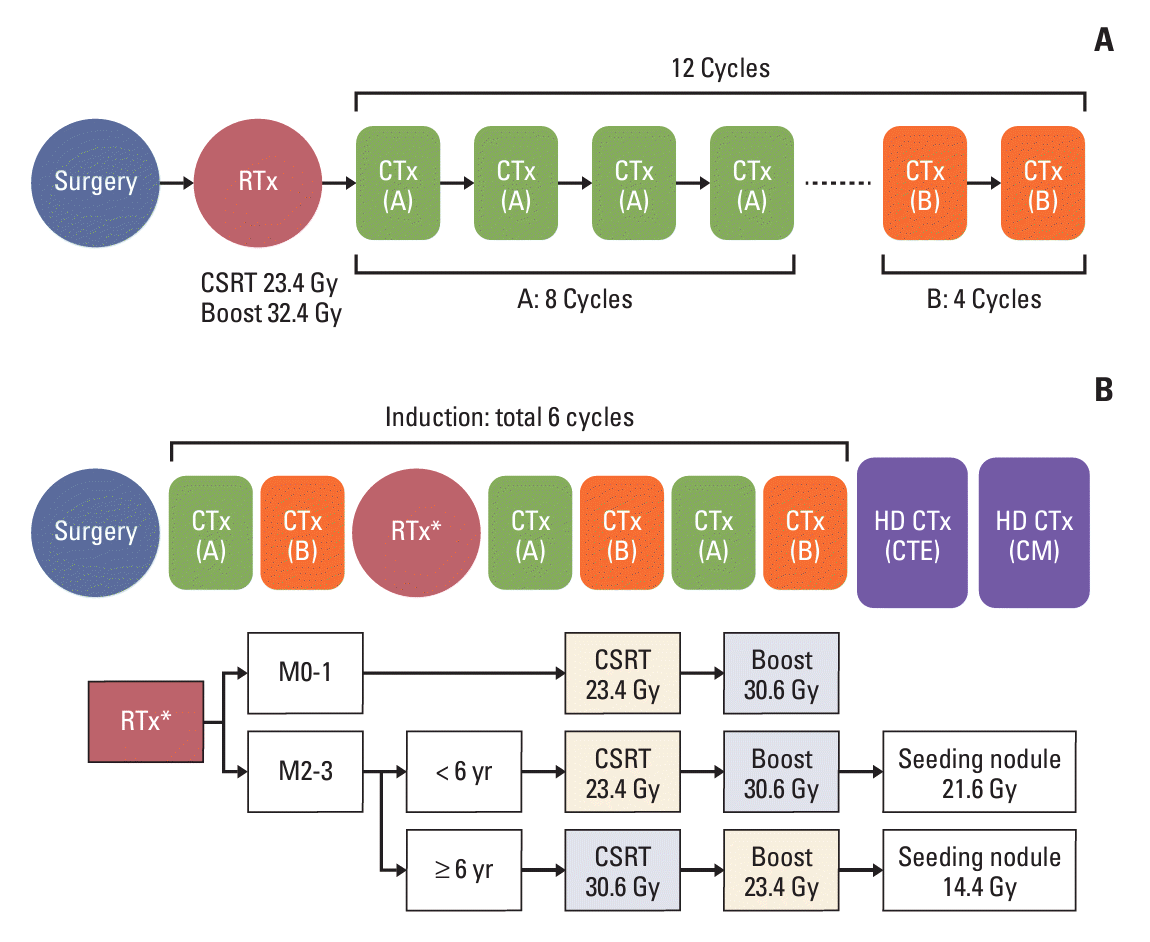
Fig. 1.

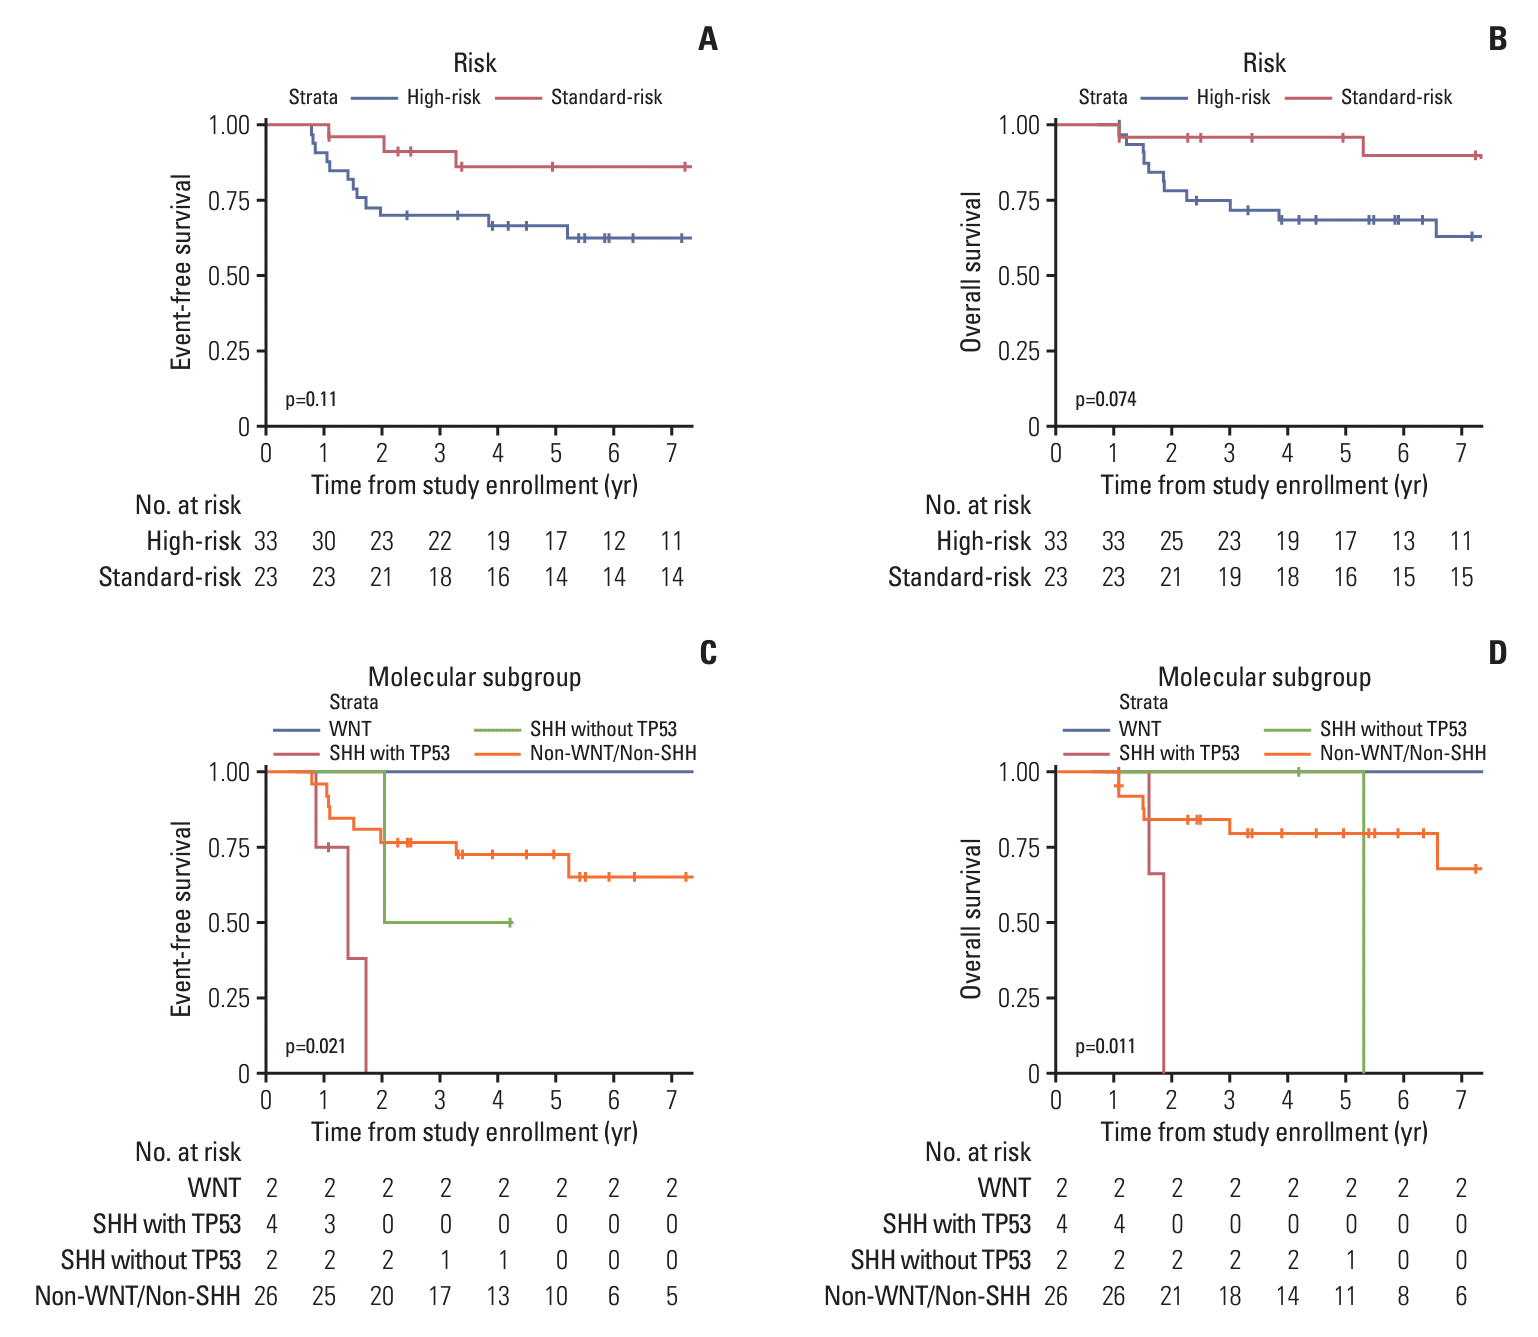
Fig. 2.

Table 1.
| Chemotherapy regimen | |
|---|---|
| KSPNO M051 | |
| Course A (1-8 cycles) | Cisplatin 75 mg/m2 on D1 |
| Vincristine 1.5 mg/m2 on D1, 8, 15 | |
| Cyclophosphamide 1,000 mg/m2 on D2, 3 | |
| Course B (9-12 cycles) | Vincristine 1.5 mg/m2 on D1, 8, 15 |
| Cyclophosphamide 1,000 mg/m2 on D1, 2 | |
| KSPNO S081 | |
| Course A (1, 3, 5 cycles)a) | Cisplatin 90 mg/m2 on D1 |
| Etoposide 75 mg/m2 on D1, 2, 3 | |
| Cyclophosphamide 1,500 mg/m2 on D1, 2 | |
| Vincristine 1.5 mg/m2 on D1, 8 | |
| Course B (2, 4, 6 cycles)a) | Carboplatin 300 mg/m2 on D1, 2 |
| Etoposide 75 mg/m2 on D1, 2, 3, 4, 5 | |
| Ifosfamide 1,500 mg/m2 on D1, 2, 3, 4, 5 | |
| Vincristine 1.5 mg/m2 on D1, 8 | |
| First HDC CTE | Carboplatin 500 mg/m2 on D1, 2, 3 |
| Thioetepa 300 mg/m2 on D4, 5, 6 | |
| Etoposide 250 mg/m2 on D4, 5, 6 | |
| Second HDC CM | Cyclophosphamide 1,500 mg/m2 on D1, 2, 3, 4 |
| Melphalan 60 mg/m2 on D5, 6, 7 |
Table 2.
| Characteristic | SR (n=24) | HR (n=35) | Total (n=59) |
|---|---|---|---|
| Age (yr) | 9.8 (6.4-12.3) | 5.9 (4.0-9.5) | 8.1 (4.75-11.1) |
| Sex | |||
| Male | 17 (70.8) | 22 (62.9) | 39 (66.1) |
| Female | 7 (29.2) | 13 (37.1) | 20 (33.9) |
| Histology | |||
| Classic | 21 (87.5) | 29 (82.9) | 50 (84.7) |
| Desmoplastic/Nodular | 2 (8.3) | 4 (11.4) | 6 (10.2) |
| MBEN | 1 (4.2) | 1 (2.9) | 2 (3.4) |
| Large cell/Anaplastic | 0 | 1 (2.9) | 1 (1.7) |
| Molecular | |||
| WNT | 1 (4.2) | 1 (2.9) | 2 (3.4) |
| SHH with TP53 | 1 (4.2) | 3 (8.6) | 4 (6.8) |
| SHH without TP53 | 1 (4.2) | 1 (2.9) | 2 (3.4) |
| Non-Wnt/Non-SHH | 10 (41.7) | 18 (51.4) | 28 (47.5) |
| Not done | 11 (45.8) | 12 (34.3) | 23 (39.0) |
| T category | |||
| 1 | 1 (4.2) | 0 | 1 (1.7) |
| 2 | 8 (33.3) | 1 (2.9) | 9 (15.3) |
| 3 | 15 (62.5) | 30 (85.7) | 45 (76.3) |
| 4 | 0 | 4 (11.4) | 4 (6.8) |
| M category | |||
| 0 | 24 (100) | 6 (17.1) | 30 (50.8) |
| 1 | 0 | 5 (14.3) | 5 (8.5) |
| 2 | 0 | 4 (11.4) | 4 (6.8) |
| 3 | 0 | 20 (57.1) | 20 (33.9) |
| Resection status | |||
| GTR | 18 (75.0) | 12 (34.3) | 30 (50.8) |
| NTR | 6 (25.0) | 6 (17.1) | 12 (20.3) |
| STR | 0 | 16 (45.7) | 16 (27.1) |
| Biopsy | 0 | 1 (2.9) | 1 (1.7) |
| R stage | |||
| R0 | 18 (75.0) | 12 (34.3) | 30 (50.8) |
| R1 | 6 (25.0) | 23 (65.7) | 29 (49.2) |
| Protocol | |||
| KSPNO M051 | 23 (95.8) | 2 (5.7) | 25 (42.4) |
| KSPNO S081 | 1 (4.1) | 33 (94.3) | 34 (57.6) |
| RT dose | |||
| Tumor bed | 55.8 (54.0-55.8) | 54.0 (54.0-55.3) | 54.8 (54.0-55.8) |
| CSRT | 23.4 (23.4-24.2) | 30.6 (30.3-30.6) | 30.6 (23.4-30.6) |
| Intensity of chemotherapy | |||
| Chemotherapy | 93.2 (76.8-103.3) | 86.9 (78.1-92.2) | - |
| HDC | - | 80.0 (71.3-90.0) | - |
| Total | - | 85.1 (74.7-91.7) | - |
| Time from operation to other treatment (mo)a) | 0.81 (0.69-0.93) | 0.59 (0.36-0.78) | 0.72 (0.43-0.91) |
| Follow-up (yr) | 8.2 (5.0-11.4) | 5.4 (2.1-8.5) | 6.4 (2.8-10.3) |
Values are presented as median (IQR) or number (%). CSRT, craniospinal radiotherapy; GTR, gross total resection; HDC, high-dose chemotherapy; HR, high-risk group; IQR, interquartile range; KSPNO, Korean Society of Pediatric Neuro-Oncology; MBEN, Medulloblastoma with extensive nodularity; NTR, nearly total resection; RT, radiotherapy; SHH, sonic hedgehog; SR, standard-risk group; STR, subtotal resection; WNT, wingless.
Table 3.
| 5-Year EFS (%)b) | 95% CI (%) | p-value | 5-Year OS (%)b) | 95% CI (%) | p-value | |
|---|---|---|---|---|---|---|
| Risk group | ||||||
| SR (n=23) | 86.00 | 72.5-100 | 0.108 | 95.70 | 87.7-100 | 0.074 |
| HR (n=33) | 66.40 | 52.0-84.8 | 68.30 | 53.8-86.7 | ||
| Extent of resection | ||||||
| GTR+NTR (n=40) | 79.40 | 67.6-93.2 | 0.368 | 86.70 | 76.5-98.3 | 0.286 |
| STR+biopsy (n=16) | 62.50 | 42.8-91.4 | 62.50 | 42.8-91.4 | ||
| M-stagec) | ||||||
| M0 (n=27) | 84.40 | 71.4-99.7 | 0.286 | 92.40 | 82.9-100 | 0.302 |
| M1 (n=5) | 80.00 | 51.6-100 | 80.00 | 51.6-100 | ||
| M2 (n=4) | 50.00 | 18.8-100 | 66.70 | 30.0-100 | ||
| M3 (n=20) | 64.60 | 46.6-89.6 | 64.30 | 46.2-89.5 | ||
| M0-1 (n=32) | 83.70 | 71.6-97.9 | 0.125 | 90.40 | 80.7-100 | 0.130 |
| M2-4 (n=24) | 62.20 | 45.5-85.1 | 64.70 | 47.7-87.8 | ||
| Molecular subgroups | ||||||
| WNT (n=2) | 100 | - | 0.021 | 100 | - | 0.011 |
| SHH with TP53 (n=4) | - | - | - | - | ||
| SHH without TP53 (n=2) | - | - | 100 | - | ||
| Non-WNT/Non-SHH (n=26) | 72.40 | 56.9-92.2 | 79.50 | 64.8-97.4 |
Table 4.
| 5-Year PFS (%)a) | 95% CI (%) | p-value | 5-Year DSS (%)a) | 95% CI (%) | p-value | 5-Year OS (%)a) | 95% CI (%) | p-value | |
|---|---|---|---|---|---|---|---|---|---|
| KSPNO M051 with SRb) | |||||||||
| > 80% (n=16) | 100 | - | 0.033 | 100 | - | 0.041 | 93.8 | 82.6-100 | 0.192 |
| ≤ 80% (n=7) | 68.6 | 40.3-100 | 100 | - | 100 | - | |||
| KSPNO S081 with HRc) chemotherapy | |||||||||
| > 80% (n=23) | 71.3 | 54.2-93.8 | 0.205 | 73.3 | 55.7-96.4 | 0.268 | 63.3 | 46.0-87.2 | 0.257 |
| ≤ 80% (n=10) | 90.0 | 73.2-100 | 90.0 | 73.2-100 | 80.0 | 58.7-100 | |||
| HDCd) | |||||||||
| > 80% (n=15) | 76.4 | 56.0-100 | 0.500 | 75.0 | 54.1-100 | 0.658 | 60.0 | 39.7-90.7 | 0.766 |
| ≤ 80% (n=15) | 73.3 | 54.0-99.5 | 78.6 | 59.8-100 | 70.7 | 50.2-99.6 | |||
| Totale) | |||||||||
| > 80% (n=19) | 76.4 | 58.5-99.8 | 0.972 | 79.4 | 61.2-100 | 0.743 | 66.2 | 47.4-92.4 | 0.892 |
| ≤ 80% (n=11) | 72.7 | 50.6-100 | 72.7 | 50.6-100 | 63.6 | 40.7-99.5 |


 PDF
PDF Citation
 Print
Print


 XML Download