INTRODUCTION
Rapid diagnosis of urinary tract infection (UTI) is one of the most critical issues in health-care facilities and community settings [1,2]. UTI is known to be the second most common cause of bacterial infection, only preceded by respiratory tract infection [3]. And it results in the extension of total hospital stay durations, increase in mortality and morbidity, and unwanted healthcare-associated costs, along with a high rate of antimicrobial resistance [4,5].
The diagnosis of UTI is a challenging task, because the symptoms, such as fever, nausea, vomiting, and fatigue, are not specific and may overlap with those from other infections [6,7]. In addition, laboratory diagnosis primarily relies on quantitative urine culture, which is still considered a ‘gold standard’ [1-3,610]. However, in several cases, urine culture samples collected from patients with suspected UTI yield negative results [2,6,7,11]. Moreover, conventional urine culture is time-consuming, labor-intensive, and expensive [2,6,7]. It requires 24 to 48 hours to report results; therefore, clinicians inevitably use empirical antimicrobial therapy before the culture result with antimicrobial susceptibility is reported [1,8,12].
To enhance diagnostic performance, there have been several trials conducted on the use of automated urine analyzers. Some of these analyzers showed promise in terms of diagnostic performance, and the need for urine culture could be reduced by 35%–65% either using first-generation flow cytometry analyzers, such as the UF-100 (Sysmex Corp., Kobe, Japan) [9] or second-generation flow cytometry analyzers, such as the UF1000 or UF-500 (Sysmex Corp.) [1,2,13,14]. Additionally, flow cell capture with a digital camera system, the Iris IQ200 (Beckman Coulter, Brea, CA, USA), could reduce the number of urine culture tests required by 33% to 44% [10,11]. Other digital image analyzers, such as the SediMax (A. Menarini Diagnostics, Firenze, Italy), could reduce the number of urine culture tests required by 46% to 54% [7,15]. However, the falsenegative rate varied according to the population characteristics, and this continues to be one of the limitations of such methods and requires further investigation [1,6].
Newly developed automated urine analyzers, such as the third generation flow cytometer, or digital image analyzers, are expected to lower the false-negative rate and subsequently reduce the unnecessary dependence on urine cultures, or to raise the screening positive rate to provide clinicians prompt clinical information for deciding the treatment plan. The aim of this study was to evaluate the diagnostic performance of recently introduced urine chemistry and sediment analyzers from five manufacturers compared to that of urine culture and to examine the feasibility of using these analyzers for conducting screening tests to enhance the diagnostic efficiency by reducing dependence on labor-intensive urine culture methods.
MATERIALS AND METHODS
Between October and November 2017, we obtained 528 samples of urine specimens, selected randomly from samples regularly submitted to our laboratory for routine bacterial culture collected from inpatient and outpatient clinics at Severance Hospital (Seoul, Korea). The urine samples were collected from patients using the clean catch mid-stream technique. The samples were collected in sterile culture cups without any preservative and transported to the microbiology laboratory within 30 min of collection. The specimens were cultured within 2 hours post transfer to our laboratory. This study was performed after obtaining approval from the Institutional Review Board of Severance Hospital (IRB No. 1-2017-0038), which waived the requirement for informed consent.
Gram staining was performed and the results were interpreted by trained and certified medical technologists. Bacterial culture was performed by inoculation using a 1 µL standard loop on 5% blood agar and MacConkey agar plates (Asan Pharmaceutical, Seoul, Korea) [16]. The plates were incubated in a 5% CO2 incubator at 37°C for 18 to 24 hours. The quantitative results were expressed in terms of CFU/mL and the negative results (no countable colonies on inoculated plates) were expressed as ‘< 1,000 CFU/mL’. An inoculated plate producing > 1,000 CFU/mL represented a positive culture result, and was further evaluated for bacterial identification using conventional biochemical tests, the Vitek 2 system (bioMérieux, Marcy l'Etoile, France), and/or matrix-assisted laser desorption/ionization time of flight mass spectrometry, the VITEK MS MALDI-TOF system (Vitek MS, bioMérieux Inc., Durham, NC, USA).
Immediately after inoculation for bacterial culture, the remaining samples were subjected to urinalysis. Specimens that were transferred after 4 P.M. on the day of examination were refrigerated at 4°C until the culture was performed the following morning. At least 15 mL of each urine specimen was serially analyzed with five automated urine chemistry and sediment analyzers without centrifugation.
Five recently introduced automated urine chemistry and sediment analyzers were evaluated in terms of their diagnostic performance; the UC-3500 and UF-5000 from Sysmex Corporation (Kobe, Japan), CLINITEK Novus and UAS800 from Siemens Healthineers (Erlangen, Germany), Cobas® u601 and Cobas® u701 from Roche Diagnostics International (Rotkreuz, Switzerland), iChem® VELOCITYTM and iQ®200SPRINT from Beckman Coulter (Brea, CA, USA), and URiSCAN® Super+ and URiSCAN® PlusScope from YD diagnostics (Yongin, Korea), respectively. The measurement principles of the five urine sediment analyzers are as follows; flow cytometry for the UF-5000, digital camera imaging followed by automatic image evaluation module for the UAS800 and Cobas® u701, flow cell capture by digital camera followed by the use of the Auto-Particle Recognition (APRTM) software for the iQ®200 SPRINT, and multicounting chamber and microscopic imaging for the URiSCAN® PlusScope. For comparison, the UF-1000i (Sysmex Corporation) urine sediment analyzer currently in use at our laboratory was also evaluated.
Performance with respect to the additional parameters was evaluated as follows; the differentiation between gram-positive and gram-negative organisms using the UF-5000, the differentiation of rods and cocci using the UAS800, and the analysis of all small particles (ASP) using the iQ®200SPRINT.
‘Significant bacteriuria’ was characterized by ≥ 104 CFU/mL from all specimens [8,17,18] in the corresponding inoculated plates, or ≥ 103 CFU/mL from specimens that were collected from patients with a Foley catheter or with urinary symptoms (fever of unknown origin, difficulty in urination, urinary urgency or frequency, dysuria, and flank pain among others) [19].
A specimen with all indicators positive was characterized by positive results as follows: leukocyte esterase (LE), nitrite in urine chemistry analysis, white blood cell (WBC) ≥ 10/µL [20], and bacteria positive (apart from ‘negative’) in urine sediment analyzers based on the cut-offs or criteria defined by each manufacturer [11,17]. Any specimen with all indicators negative was characterized by negative results for the above mentioned indicators.
All the urine sediment analyzers could provide numeric WBC counts (per µL). When our experiments were conducted, the Cobas® u701, URiSCAN® PlusScope, and iQ®200SPRINT did not display the quantitative bacterial counts. However, the iQ®200SPRINT provided the ASP values for estimating of the presence of bacteria. Owing to these reasons, the semi-quantitative results for bacteria were compared, and the results ‘1+’, ‘2+’, and ‘3+’ were considered ‘positive’.
The UF-1000i, UF-5000, and UAS800 also provided numeric values for the bacterial count, and the iQ®200SPRINT provided the ASP values instead. The Cobas® u701 and URiSCAN® PlusScope did not provide the quantitative bacterial counts when our experiments were conducted. The potential of diagnosing UTI using bacterial count or ASP was evaluated by analyzing the receiver operating characteristic (ROC) curves.
Statistical analysis was performed using SPSS version 25.0 (IBM Corp., Armonk, NY, USA) and Microsoft Excel 2016 (Microsoft Corp, Redmond, Washington, USA) with Analyse-it version 5.11 (Analyse-it Software, Ltd., Leeds, UK). For categorical data, data distributions are presented as frequencies and percentages and compared using the Chi-square test. Data distributions were confirmed as normal by the Kolmogorov-Smirnov test, and a P value greater than 0.05 indicates normal distribution. For parametric data, results are presented as means ± standard deviations (SDs), and comparisons were performed using Student’s t-test, and for non-parametric data, results are presented as medians and interquartile ranges (IQRs), and comparisons were made using the Mann-Whitney U test. The ROC curve analysis was used to compare the abilities of various parameters, and the area under curve (AUC) values were compared in the diagnostic ability for UTI. Additionally, the 95% confidence intervals (CIs) of each item were also calculated. P < 0.05 was considered significant.
RESULTS
Of the 528 urine culture specimens collected, 2 were excluded owing to suspected contamination (more than 3 species were detected in the inoculated plate) and 16 were excluded as they tested positive for yeast. Baseline characteristics of 510 study subjects are provided in Table 1. Among the 71 specimens categorized under ‘significant bacteriuria’, 31 (43.7%) specimens were gram-positive and 40 (56.3%) were gramnegative. Distribution of test results in urine samples with ‘significant bacteriuria’, stratified by bacterial strain is displayed in Supplemental Data Table S1.
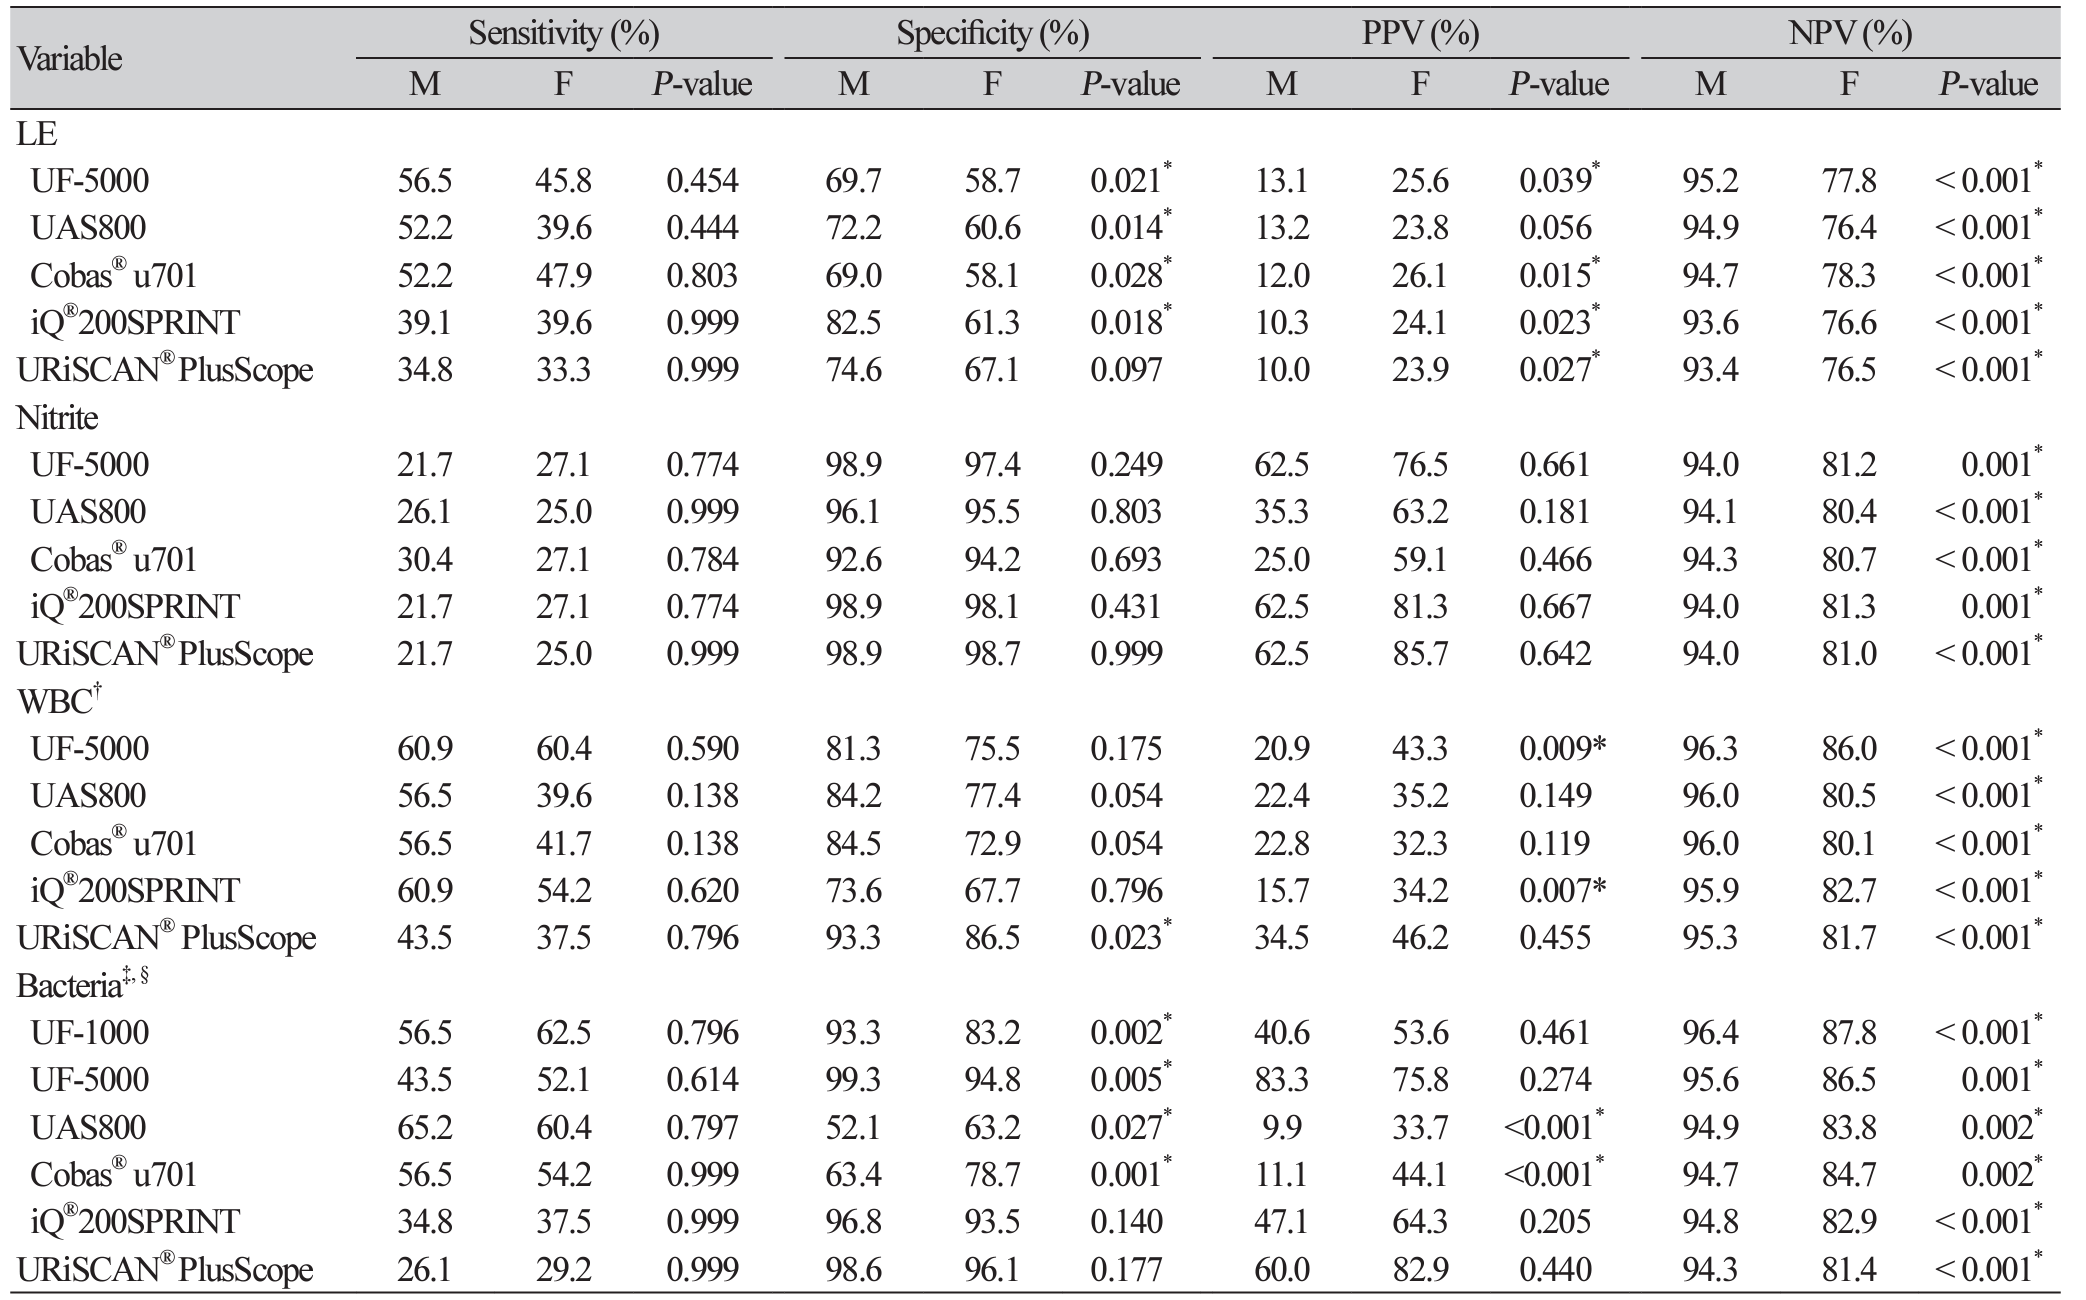
The distribution of semi-quantitative results based on UTI diagnosis (‘significant bacteriuria’ and ‘no growth/non-significant bacteriuria’) is displayed in Supplemental Data Table S2. Additionally, the diagnostic performances of an indicator studied individually, such as LE, nitrite, WBC, and bacteria, were also evaluated (Table 2). For comparing results on bacteria, ‘1+’, ‘2+’, and ‘3+’ were considered ‘positive’.
In addition, the Gram stainability of specimens yielding positive/negative results in the UF-5000 and the morphological information of cocci/ rods evaluated using the UAS800 were also evaluated. The results from the UF-5000 exhibited an 82.9% (95% CI, 67.3%-91.9%) agreement with a kappa value of 0.62 (95% CI, 0.37-0.87) compared to those from conventional Gram staining experiments. The results from the UAS800 exhibited a 50.0% (95% CI, 35.5%-64.5%) agreement with a kappa value of 0.51 (95% CI, 0.36-0.66) compared with the bacterial identification results (data not shown).
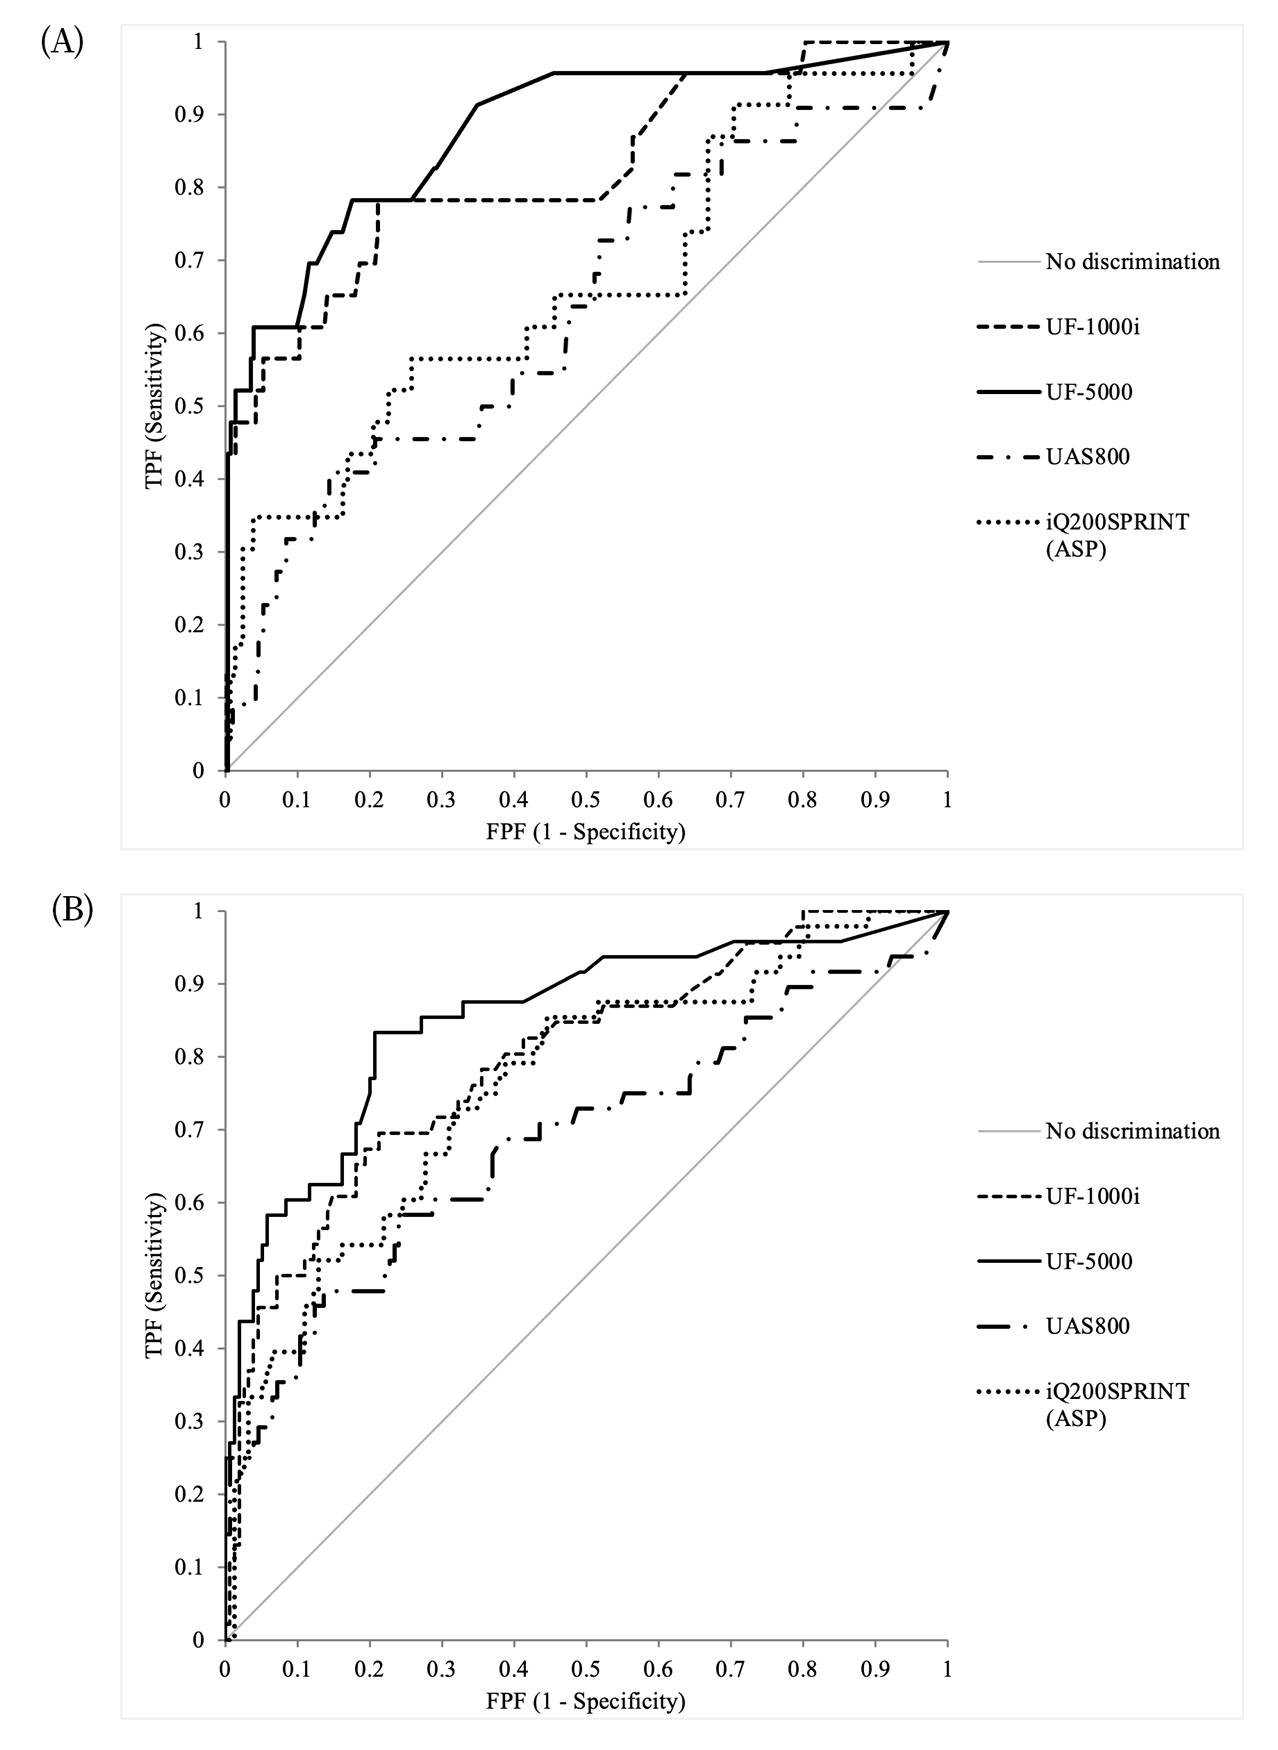
For numeric bacterial counts (UF-1000i, UF5000, UAS800) and ASP (iQ®200SPRINT), the determinative ability for ‘significant bacteriuria’ was evaluated based on the ROC analysis (Fig. 1). And, to determine an optimal cut-off to rule out UTI and eliminate the unnecessary urine culture step, or to include UTI and subsequently to suggest a suitable antibiotic treatment, we evaluated the diagnostic performances of indicators used in conjunction and after adjusting the cut-off values for the WBC and bacterial counts. The cut-off values for achieving certain target variables with the automated urine sediment analyzers were calculated, and those that met 95% sensitivity and 70% PPV are summarized in Table 3. The readings of the WBC count from all urine sediment analyzers were analyzed to estimate the ideal cut-off values; however, for bacteria, only the UF-5000, UAS800, and iQ®200SPRINT (ASP) were analyzed.
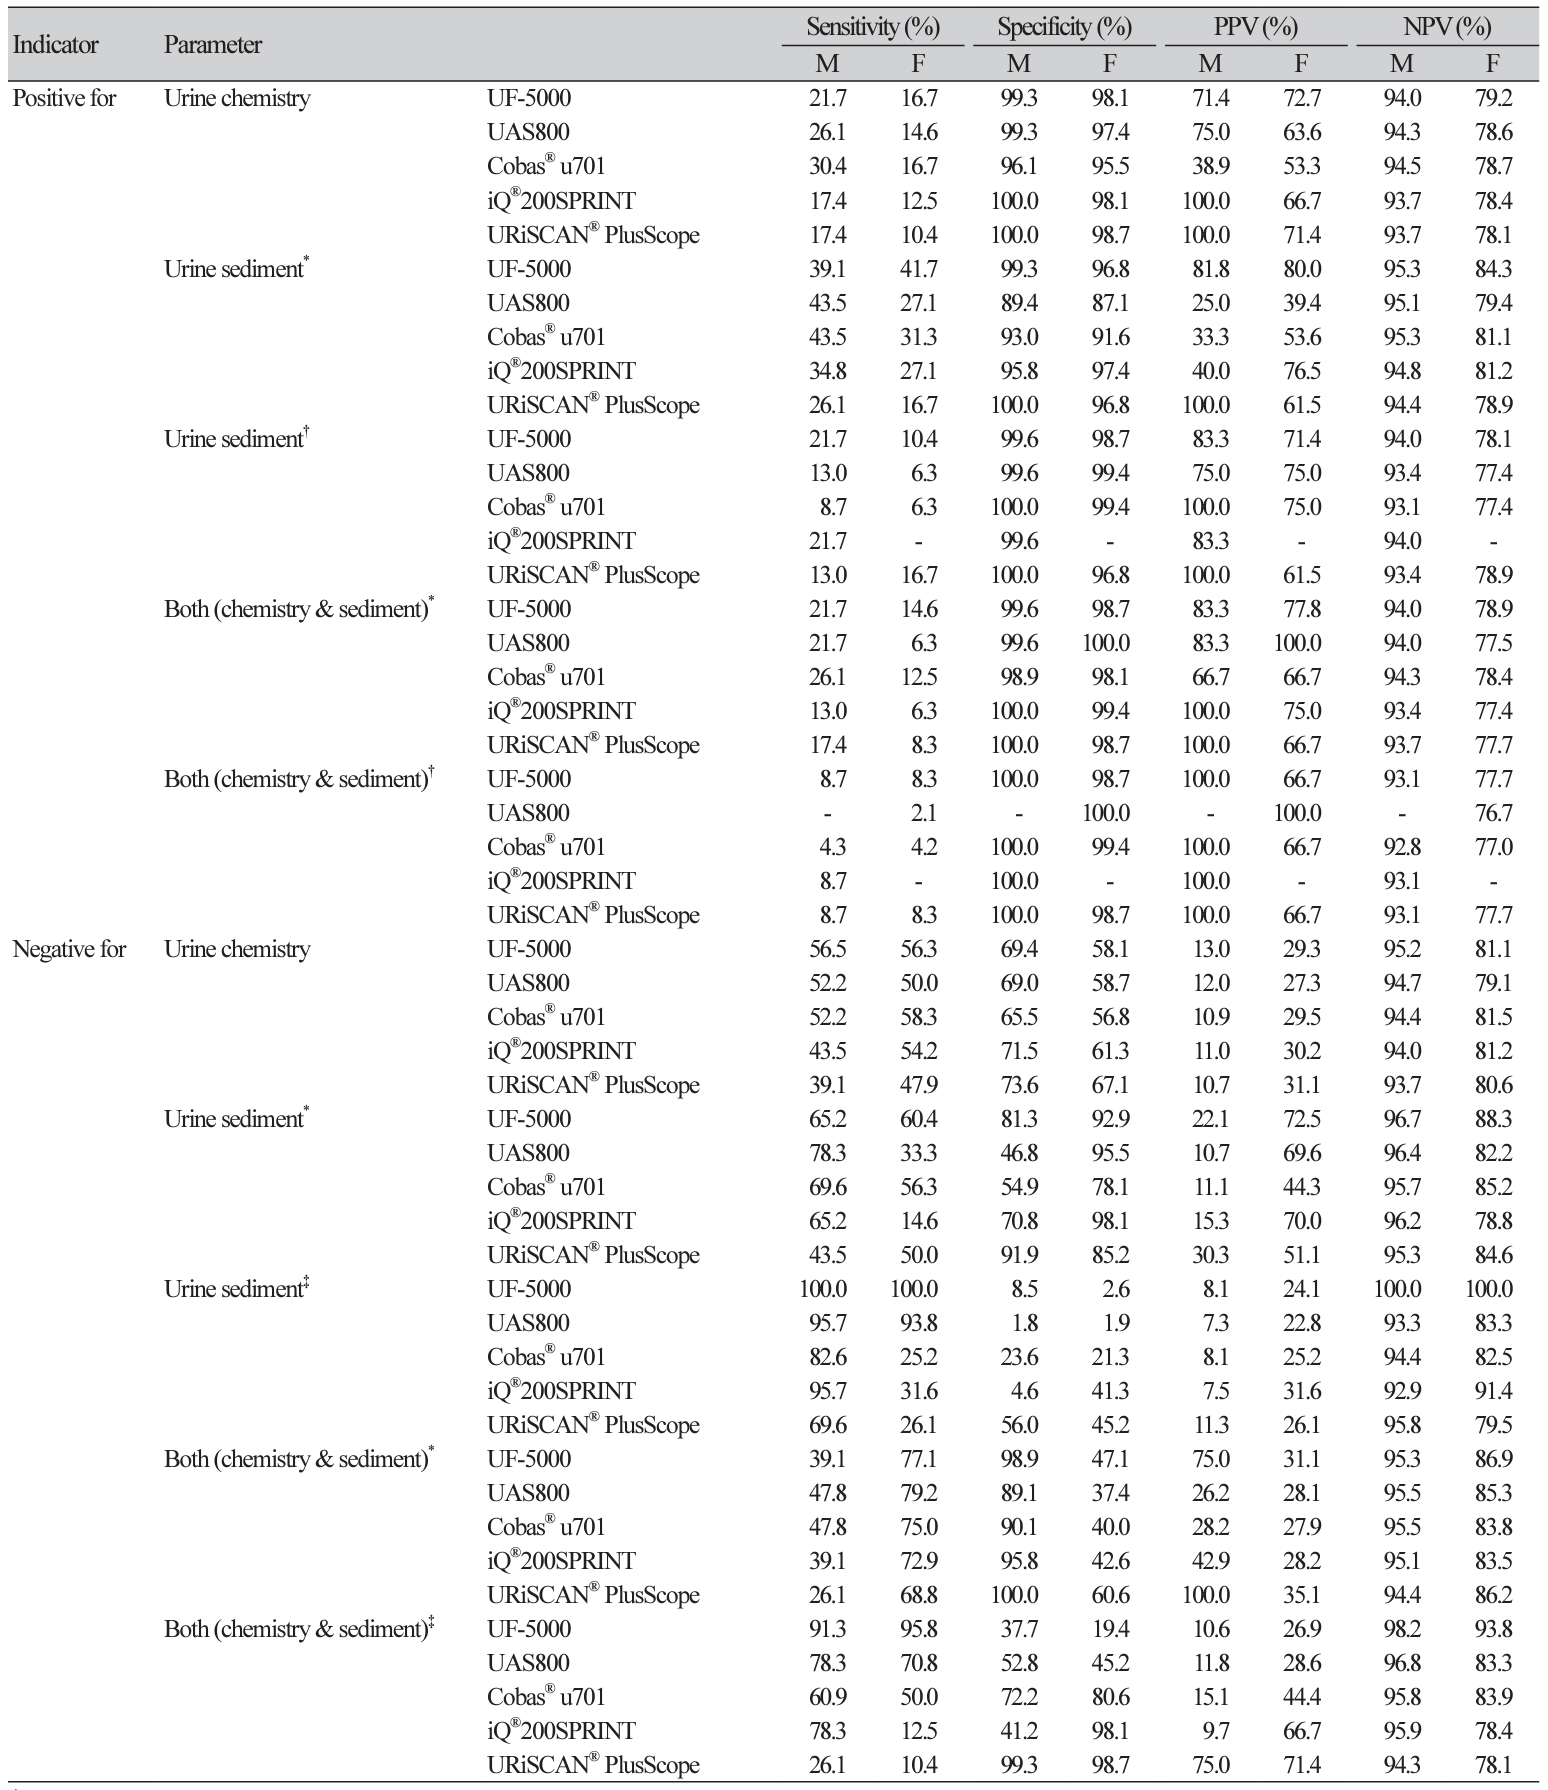
To identify the specimens that were highly likely to yield positive or negative results and did not require further culture, the diagnostic performance for the indicator combinations were also evaluated (Table 4). The positive predictive values (PPVs) for specimens with all indicators positive were 66.7%-100%, and after adjusting cut-offs corresponding to 70% PPV, the PPVs increased up to 100% for all analyzers for males. However, the negative predictive values (NPVs) were approximately 76%-78% both before and after adjusting the cut-off values for females. The NPVs for specimens with all indicators negative were 94.4%95.5% and 83.5%-86.9% for males and females, respectively. After adjusting the cut-offs corresponding to 95% sensitivity, the NPVs were 94.3%-98.2% and 78.1%-93.8% for males and females, respectively.
DISCUSSION
Urine culture has played a major role in the diagnosis of UTI. However, as described above, owing to the high workload and the high costs associated with this method, the use of alternatives for conventional urine culture is necessary. Rapid detection methods are also necessary to determine whether antimicrobial chemotherapy should be administered, and if so, to select the antimicrobial agent precisely. In recent years, the combined use of automated urine chemistry and sediment analyzers has increased to reduce the frequency of unnecessary urine culture [2,13,14,21,22]. Technical advances in the development of automated urine analyzers have made urinalysis easier and more rapid to reduce the number of tests conducted using manual processing methods, including manual microscopy, in several automated clinical laboratories. However, the high rate of false-negative results and the insignificant reduction in dependence on manual methods did not warrant the UF-1000i as a suitable UTI screening test in a particular study [1]. Although the WBC and bacterial counts determined by flow cytometric analysis are useful indicators of UTI, a systemic review recommended rigorous additional studies [6]. Automated urine sediment analyzers may be useful for UTI screening in an ambulatory patient population; however, these may not be as efficient in a complex hospitalized patient population [23]. Rapid screening with automated urine sediment analyzer may not be applicable to certain populations, such as those comprising patients with indwelling catheter, pregnant women, and male outpatients, or a different diagnostic algorithm may be necessary [7].
In this study, we evaluated the diagnostic performances of recently introduced urine chemistry and sediment analyzers, and aimed to determine the potential of their application in clinical laboratories. Methods using digital camera imaging and flow cytometry were evaluated simultaneously. As discussed in previous studies, flow cytometry showed better diagnostic accuracy for UTI diagnosis than digital camera imaging did. The UF-5000 was reported to be a useful and accurate in analyzing conditions related to various pathological processes of the kidneys and urinary tract [24]. It performed better than UF-1000i in terms of bacterial count determination, specificity of urinary tract infection diagnosis, and differentiation between gram-positive and negative bacteria. The Sysmex UF series instruments are based on the principle of forward and side scatter and fluorescence intensity, which facilitates accurate particle identification and precise cell counts, especially for bacteria. Digital camera imaging is based on centrifugation, imaging, and interpretation techniques. It produces reliable results for detection of several types of sediments; however, overestimation remains one of its limitations. Cocci bacteria seem to be overestimated owing to artifacts in the digital camera system. However, in the UAS800, if only rod bacteria (> 130/µL) are considered for the “bacteria positive” outcomes, the overestimation can be minimized with an increase in specificity (from 56.0% to 99.8%) and PPV (from 18.6% to 90.1%), although the sensitivity (from 62.0% to 15.5%) and NPV (from 90.1% to 88.0%) are reduced (data not shown). Meanwhile, the iQ®200SPRINT is based on the principle of flow cell capture, in which urine samples pass through the flow cell sheath, similar to flow cytometry. In this study, the diagnostic accuracy of the iQ®200SPRINT was better than the accuracy of analyzers based on digital camera imaging.
Moreover, we evaluated the additional parameters in this study. The newly developed feature of the UF5000 of distinguishing between gram-positive and gram-negative microorganisms yielded relatively reliable results (Cohen’s kappa = 0.62) compared to those from conventional Gram staining. In combination with diagnostic accuracy for bacterial detection, the UF-5000 is also expected to reduce the dependence on urine culture, better than or at least comparable to the UF-1000i. The UAS800 introduced a parameter for the morphologic distinction between rods and cocci, but showed the limited imaging capacity; such results require further advanced resolution and particle recognition techniques.
ASP detection is a unique parameter of the iQ®200SPRINT for the estimation of microorganisms. ASP represents particles smaller than 3 μm that cannot be identified by the APRTM software. Large-sized particles such as crystals, cast, yeast, and bacteria may be recognized by the APRTM software. Small particles might form a part of such sediments. In particular, an elevated ASP count correlates with the possibility of infection, and ASP count is proportional to the WBC or bacterial counts in several cases [17]. The present study also demonstrated the utility of ASP with or without other indicators in UTI diagnosis.
The diagnostic utility of each indicator alone or in conjunction with other indicators was also evaluated to determine the optimal cut-off for reducing unnecessary urine culture. The diagnostic utilities of automated urine analyzers for each indicator varied according to the type of sediment analyzer.
For analyzing specimens that are highly likely to be characterized positive or negative and do not need further culture, we further evaluated the diagnostic performances using combinations of indicators and by adjusting cut-off values. The PPVs for specimens with all indicators positive increased up to 100% in males after adjusting the cut-off values, whereas the PPVs did not increase in females. The NPVs for specimens with all indicators negative were approximately 94.3%–98.2% in males and 78.1%–93.8% in females after adjustment of cut-off values. The replacement of conventional urine culture with automated urine analyzers is yet to be supported by satisfactory results; however, all negative results for these parameters would reduce the need for presumptive antibiotics usage [1].
In this study, we applied different cut-off values for bacterial counts for specimens collected from males and females. A previous study has reported that specimens from females showed lower AUC values than those from males when the same cut-off values were applied [25]. This could be attributed to a greater chance of bacterial contamination of urine sample in females; however, the presence of asymptomatic pyuria in some women should also be considered [20]. In previous studies that evaluated the cut-off values for specimens from males and females separately, a higher cut-off value was reported for specimens from females than for those from males [2,7,18]. Owing to these reasons, we analyzed the data differently based on gender by calculating different gender-specific cut-off values for bacterial counts, and applied the same to the primary analysis.
The limitations of this study are as follows. 1) Although we evaluated a significant number of urine specimens (n = 510), there were only 71 cases of true infection (13.9%), which might not be adequate for comparing various microorganisms using the recently upgraded features in the instruments, such as the differentiation of gram-positive or gram-negative bacteria, or adequate statistical power for the combination of certain parameters, such as the presence of LE or nitrite, or the WBC and bacteria counts. 2) Some of the cultured microorganisms were not identified based on genus or species as we considered them as contaminants.
To the best of our knowledge, the present study is the first to compare the five recently launched automated urine analyzers and the diagnostic utility of flow cytometry and digital camera imaging in UTI. As sensitive and rapid diagnostic tools, urine sediment analyzers can be one of the important tools in the near future, and could help reduce unnecessary culture and provide guidance for the selection of proper antimicrobial agents.


 PDF
PDF Citation
 Print
Print


 XML Download