Introduction
Methods
Data collection and patient population
Outcomes
Statistical analysis
Results
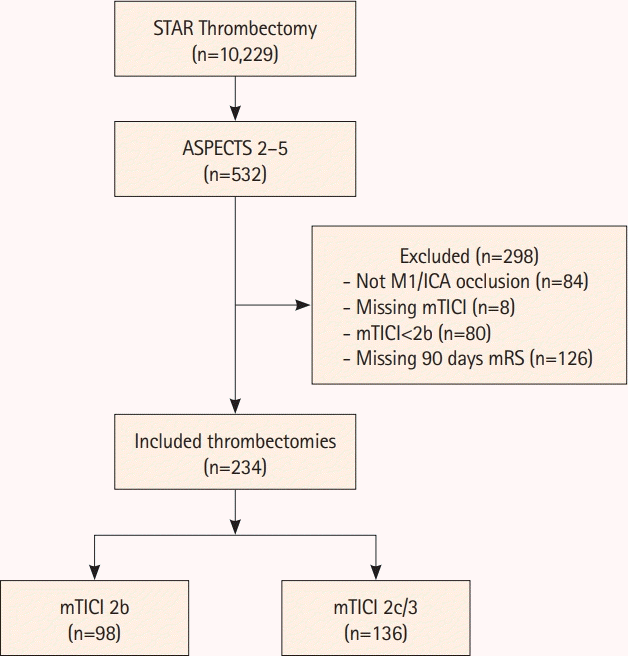
 | Figure 1.Patient selection flow chart. STAR, Stroke Thrombectomy and Aneurysm Registry; ASPECTS, Alberta Stroke Program Early Computed Tomography Score; M1, M1 segment of the middle cerebral artery; ICA, internal carotid artery; mTICI, modified Thrombolysis in Cerebral Infarction; mRS, modified Rankin Scale. |
Patient characteristics
Table 1.
Data are expressed as median [interquartile range] or number of cases (%).
ASPECTS, Alberta Stroke Program Early Computed Tomography Score; ICA, internal carotid artery; M1, middle cerebral artery; mTICI, modified Thrombolysis in Cerebral Infarction; NIHSS, National Institutes of Health Stroke Scale; IV-tPA, intravenous tissue plasminogen activator; CTA, computed tomography angiography; CTP, computed tomography perfusion; DWI, diffusion-weighted imaging; ADAPT, A Direct Aspiration first Pass Technique; IAtPA, intra-arterial tissue plasminogen activator.
Outcomes
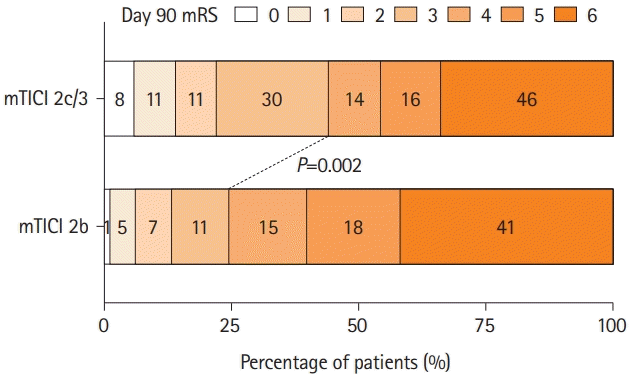
 | Figure 2.Scores on the mRS at 90 days for low ASPECTS patients who underwent mechanical thrombectomy for internal carotid artery or M1 occlusion with achievement of recanalization grade of mTICI 2b versus 2c/3. mRS, modified Rankin Scale; ASPECTS, Alberta Stroke Program Early Computed Tomography Score; M1, middle cerebral artery; mTICI, modified Thrombolysis in Cerebral Infarction. |
Table 2.
| Outcome | mTICI 2c/3 (n=136) | mTICI 2b (n=98) | Crude OR (95% CI) | P | Adjusted OR* (95% CI) | P |
|---|---|---|---|---|---|---|
| mRS 0–3 | 60 (44.1) | 24 (24.5) | 2.43 (1.39–4.37) | <0.01 | 2.35 (1.18–4.81) | 0.02 |
| mRS 0–2 | 30 (22.1) | 13 (13.3) | 1.85 (0.93–3.88) | 0.09 | 1.78 (0.77–4.31) | 0.20 |
| Neurological improvement at 24 hours† | 59 (55.7) | 23 (34.8) | 2.35 (1.25–4.48) | <0.01 | 2.01 (1.04–4.28) | 0.04 |
| Neurological improvement at discharge† | 65 (62.5) | 29 (43.3) | 2.18 (1.17–4.11) | 0.01 | 2.76 (1.31–6.01) | <0.01 |
| Symptomatic intracranial hemorrhage | 20 (14.7) | 13 (13.5) | 1.10 (0.52–2.39) | 0.80 | 1.30 (0.58–3.04) | 0.60 |
| Any hemorrhage | 55 (40.7) | 37 (38.5) | 1.10 (0.64–1.88) | 0.70 | 1.03 (0.57–1.85) | 0.70 |
| Distal embolization | 15 (11.3) | 35 (38.0) | 0.21 (0.10–0.40) | <0.01 | 0.16 (0.07–0.34) | <0.01 |
| 90-Day mortality | 46 (33.8) | 41 (41.8) | 0.71 (0.42–1.22) | 0.20 | 0.68 (0.38–1.24) | 0.20 |
Data were expressed as number of cases (%), unless otherwise indicated.
ASPECTS, Alberta Stroke Program Early Computed Tomography Score; ICA, internal carotid artery; M1, middle cerebral artery; mTICI, modified Thrombolysis in Cerebral Infarction; OR, odds ratio; CI, confidence interval; mRS, modified Rankin Scale; NIHSS, National Institutes of Health Stroke Scale; IV-tPA, intravenous tissue plasminogen activator.
Subgroup analysis of mTICI 3 versus mTICI 2c
Table 3.
| Outcome | mTICI 3 (n=103) | mTICI 2c (n=33) | Crude OR (95% CI) | P | Adjusted OR* (95% CI) | P |
|---|---|---|---|---|---|---|
| mRS 0–3 | 43 (41.7) | 17 (51.5) | 0.67 (0.30–1.48) | 0.30 | 1.01 (0.34–3.10) | >0.99 |
| mRS 0–2 | 22 (21.4) | 8 (24.2) | 0.85 (0.35–2.24) | 0.70 | 0.84 (0.24–3.25) | 0.80 |
| Neurological improvement at 24 hours† | 43 (54.4) | 16 (59.3) | 0.82 (0.33–1.98) | 0.70 | 1.03 (0.34–3.14) | >0.99 |
| Neurological improvement at discharge† | 48 (59.3) | 17 (73.9) | 0.51 (0.17–1.38) | 0.20 | 0.39 (0.07–1.63) | 0.20 |
| Any hemorrhage | 38 (37.3) | 17 (51.5) | 0.56 (0.25–1.23) | 0.15 | 0.46 (0.16–1.24) | 0.13 |
| Symptomatic intracranial hemorrhage | 13 (12.6) | 7 (21.2) | 0.54 (0.20–1.55) | 0.20 | 0.36 (0.11–1.15) | 0.08 |
| 90-Day mortality | 37 (35.9) | 9 (27.3) | 1.49 (0.65–3.71) | 0.40 | 0.74 (0.24–2.28) | 0.60 |
Data were expressed as number of cases (%), unless otherwise indicated.
ASPECTS, Alberta Stroke Program Early Computed Tomography Score; ICA, internal carotid artery; M1, middle cerebral artery; mTICI, modified Thrombolysis in Cerebral Infarction; OR, odds ratio; CI, confidence interval; mRS, modified Rankin Scale; NIHSS, National Institutes of Health Stroke Scale; IV-tPA, intravenous tissue plasminogen activator.
Multivariate analysis
Table 4.
mRS, modified Rankin Scale; OR, odds ratio; CI, confidence interval; NIHSS, National Institutes of Health Stroke Scale; mTICI, modified Thrombolysis in Cerebral Infarction; ASPECTS, Alberta Stroke Program Early Computed Tomography Score; IV-tPA, intravenous tissue plasminogen activator; ICA, internal carotid artery.


 PDF
PDF Citation
 Print
Print


 XML Download