

 PDF
PDF Citation
 Print
Print


INTRODUCTION
Existing resin composite restorations generally fail as a result of polymerization contraction, marginal leakage, and secondary caries [1]. Although marginal gaps and their associated microleakage may not be a primary causative factor of secondary caries, marginal gaps may contribute to the formation of wall lesions (zones of demineralization between the restoration and the cavity wall leading to secondary caries) [23]. Marginal gap formation has been suggested as a possible predisposing factor in the development of secondary caries at the tooth-restoration marginal interface [24]. One of the suggested solutions for the polymerization-associated marginal gap was the development of composite materials with reactive fillers that protect the tooth against secondary caries by depositing apatite in the marginal gap of the restoration [1]. These are referred to as “bioactive restoratives [5].”
The bioactivity of such materials was defined differently among authors: some stated that the material should contain phosphate to form apatite at neutral pH, while others linked the material bioactivity to the formation of apatite when immersed in phosphate-based solutions as simulated body fluids (SBF) [16]. Vallittu et al. [5] defined bioactivity as a material capable of forming hydroxyl apatite mineral on its surface both in vitro and in vivo, regardless of whether mineralizing ions are released from the biomaterial itself or are already present in the liquid microenvironment.
The manufacturer claims that Activa BioActive-Restorative (Pulpdent, Watertown, MA, USA) belongs to this category. While some authors confirm that Activa cannot induce apatite formation, others reported that this material can release more phosphate ions than other bioactive materials currently on the market [17]. These controversies raised the importance of studying in detail the interaction of this material with the tooth structure in different immersion solutions, considering that the external environment influences the bioactivity and/or physical properties (sealing ability) of any material.
Regardless of the immersion solution, many studies investigated the bioactivity using discs of the materials to be studied [168]. However, the benefits of the bioactivity in enhancing the sealing potential of a marginal interface with apatite should be considered in the context of its efficacy in preventing the formation of secondary caries in the restored tooth and of the bacterial access to the dentinal tubules and ultimately the pulp itself [2]. Furthermore, ion-leaching restorative materials encourage remineralization along the margins between the restoration and the tooth, due to their ability to release ions such as fluoride, calcium, and phosphorus, and should be tested accordingly [9].
For detection of the bioactivity, scanning electron microscope-energy dispersive spectroscopy (SEM-EDX) provides a semi-quantitative analysis, allows visualization of the morphology of apatite deposits on the material surface, and can monitor variations in the chemical composition of the material/tooth interface [610]. Although SEM-EDX requires prior dehydration of specimens, it is a sensitive method that may detect early very thin and superficial deposits [6]. Measuring the microhardness of enamel and dentin allows the detection of changes in consistency at the tooth surface, and in the area next to restorations performed with ion-releasing materials [1011].
Based on the data in the literature and considering that no study to date has extensively studied the interaction of the tested material with the tooth structure when used for restorations performed following the manufacturer’s most recent instructions and subsequently immersed in different fluids, this study aimed to investigate the elemental analysis and microhardness of Activa and marginal enamel, and dentin after storage in different immersion fluids. The null hypothesis was that there would be no difference in the elemental analysis or microhardness of Activa, marginal enamel and dentin when immersed in different media for 3 months.
MATERIALS AND METHODS
Materials
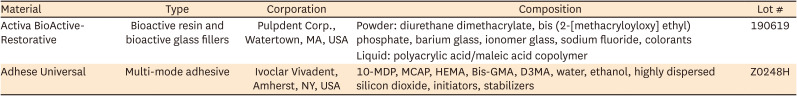
The current study tested one commercially available bioactive restorative material (Activa BioActive-Restorative; Pulpdent), hereafter referred to as Activa. A detailed description of the material and the used universal adhesive is presented in Table 1.
Table 1
Material used in the study
Cavity preparation
Fifteen human lower molars of approximately similar dimensions that had been recently extracted due to periodontal disease were included in this study. These molars were examined under a stereomicroscope to confirm they were free of caries and cracks, were cleaned with an ultrasonic scaler to remove soft tissue and calculus deposits, and were stored in 0.5% Chloramine T solution until examined experimentally. All teeth were used within 6 months of their extraction. The teeth were collected with the approval of the University of Tennessee Health Science Center Institutional Review Board (No. 22-08670).
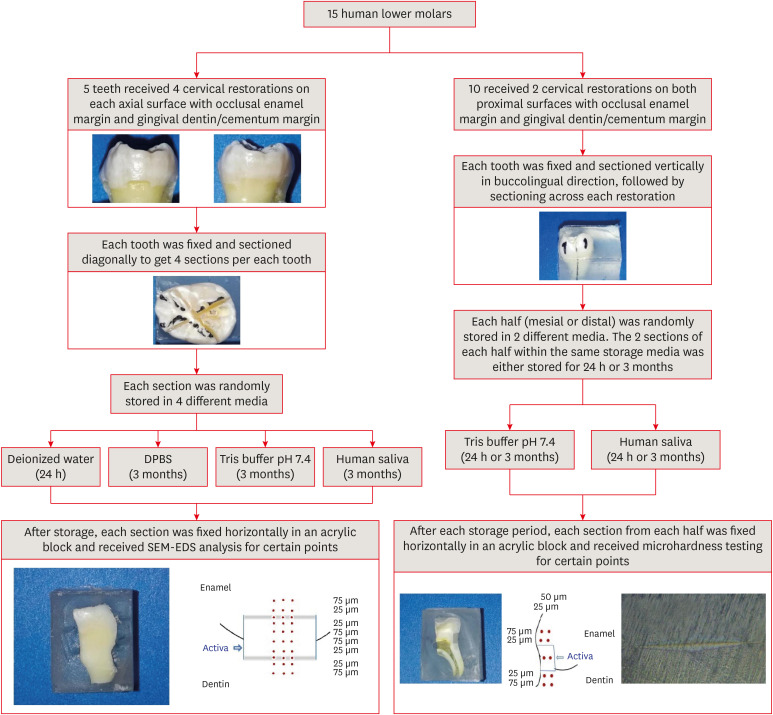
The teeth were randomly divided into 2 groups according to the laboratory test to be performed, elemental analysis (n = 5) or microhardness (n = 10). For the elemental analysis specimens, each tooth received 4 cervical box-shaped cavities with the same dimensions on buccal, lingual, mesial, and distal surfaces. For the microhardness specimens, each tooth received 2 simple proximal cavities with the same dimensions as those of the elemental analysis specimens. All cavity preparation procedures were performed using a #330 tungsten carbide bur (DFG330, Henry Schein, Inc., Melville, NY, USA) under copious water coolant with a high-speed handpiece (SN 2018-1041978, W&H, Bürmoos, Austria); the bur was replaced with a new 1 after the preparation of every 5 cavities. A pencil was used to mark the outline before the preparation. The cavity dimensions were as follows: occlusal and gingival length, 3 mm each; axial depth, 1.5 mm; and occluso-gingival height, 2 mm with 1 mm below the CEJ, providing an occlusal enamel margin and gingival dentin/cementum margin (Figure 1) [1]. The margins were not beveled, with slightly rounded line angles. The dimensions were calculated using a graduated periodontal probe (PCPUNC127, Hu Friedy, Chicago, IL, USA) [12]. After preparation, the cavities were examined for any defects.
Restorative procedures
After preparation, each cavity was washed with water and dried. The enamel margins of all specimens were selectively etched with 37% phosphoric acid (N-Etch, Ivoclar Vivadent, Amherst, NY, USA) for 15 seconds, rinsed with water for 15 seconds, and gently dried with oil-free air without desiccation. A universal adhesive (Adhese Universal, Ivoclar Vivadent, Amherst, NY, USA) was then applied to all cavity surfaces, air-thinned, and light cured as recommended by the manufacturer with an LED curing light (Elipar Deep Cure, 3M Oral Care, St. Paul, MN, USA) operating at 1,200 mW/cm2 that was checked after every 5 samples with a radiometer (Demetron L.E.D. Radiometer, Kerr Corp., Orange, CA, USA). All cavities were subsequently restored with the tested material using a bulk technique (Figure 1). The material was mixed, dispensed, and cured according to the manufacturer’s instructions.
All specimens were stored in deionized water at 37°C for 24 hours in an incubator (Isotem, Thermo Fisher Scientific, Waltham, MA, USA) prior to finishing and polishing of the restorations and removal of any visible overhangs with Al2O3 discs (Extra-Thin Sof-Lex discs, 3M ESPE, St. Paul, MN, USA) using a low-speed handpiece (A4209792, Brasseler USA, Georgetown, GA, USA) under water cooling [13]. All preparation and restoration procedures were performed by a single operator using magnification (×4 loupes, Amtech, Wenzhou, China) and LED headlight illumination.
Teeth sectioning
The roots of all teeth were fixed vertically 3 mm below the CEJ in fast self-curing acrylic blocks (SamplKwick, Buehler, Lake Bluff, IL, USA) to facilitate the sectioning. Tooth specimens for elemental analysis were each prepared by making 2 vertical diagonal cuts per tooth with a slow-speed diamond saw (IsoMet High-Speed Pro, Buehler) cooled with water (Figure 1) to produce 4 sections, each of which contained one restored cavity. Tooth specimens for the microhardness analysis were each prepared by making one vertical buccolingual cut to produce mesial and distal halves, each of which contained one restored cavity, followed by a longitudinal cut in the middle of the restoration to obtain 2 sections per half (Figure 1) [10]. All sections were then removed from the remaining fixation block parts and ultrasonically cleaned prior to the storage step.
Experimental grouping
For the elemental analysis, the 4 tooth sections were randomly divided into 4 experimental groups according to the storage media used (n = 5), namely 1) deionized water (ACME Analytical Solutions, Hayward, CA, USA); 2) Dulbecco's phosphate buffered saline (DPBS) (Sigma–Aldrich GmbH, Schnelldorf, Germany); 3) Tris buffer pH 7.4 (Sigma–Aldrich GmbH); and 4) human saliva that had been collected from 1 healthy donor who had no active periodontal diseases or caries and had not been on any medication for 3 months prior to the study. The saliva was freshly collected in an ice-chilled tube at 8:00 a.m. on each day of the experiment or media change, using paraffin chewing stimulation, and its pH was measured before each use using a pH meter (SevenExcellence pH meter, Mettler Toledo, Greifensee, Switzerland) [14]. All commercial storage media were used as received without any further treatment. Each tooth section was immersed in its corresponding group storage media and kept in a hermetically sealed container that was immersed in a 37°C water bath (Model 2321, Thermo Fisher Scientific); the deionized water group was incubated for 24 hours, while the rest of the media groups were incubated for 3 months. The saliva was changed daily, while the rest of the media was renewed every week until the endpoint time [614]. Replenishing the media in part mimics the turnover of saliva in the mouth [1].
For the microhardness specimens, the 2 halves of each tooth produced by sectioning (each in 2 pieces) were randomly divided into 2 groups, according to the storage media used (n = 10): 1) Tris buffer, pH 7.4 or 2) human saliva. One piece of each half was randomly selected for removal after 24 hours (n = 10) and the other after 3 months (n = 10).
Elemental analysis
At the end of each group storage period, each section was rinsed thoroughly with deionized water for 3 minutes to remove loosely adhered precipitates, dried, and mounted horizontally in an acrylic block with the restored surface facing upward (Figure 1). All specimens were dehydrated in a desiccator (Vacuum Desiccator, Bel-Art Products Inc., Wayne, NJ, USA) with silica for 24 hours and analyzed at an accelerated voltage of 20.0 kV and ×500 magnification in a SEM (Zeiss EVO HD15, Carl Zeiss, Oberkochen, Germany) equipped with EDS (Oxford Instruments, Abingdon, UK) and AZtecLive software (Oxford Instruments) without Au-coating and using low vacuum, considering the report by Tiskaya et al. [1] that the sputter coating with gold may interfere with the phosphorus determination by EDS [3]. The Live time was 100–200 seconds, dead time was 20%–25% and the x-ray counts per second were 3,500–6,000 counts/sec. The SEM-EDS analysis quantified the levels of calcium, phosphorus, silica, and fluoride in 3 different areas of each specimen; the tooth structure (enamel or dentin), the Activa restoration, and the interface between the restoration material and the tooth structure (adhesive layer). The EDS was performed by collecting 15 dot scans of each image, 3 at the adhesive layer, and another 6 for each of the tooth structure and the tested material, at either 25 or 75 μm vertical distance from the interface (3 at each distance) [1015]. Each 3 dot scans within the same substrate/vertical distance were performed at the same horizontal distance from one another. At each substrate/vertical distance, the relative average weight percentages (wt%) of the identified element was calculated, based on the average of the 3 horizontal dot scans.
Microhardness test
At the end of the appropriate storage period (24 hours or 3 months), each section was fixed horizontally in an acrylic resin block with the restored part facing upward and polished with silicon carbide sandpapers of varying roughness (P600, P800, and P12,000) using a polishing unit (EcoMet 30, Buehler) (Figure 1). After polishing, each specimen was viewed at ×40 magnification using a microscope (SteREO Discovery.V8, Carl Zeiss) equipped with ×10, ×20, and ×40 eyepiece lenses to check for the presence of cracks and to identify potential damage that may have occurred during polishing. Most of the specimens were found to contain no cracks. Finally, a Knoop microhardness test was performed with a microhardness tester (Micromet 2100, Buehler), and a 50g static load that was applied for 10 seconds at each of 3 locations; enamel, the tested material, and dentin [10]. Indentations were made at depths of 25 and 50 μm from the external surface and at distances of 25 and 75 μm from the interface; the length of the diagonal of each indentation was measured directly using a graduated eye lens. A detailed schematic illustration of the study’s experimental design and methodology steps is presented in Figure 1.
Statistical analysis
1. Sample size calculation
The sample size for this study was calculated before conducting any work using G*Power program (G*Power Ver. 3.0.10, Kiel, Germany) based on previous studies of a similar design [1015]. The total sample size of 5 teeth for the SEM-EDS and ten teeth for the microhardness test achieved 80% power (equal to type II error), and the type I error (α) was 0.05.
2. Statistical methods
The data were statistically analyzed using SPSS software (SPSS version 20, IBM, Chicago, IL, USA). The wt% of the selected elements and microhardness values proved to be normally distributed after they were subjected to the Shapiro–Wilk test and the homogeneity of variances was tested using Levene’s test. Thus, parametric tests were used for both. Two-way analysis of variance (ANOVA) was used to determine the effect of study variables (storage media and substrate/distance) and their interaction on the wt% of the selected elements, and multi-way ANOVA was used to determine the effect of study variables (storage media, depth, aging, and substrate/distance) and their interaction on the microhardness values followed by Tukey’s post hoc test (at p < 0.05).
RESULTS
SEM-EDS results
The mean wt% values and standard deviations (SD) for the selected elements in each evaluated substrate/distance stored in different media are presented in Tables 2, 3, 4, 5. Representative SEM images and graphical representations of the wt% of elements at different substrates/distances evaluated are presented in Figures 2 and 3. Graphical representation for the selected elements wt% data in addition to calcium/phosphorus ratios in each evaluated substrate/distance stored in different media are presented in Figure 4.
Table 2
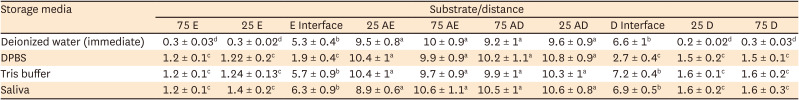
Mean ± standard deviation of calcium ions in all tested substrates/distances for all groups expressed in wt%
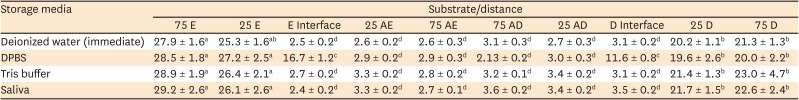
Groups identified with the same superscripted letters are not significantly different (Tukey HSD; p < 0.05).
wt%, weight percentages; DPBS, Dulbecco's phosphate buffered saline; 75 E and 25 E, 75 μm and 25 μm into the enamel from the enamel/Activa interface; E Interface, enamel/Activa interface; 25 AE and 75 AE, 25 μm and 75 μm into Activa from the enamel/Activa interface; 75 AD and 25 AD, 75 μm and 25 μm into Activa from the Activa/dentin interface; D Interface, Activa/dentin interface; 25 D and 75 D, 25 μm and 75 μm into the dentin from the Activa/dentin interface.
Table 3
Mean ± standard deviation of phosphorus ions in all tested substrates/distances for all groups expressed in wt%
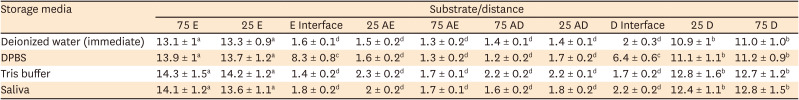
Groups identified with the same superscripted letters are not significantly different (Tukey HSD; p < 0.05).
wt%, weight percentages; DPBS, Dulbecco's phosphate buffered saline; 75 E and 25 E, 75 μm and 25 μm into the enamel from the enamel/Activa interface; E Interface, enamel/Activa interface; 25 AE and 75 AE, 25 μm and 75 μm into Activa from the enamel/Activa interface; 75 AD and 25 AD, 75 μm and 25 μm into Activa from the Activa/dentin interface; D Interface, Activa/dentin interface; 25 D and 75 D, 25 μm and 75 μm into the dentin from the Activa/dentin interface.
Table 4
Mean ± standard deviation of silica ions in all tested substrates/distances for all groups expressed in wt%
Groups identified with the same superscripted letters are not significantly different (Tukey HSD; p < 0.05).
wt%, weight percentages; DPBS, Dulbecco's phosphate buffered saline; 75 E and 25 E, 75 μm and 25 μm into the enamel from the enamel/Activa interface; E Interface, enamel/Activa interface; 25 AE and 75 AE, 25 μm and 75 μm into Activa from the enamel/Activa interface; 75 AD and 25 AD, 75 μm and 25 μm into Activa from the Activa/dentin interface; D Interface, Activa/dentin interface; 25 D and 75 D, 25 μm and 75 μm into the dentin from the Activa/dentin interface.
Table 5
Mean ± standard deviation of fluoride ions in all tested substrates/distances for all groups expressed in wt%
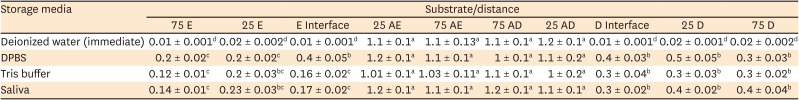
Groups identified with the same superscripted letters are not significantly different (Tukey HSD; p < 0.05).
wt%, weight percentages; DPBS, Dulbecco's phosphate buffered saline; 75 E and 25 E, 75 μm and 25 μm into the enamel from the enamel/Activa interface; E Interface, enamel/Activa interface; 25 AE and 75 AE, 25 μm and 75 μm into Activa from the enamel/Activa interface; 75 AD and 25 AD, 75 μm and 25 μm into Activa from the Activa/dentin interface; D Interface, Activa/dentin interface; 25 D and 75 D, 25 μm and 75 μm into the dentin from the Activa/dentin interface.
Figure 2
Representative SEM micrographs and graphical representations of wt. % of elements at different substrates/distances evaluated. (A, B) and (G, H) SEM images for the enamel/Activa and dentin/Activa interfaces at ×500 with the spectra locations evaluated for EDS. (C-F, I,-M), examples of EDS spectra and tables of elements for enamel at 24 hours, enamel interface at 24 hours, enamel at 3 months, enamel interface at 3 months, dentin at 24 hours, dentin interface at 24 hours, dentin at 3 months, dentin interface at 3 months, and Activa, respectively.
SEM, scanning electron microscopy; EDS, energy dispersive spectroscopy.
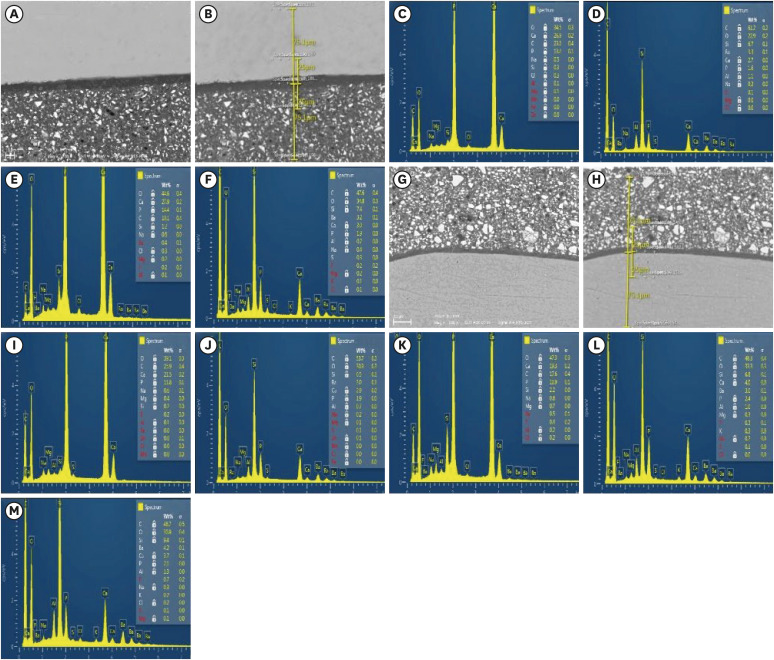
Figure 3
Representative SEM micrographs and graphical representations of wt. % of elements for the enamel/Activa and dentin/Activa interfaces in DPBS. (A, C) SEM images for the enamel/Activa and dentin/Activa interfaces in DPBS at ×500 (Black arrows refer to the hybrid-like layer that had obvious distinct morphology. Blue arrows refer to the remaining adhesive layers). (D) SEM image for the dentin/Activa interface in DPBS at ×2,000 (Black arrows refer to the hybrid-like layer, blue arrow refer to the remaining adhesive layer). (B, E), examples of EDS spectra and tables of elements for enamel/Activa (B) and dentin/Activa (E) interfaces in DPBS, respectively.SEM, scanning electron microscopy; DPBS, Dulbecco's phosphate buffered saline; EDS, energy dispersive spectroscopy.
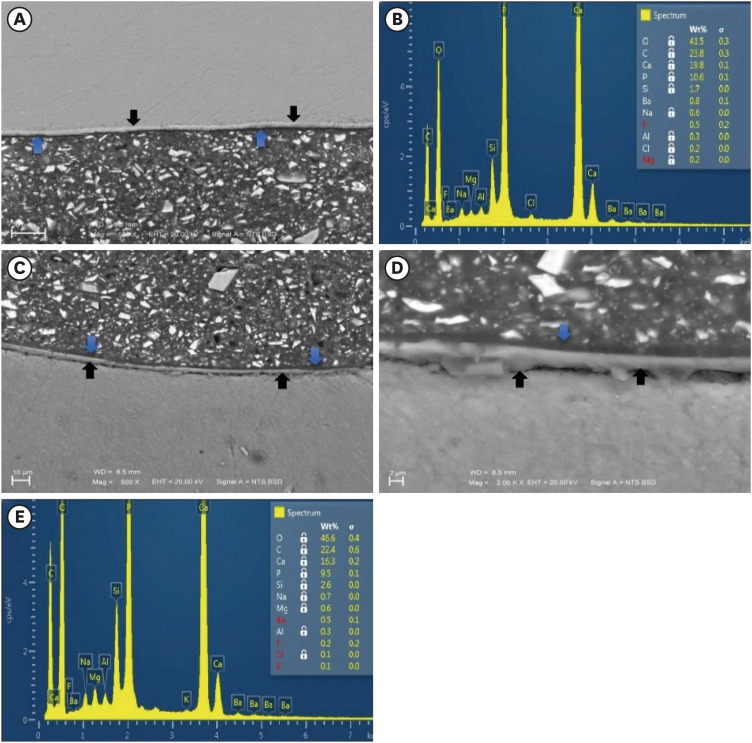
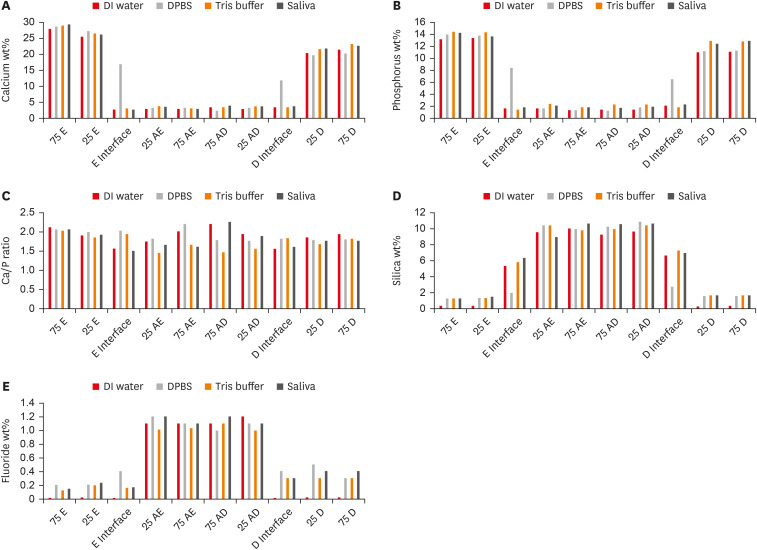
Figure 4
Graphical representation for all evaluated elements data in all tested substrates/distances for all groups expressed in wt%. (A) Calcium wt%, (B) phosphorus wt%, (C) calcium/phosphorus ratio, (D) silica wt%, (E) fluoride wt%.
wt%, weight percentages; DI, deionized; DPBS, Dulbecco's phosphate buffered saline; 75 E and 25 E, 75 μm and 25 μm into the enamel from the enamel/Activa interface; E Interface, enamel/Activa interface; 25 AE and 75 AE, 25 μm and 75 μm into Activa from the enamel/Activa interface; 75 AD and 25 AD, 75 μm and 25 μm into Activa from the Activa/dentin interface; D Interface, Activa/dentin interface; 25 D and 75 D, 25 μm and 75 μm into the dentin from the Activa/dentin interface.
During morphological and elemental analysis of Activa/tooth structure interfaces in the DPBS group, the hybrid-like layers were morphologically different than either adhesive layers or hybrid layers in other groups’ specimens (Figure 3A, 3C, and 3D).
For all evaluated elements, both variables, i.e., the storage media and substrate/distance, affected the wt% values of each element in a significant manner (p < 0.05), in addition, the interaction between both variables was statistically significant. The calcium and phosphorus wt% values followed similar patterns. Both enamel and dentin interfaces in the DPBS group exhibited significantly higher calcium and phosphorus levels (wt%) than did the evaluated interfaces in other media groups. Regardless of the interfaces, no significant differences were found when comparing calcium and phosphorus wt% of the same substrate/distance within different storage media. Within the same storage medium, enamel and dentin areas significantly exhibited the highest calcium and phosphorus values, followed by different areas in Activa, and both interfaces with no significant differences between them (p > 0.05) except in the DPBS group, where both interfaces had higher values than Activa.
For the silica results, the silica level (wt%) was significantly higher in the dentin and enamel areas of the 3-month group compared to the 24-hour group (p < 0.05). Additionally, both enamel and dentin interfaces in DPBS exhibited significantly lower values than the other interfaces in the other storage media groups. Within the same storage media, the highest silica levels were in different areas of Activa that exhibited no significant differences between them (p > 0.05), followed by the dentin and enamel interfaces, which also exhibited no significant differences between them (p > 0.05). Both enamel and dentin areas exhibited the lowest wt% silica.
All enamel areas, dentin areas, and both interfaces exhibited significant increases in the fluoride levels wt% in the 3-month storage groups, relative to the 24-hour groups (p < 0.05). Regardless of the storage media, the Activa areas significantly contained the highest fluoride levels (wt%) but were not significantly different from 1 another. Dentin areas and interfaces contained the second highest levels of fluoride, while enamel areas and interfaces contained the lowest. There was no significant difference within the same substrate among the groups that were stored for 3 months, except that the enamel interface in DPBS contained significantly higher fluoride levels (wt%) than enamel interfaces in the other 3-month-storage groups.
Microhardness results
The mean microhardness values and SD for all evaluated substrates/areas stored in different media and tested either in 24 hours or after 3 months of storage are presented in Table 6.
Table 6
Mean ± standard deviation of Knoop microhardness in all tested substrates/distances at different depths of all storage media, immediately and after 3 month-storage
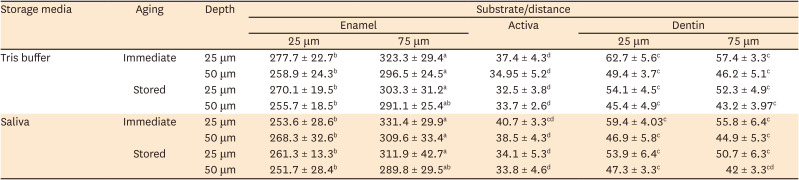
The microhardness values were the highest for different areas in enamel, followed by dentin and Activa, respectively. For different areas in enamel, neither the storage media type, depth, nor aging condition affected the hardness, although the areas further away from the interface (75 μm) exhibited significantly higher hardness values than areas near the interface (25 μm) (p < 0.05). For Activa and different areas (both near the interface and more distant) in dentin, none of the variables had any effect on their hardness.
DISCUSSION
The current study evaluated the bioactivity of the tested material (Activa) in different media, which were selected based on the following criteria. In the elemental analysis test, deionized water was chosen for the 24-hour storage group as it is devoid of inorganic mineral content like calcium, phosphorus, and magnesium and thus provided a baseline for comparison with the other storage media. DPBS was selected because it provided a simulation of an in vivo environment that is clinically relevant in that the high levels of phosphate in DPBS represent the continuous replenishment of phosphate ions from the tissue fluids [61617]. Based on previous reports, a bioactive material should form apatite in a phosphate-free solution at a neutral pH [1]. Therefore, we selected Tris buffer, pH 7.4 due to its lack of any ions and its improved pH maintenance relative to deionized water [1]. Finally, since many bioactivity studies have tested materials that are used for retrograde fillings or that contact the pulp tissue, such as calcium silicate cement, there was a good reason to perform bioactivity testing in SBF [818]. However, because the current tested restorative material is used clinically where it faces primarily human saliva, we selected human saliva, since it would provide data as to whether the tested material can stabilize ions from the saliva [7].
Previous studies tested the bioactivity of Activa after storage periods of 3–6 weeks, although the manufacturer states that this property is evident “within several weeks” of the restoration, without specifying an exact period [119]. In light of the report by Jefferies et al. [2] that bioactive materials possessed a specific rate of apatite deposition and that it can take up to 13 weeks for a bioactive material to seal a 250 μm gap, a 3-month storage period was selected for the current study.
Zain et al. [19] stated that in investigating the mineral content of a tooth/restoration interface, there is no way to know how much of a mineral was present in the tooth before the restoration. Therefore, in the current study, each restored tooth was divided into either 4 sections for SEM-EDS analysis or 2 sections for the microhardness test, each containing a restored cavity and each of which was stored in different media or for different periods. This might compensate somewhat for the challenge of standardizing the initial mineral content and allow the 24-hour groups to serve as valid baseline results. In a pilot study conducted before the start of the work, it became clear that dividing a tooth into 4 and then halving each section again for the microhardness test made the sections too thin. Therefore, in this study, it was decided to test just 2 storage media; human saliva which was selected as the most clinically relevant medium, and Tris buffer, pH 7.4 as a control.
The microhardness of the specimens was examined using the Knoop test [20]. The indentation for the Knoop test is longer and shallower than that of other methods, so a load impression can be applied to brittle materials without cracking them and the longer diagonal is easier to read [20]. The tested distances from the interfaces and depths for the SEM-EDS were based on a previous study that reported significant changes in the microhardness of marginal enamel and dentin in these areas after restoration with glass ionomers (GIs) [10].
The results of the current study revealed that the storage media affected the elemental analysis of the marginal tooth structure and its interfaces with the restoration material. However, the storage medium had no effect on the elemental analysis of the tested material or the microhardness of either the marginal tooth structure or the tested material. Therefore, the null hypothesis could be only partially rejected.
Long-term studies describe an ion exchange process at the interface between the GIs and the tooth that resulted in the formation of a distinct interfacial region, later termed the ion exchange layer [2122]. Because the current study studied an ionomer glass-type filled material, a similar interfacial ion movement was possible under the conditions of the current study [1723]. The characteristic hybrid-like layers formed at both the Activa/enamel and dentin interfaces after storage in DBPS for 3 months contained high percentages of calcium, phosphorus, and fluoride, compared to the interfaces (adhesive layer) in the 24-hour group. These layers were probably morphologically different due to the movement of ions, specifically calcium from the tooth, fluoride from the tested material, and phosphorus from the storage media. Ruengrungsom et al. [7] also reported that the tested material showed the highest phosphorus release among other tested ion-releasing materials, although this ion movement was only observed in media that is rich in phosphorus, suggesting that the source of the high phosphorus levels detected at the interfaces in this study was from the storage media rather than the tested material itself [7]. This might explain why this obvious ion movement was observed in the present study only in DPBS. The report by Gandolfi et al. [8] confirmed the relationship between the amount of phosphate in a soaking solution and the rate of apatite precipitation.
Usually, ionic exchange was reported when the GIs were bonded directly to the tooth structure, without the presence of an adhesive in between [21]. In this study, the ion movement occurred through a universal adhesive. Some concerns had been expressed in the literature that a relatively impervious resin layer might restrict the ion movement and limit the availability of fluoride release to the underlying tooth structure, especially when a non-fluoride-releasing adhesive is used, and that the accessibility of fluoride from the ion-releasing restorative material must depend mainly on the permeability of the adhesive layer [2425]. However, both Tay et al. [24] and Itthagarun et al. [25] proved that single-step self-etch (SE) adhesives behave as semi-permeable membranes after polymerization, which may increase the accessibility of fluoride due to the increase in permeability characteristics [2425]. Universal adhesives are also classified as single-step SE, which may explain why the ion movement observed in this study occurred despite or through the adhesive [23]. Additionally, universal adhesives contain up to 20% water in their composition, which is required to ionize the respective monomers for classical SE mode [26]. Chen et al. [27] found that resin–dentin interfaces created by different universal adhesives (with different functional monomers) in the SE mode contain incompletely removed water. Cruz et al. [28] emphasized the same finding and added that the high permeability of these adhesives remains after photo-polymerization, because they have high amounts of hydrophilic monomer and non-evaporated solvent in their composition. The previous findings could confirm that there might be a degree of water permeability after the polymerization of these adhesives, which might have helped in the ion movement process. In accordance with the current study results, previous authors noticed the presence of mineral deposition at the resin-bonded dentin under SEM and confocal microscope when Activa was bonded to dentin using a universal adhesive [2329]. They attributed that to the bioactivity of the tested material, which released ions and diffused through the resin-bonded dentin due to the permeable nature of the used universal adhesive.
In the present study, the levels of silica and fluoride increased in both enamel and dentin up to a distance of 75 μm from the interface. Both Tiskaya et al. [1] and Ruengrungsom et al. [7] reported that the tested material releases both silica and fluoride ions after immersion of discs of the material into different solutions [17]. Therefore, in this study, these ions were able to diffuse from the material through the semi-permeable adhesive deeply into the tooth structure beyond the interfacial zone. Yamamoto et al. [30] reported that the mean penetration depth of fluoride that was released from the fluoridated composite they used into the enamel and dentin side walls of class V restorations 4 weeks after insertion was 19 to 47 μm. In this study, the fluoride levels were significantly higher in dentin areas than in enamel, despite the lack of a statistically significant difference between them in the 24-hour group. This result is in accordance with Wiegand et al. [31] who confirmed in their review that fluoride uptake from fluoride-releasing restorations is higher in dentin and cementum than in enamel but is influenced by the interface between the restoration and the tooth.
The amount of fluoride released from fluoride-releasing materials usually increases in acidic media such that a decrease in pH increases the dissolution of the material, leading to a higher fluoride level in acidic immersion than under neutral pH conditions [1731]. Despite the lower pH of the saliva used here (no less than pH 6) compared to that of DPBS (generally pH 7.2–7.6) and Tris buffer, pH 7.4, the present study reports no difference between the amount of fluoride diffused to the tooth structure from each of these media, perhaps because ionomer glasses degrade more significantly at pH < 6 [1]. Importantly, the increase of fluoride in the marginal tooth structure reported in the current study does not directly mean prevention from the development of secondary caries, which should be investigated and quantified in the future.
Neither the storage media nor the aging conditions affected the results of the microhardness testing of all evaluated substrates. The enamel areas further away from the restoration (75 mm) exhibited significantly higher hardness values than the enamel closer to the interface (25 mm). This might be due to the disordered organization of crystallites in the cervical enamel compared to more occlusal enamel [32]. The lack of statistical significance of all hardness values in different dentin areas could be attributed to that the mechanical properties of dentin are more dependent on the intrafibrillar orientation of the mineral within the collagen matrix than on the overall mineral content [33]. Regardless of the previously reported data, the nano-indentation test may have provided a more appropriate method for detecting the nanostructure and slight variations caused by the study variables in this case.
The present in vitro study has limitations, including its testing of only 1 material, but this study was not designed to evaluate different products, but the potential of 1 bioactive material. Another limitation of this study was the bonding of the tested material to sound dentin. The results obtained suggest evidence of an ionic exchange between the material and the tooth structure, which might be better studied on bonding to demineralized or caries-affected dentin. Additionally, although both silica and fluoride ions diffused into tooth structure up to a distance of 75 μm, further investigation will be required to determine whether this increase is enough to prevent secondary caries development.
Different standards for and definitions of a “bioactive” material have been reported which may make it more challenging to classify the available commercial materials as bioactive. However, if a strict definition of “bioactive” requires the formation of apatite on the surface of the material, the currently tested material (Activa) cannot be a member of this class of materials [16]. On the other hand, this study detected an obvious mineral exchange (tissue reaction) between the tested material and the tooth structure, which other reports would consider to be sufficient for including the material in the bioactive category [2329].
CONCLUSIONS
The findings of the current study indicate that the storage media had a significant impact on the SEM-EDS analysis of the marginal tooth structure. Notably, ion movement was observed at the interface between the tested material and both enamel and dentin when stored in DPBS, even in the presence of an intervening adhesive layer. Furthermore, the microhardness of all evaluated substrates remained unaffected by the storage media used in this study.
 XML Download