



 PDF
PDF Citation
 Print
Print


INTRODUCTION
MATERIALS AND METHODS
Statistical methods
RESULTS
Fig. 1
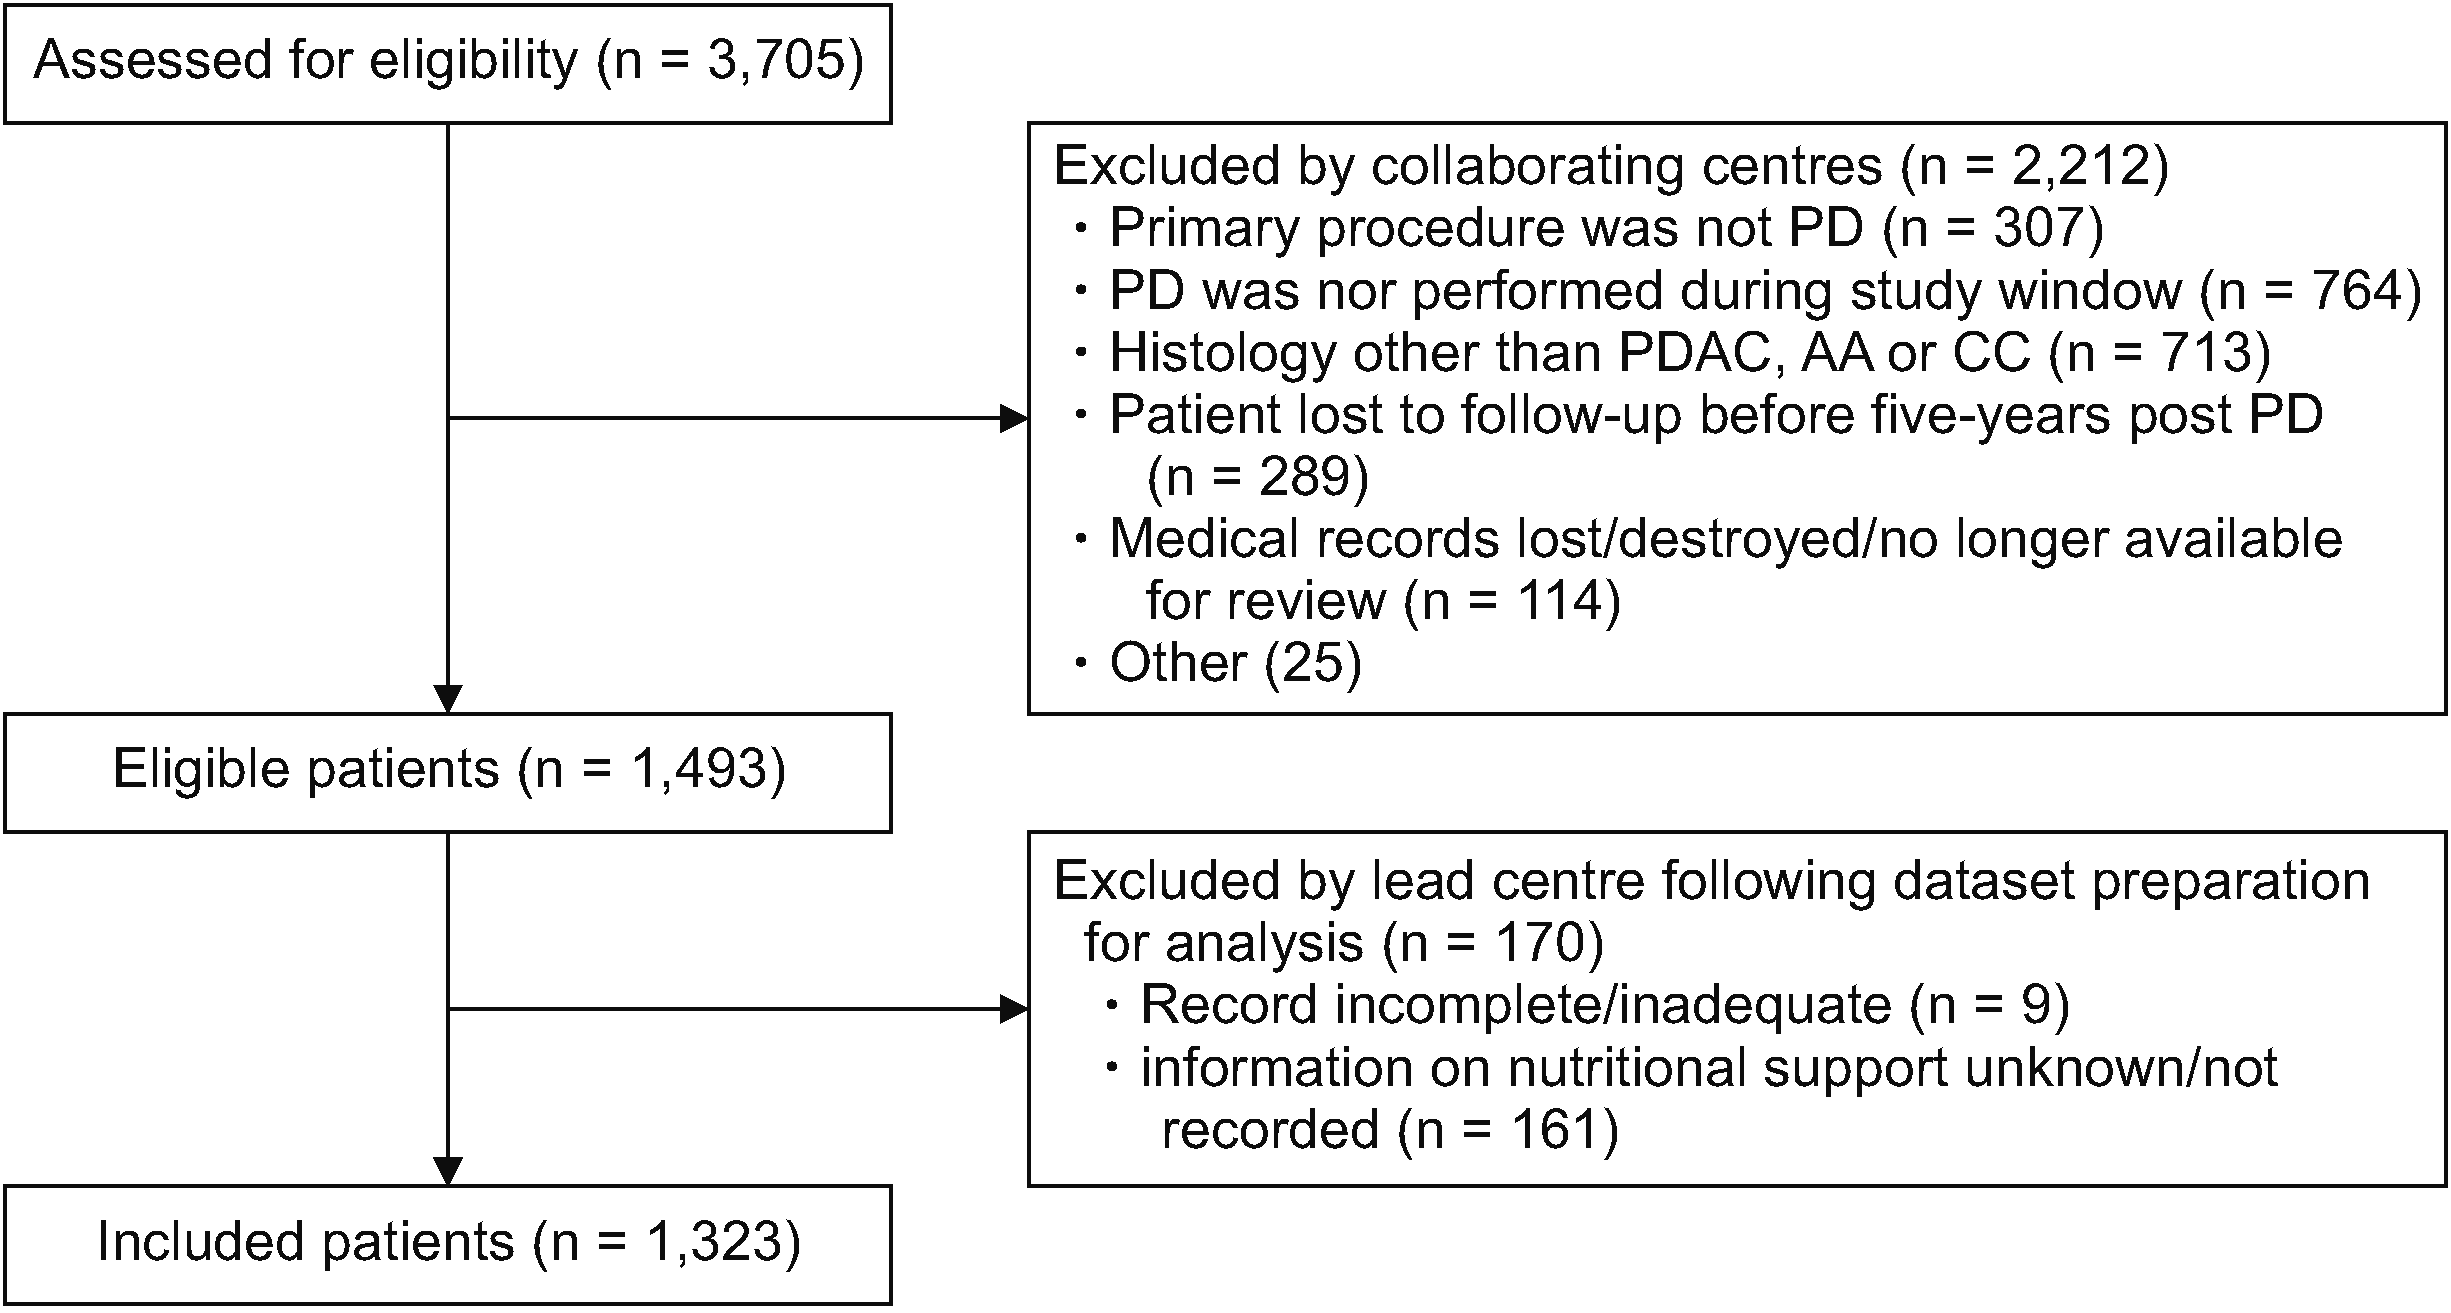

Table 1
| Variable | Value |
|---|---|
| Age (yr) | 66.0 ± 9.8 |
| Female sex | 579 (43.8) |
| BMI (kg/m2) | 25.6 ± 4.4 |
| Unknown/not recorded | 525 (39.7) |
| Pre-op biliary stent | 857 (64.8) |
| Median pre-op serum bilirubin (µmol/L) | 21 (IQR: 43) |
| Median pre-op serum albumin (g/L) | 37 (IQR: 10) |
| Unknown/not recorded | 75 (5.7) |
| ASA grade > II | 465 (35.1) |
| Unknown/not recorded | 1 (0.1) |
| Type of PD performed | |
| Classic Whipple | 660 (50.0) |
| Pylorus-preserving | 660 (50.0) |
| Unknown/not recorded | 3a) |
| Received an intra-op blood transfusion | 164 (18.1) |
| Unknown/not recorded | 417a) |
| Received post-op NS | 601 (45.4) |
| Enteral only | 266 (44.3) |
| Parenteral only | 211 (35.2) |
| Enteral + parenteral | 123 (20.5) |
| Unknown/not recorded | 1a) |
| Median length of stay (day) | 13 (IQR: 10) |
| Unknown/not recorded | 65 (4.9) |
| Unplanned return to theatre | 71 (5.4) |
| 30-day readmission | 134 (10.2) |
| Unknown/not recorded | 3 (0.2) |
| 90-day mortality | 51 (3.9) |

Table 2
| Variable | Received post-op NS (%) | p-value |
|---|---|---|
| Age (yr) | ||
| < 75 vs. ≥ 75 | 44.2 vs. 50.4 | 0.081 |
| Sex | ||
| Female vs. male | 43.4 vs. 47.0 | 0.182 |
| BMI (kg/m2) | ||
| Underweight (< 18.5) vs. ideal (18.5–24.9) | 69.6 vs. 45.2 | 0.030* |
| Ideal (18.5–24.9) vs. overweight (≥ 25.0) | 45.2 vs. 51.0 | 0.114 |
| Pre-op diabetes | ||
| Yes vs. no | 61.5 vs. 44.7 | 0.268 |
| Pre-op cardiovascular comorbidity | ||
| Yes vs. no | 49.3 vs. 42.2 | 0.011* |
| Pre-op respiratory comorbidity | ||
| Yes vs. no | 53.2 vs. 44.5 | 0.060 |
| Pre-op biliary stent | ||
| Yes vs. no | 42.7 vs. 50.2 | 0.009* |
| Received neoadjuvant chemotherapy | ||
| Yes vs. no | 34.4 vs. 46.0 | 0.087 |
| Pre-op serum bilirubin (µmol/L) | ||
| < 40 vs. ≥ 40 | 44.1 vs. 48.3 | 0.154 |
| Pre-op serum albumin (g/L) | ||
| < 36 vs. ≥ 36 | 50.9 vs. 43.3 | 0.009* |
| ASA grade | ||
| ≤ II vs. > II | 44.1 vs. 48.0 | 0.184 |
| Type of PD | ||
| Classic Whipple vs. pylorus-preserving | 44.1 vs. 46.7 | 0.376 |
| Venous resection performed | ||
| Yes vs. no | 44.1 vs. 45.7 | 0.702 |
| Intra-op blood transfusion | ||
| Yes vs. no | 51.2 vs. 45.0 | 0.166 |
| Left theatre with a NG tube in situ | ||
| Yes vs. no | 49.9 vs. 30.4 | < 0.001* |
| Post-op pancreatic fistula | ||
| Yes vs. no | 74.2 vs. 40.0 | < 0.001* |
| Post-op bile leak | ||
| Yes vs. no | 72.1 vs. 44.5 | < 0.001* |
| Post-op gastro-jejunal leak | ||
| Yes vs. no | 65.0 vs. 45.1 | 0.111 |
| Post-op post-pancreatectomy haemorrhage | ||
| Yes or no | 61.9 vs. 44.3 | 0.002* |
| Delayed gastric emptying | ||
| Yes vs. no | 77.2 vs. 40.8 | < 0.001* |
| Intra-abdominal collection | ||
| Yes vs. no | 68.8 vs. 42.2 | < 0.001* |
| Unplanned return to theatre | ||
| Yes vs. no | 74.3 vs. 43.7 | < 0.001* |
| 30-day readmission | ||
| Yes vs. no | 58.2 vs. 44.0 | 0.002* |
| 90-day mortality | ||
| Yes vs. no | 56.9 vs. 45.0 | 0.114 |
| Commenced ACa) | ||
| Yes vs. no | 43.1 vs. 49.8 | 0.029* |
Table 3
| Variable | Postoperative NS (n = 601) | No postoperative NS (n = 722) | p-value |
|---|---|---|---|
| Age (yr) | 66.3 ± 9.9 | 65.6 ± 9.7 | 0.148 |
| Female sex | 251 (41.8) | 328 (45.4) | 0.182 |
| BMI (kg/m2) | 25.6 ± 4.5 | 25.5 ± 4.3 | 0.926 |
| Pre-op diabetes | 133 (22.2) | 141 (19.5) | 0.248 |
| Pre-op cardiovascular comorbidity | 291 (48.4) | 299 (41.4) | 0.012* |
| Pre-op respiratory comorbidity | 75 (12.5) | 66 (9.1) | 0.060 |
| Preoperative biliary stent | 366 (60.9) | 491 (68.0) | 0.008* |
| Received neoadjuvant chemotherapy | 21 (3.5) | 40 (5.5) | 0.087 |
| Median pre-op bilirubin (µmol/L) | 21.5 (IQR: 46) | 20 (IQR: 40) | 0.724 |
| Median pre-op serum albumin (g/L) | 37 (IQR: 11) | 39 (IQR: 9) | < 0.001* |
| ASA grade > II | 223 (37.1) | 242 (33.5) | 0.184 |
| Venous resection performed | 90 (15.0) | 114 (15.8) | 0.701 |
| Intra-op blood transfusion | 84 (20.1) | 80 (16.4) | 0.166 |
| Left theatre with NG tube in situ | 501 (94.7) | 504 (88.7) | < 0.001* |
| Post-op pancreatic fistula | 155 (25.8) | 54 (7.5) | < 0.001* |
| Post-op bile leak | 31 (5.2) | 12 (1.7) | < 0.001* |
| Gastro-jejunal anastomotic leak | 13 (2.2) | 7 (1.0) | 0.111 |
| Post-pancreatectomy haemorrhage | 52 (8.7) | 32 (4.4) | 0.002* |
| Delayed gastric emptying | 129 (21.5) | 38 (5.3) | < 0.001* |
| Intra-abdominal collection | 26 (4.3) | 50 (6.9) | 0.044* |
| Unplanned return to theatre | 55 (9.2) | 19 (2.6) | < 0.001* |
| Median length of stay (day) | 11 (IQR: 7) | 12 (IQR: 6) | 0.017* |
| 30-day readmission | 77 (12.8) | 57 (7.9) | 0.003* |
| 90-day mortality | 29 (4.8) | 22 (3.0) | 0.114 |
| Commenced ACa) | 342 (59.8) | 451 (64.4) | 0.092 |
Statistical methods: Student’s t-test: age, BMI, Mann–Whitney U test: blood tests, length of stay, Fisher’s exact test; all other comparisons. Values are presented as number (%) or mean ± standard deviation. Percentages may appear incorrect if data were missing and selected patients had to be excluded from certain sub-analyses.
Table 4
| Postoperative nutritional support received | |||||||
|---|---|---|---|---|---|---|---|
|
|
|||||||
| Enteral only | Parenteral only | Enteral + parenteral | None | Enteral only | Parenteral ± enteral | p-value | |
| Number of patients | 266 | 211 | 123 | 722 | 266 | 334 | - |
| Left theatre with NG tube in situ | 208 (94.5) | 187 (94.9) | 106 (94.6) | 504 (88.7) | 208 (94.5) | 293 (94.8) | > 0.999 |
| Post-op pancreatic fistula | 40 (15.0) | 68 (32.2) | 47 (38.2) | 54 (7.5) | 40 (15.0) | 115 (34.4) | < 0.001* |
| Median length of stay (day) | 11 (IQR: 7) | 11 (IQR: 7) | 11 (IQR: 7) | 12 (IQR: 6) | 11 (IQR: 7) | 11 (IQR: 6) | 0.743 |
| Unplanned return to theatre | 12 (4.5) | 21 (10.0) | 22 (17.9) | 19 (2.6) | 12 (4.5) | 43 (12.9) | < 0.001* |
| 90-day mortality | 5 (1.9) | 17 (8.1) | 7 (5.7) | 22 (3.0) | 5 (1.9) | 24 (7.2) | 0.003* |
| Commenced ACa) | 159 (60.9) | 112 (57.7) | 71 (61.2) | 451 (64.4) | 159 (60.9) | 183 (59.0) | 0.669 |
Statistical methods: Mann–Whitney U test: length of stay, Fisher’s exact test; all other comparisons. The type of nutritional support was unknown/not recorded in one patient (excluded from the above). Values are presented as number only or number (%). Percentages may appear incorrect if data were missing and selected patients had to be excluded from certain sub-analyses. Patients were excluded from the relevant sub-analyses where data were unavailable.
Table 5
| Major complication | No major complication | p-value | Studied complication | No studied complication | p-value | |
|---|---|---|---|---|---|---|
| Number of patients | 226 (17.1) | 1,097 (82.9) | - | 454 (34.3) | 869 (65.7) | - |
| Received post-op NS | 159 (70.4) | 442 (40.3) | < 0.001* | 297 (65.4) | 304 (35.0) | < 0.001* |
| Received EN only | 39 (17.3) | 227 (20.7) | 0.274 | 93 (20.5) | 173 (19.9) | 0.829 |
| Received PN (± EN) | 112 (49.6) | 215 (19.6) | < 0.001* | 203 (44.7) | 131 (15.1) | < 0.001* |
Comparisons were made using Fisher’s exact test. “Studied complications” included clinically relevant postoperative pancreatic fistula, bile leak, gastro-jejunal anastomotic leak, delayed gastric emptying, chyle leak, and postoperative ileus. Values are presented as number (%). Patients were excluded from the relevant sub-analyses where data were unavailable.

 XML Download