

 PDF
PDF Citation
 Print
Print


INTRODUCTION
Colorectal cancer (CRC) is a common cancer affecting the colon and rectum. It is the third most commonly diagnosed cancer and the second leading cause of cancer deaths worldwide [1]. If detected early, patients are primarily treated via surgery; however, if patients are diagnosed in the advanced stage of the disease, distant metastases may be observed [2]. Although advances in chemotherapy and radiotherapy have improved the overall prognosis, patients showing distant metastasis still have very poor prognosis [34]. Therefore, new tumor markers or treatment methods for CRC have been investigated [5].
The copine family of proteins is an area of study in the quest for new tumor markers or treatment methods for CRC. Copines are a family of calcium-dependent, phospholipid-binding proteins that are conserved across species [6]. Nine different members of the copine family of proteins (copines [CPNEs]; CPNE 1–9) have been identified in humans [7], and their functions have been linked to cell growth and cancer development [89]. Similar to other CPNEs, CPNE1 is a soluble membrane-binding protein containing 2 tandem C2 domains and an A domain. CPNE1 messenger (mRNA) has several alternative splicing forms encoding the same 537-amino acid protein and is located in the chromosomal region 20q11.21 [10]. The C2 domain is known to bind to phospholipids in a calcium-dependent manner and may be involved in cellular signaling and membrane trafficking pathways [1112]. The A domain is a protein-binding domain and has been studied in the context of integrins and extracellular matrix proteins [13]. CPNE1 was upregulated in several types of cancer, including lung, prostate, breast, and osteosarcoma, and it has been linked to survival rates in patients with lung and prostate cancer and tumor formation [141516]. Calcium is an important element in the human body. Changes in ionized calcium levels can trigger various physiological processes, including proliferation, death, and migration [17] of cells. Cell migration is particularly relevant in the context of cancer metastasis.
The present study aims to investigate CPNE1 expression in the cells of CRC patients and to examine the relationship between the expression levels and clinicopathological features. Additionally, the present study will explore the effects of silencing CPNE1 on cancer proliferation in a xenograft mouse model.
METHODS
This study was approved by the Institutional Review Board of Gyeongsang National University Hospital (No. 2021-01-001) and the animal experiments were approved by the Animal Laboratory at the Gyeongsang National University (No. GNU-210316-M0032).
Acquisition of database data
This study accessed gene expression data from the Gene Expression Omnibus (GEO) database (http://www.ncbi.nlm.nih.gov/geo/), specifically datasets GSE39582, encompassing CRC and normal colon tissue samples. Raw data files were retrieved and preprocessed to ensure accuracy. The Kaplan-Meier survival analysis investigated the relationship between CPNE1 expression and CRC prognosis, utilizing patient survival data and CPNE1 expression levels. Data processing and analysis were conducted using GraphPad Prism 7.0 software.
Cell culture
Four human CRC cell lines (SW480, SW620, HCT116, and HT29) were cultured in Dulbecco’s modified Eagle’s medium (DMEM; Gibco, Thermo Fisher Scientific, Inc.) containing 10% fetal bovine serum (FBS) and antibiotics (100-units/mL penicillin and 100-µg/mL streptomycin). The cells were maintained at 37 ℃ in a humidified incubator with 5% CO2.
Cell viability
The impact of CPNE1 knockdown on the survival of SW480 and HCT116 cells was evaluated using the Cell Counting Kit-8 (CCK-8) assay (Dojindo Laboratories Co., Ltd.) in an opaque-walled assay plate (Thermo Fisher Scientific, Inc.), following the manufacturer’s protocol with some slight modifications. Specifically, SW480 and HCT116 cells were seeded into 6-well plates (1 × 10⁵ cells per well) and incubated for 24 hours at 37 ℃. The cells were then infected with Ad-EGFP or Ad-shCPNE1 adenovirus at a multiplicity of infection of 20. Twenty-four hours postinfection, the growth medium was replaced with a normal culture medium. The infected cells were then incubated for an additional 48 hours, detached using trypsin/EDTA, and replated in 96-well plates (5 × 10² cells per well). Cell viability was then assessed using the CCK-8 assay. To continuously monitor cell viability, the pro-substrate was added at the time of cell replating, and each sample was analyzed at least in triplicate.
Colony formation assay
Triplicate samples of SW480 and HCT116 cells infected with Ad-EGFP or Ad-shCPNE1 adenovirus were seeded into 6-well plates (5 × 10² cells per well). The culture plates were incubated at 37 ℃ for 9 days in a growth medium, which was replaced every 3 days. The resulting colonies were then stained with crystal violet (1%, w/v; supplied by Sigma-Aldrich and Merck KGaA) for 2 hours at 20 ℃ and counted under a microscope (Eclipse 80Ti, Nikon Instruments Inc.).
Gap closure assay
Cell migration assays were conducted using gap closure assay chambers from Ibidi GmbH. SW480 and HCT116 cells infected with Ad-EGFP or Ad-shCPNE1 adenovirus were trypsinized and resuspended in a growth medium containing 10% FBS. The cells were then seeded in the insert at a density of 1 × 10⁵ cells per well and allowed to adhere to the well walls overnight. The following day, the inserts were removed and images were acquired using light microscopy (3 images for each sample). The cells were then cultured in a serum-free culture medium for the indicated time, and images were acquired using an inverted microscope equipped with an image capture system from Nikon Corporation. The images were analyzed using automated image analysis software (Nikon NIS Elements version 5.1 software, NIS-Elements Advanced Research; Nikon Instruments Inc.).
Invasion assay
Cells infected with Ad-EGFP or Ad-shCPNE1 adenovirus were seeded at a density of 1 × 10⁵ cells per well into the upper chamber of Transwell inserts with 8-µm pore polycarbonate filters (Costar; Corning, Inc.) coated with 10-µL Matrigel (BD Biosciences). The lower chamber was filled with DMEM containing 10% FBS, and the inserts were incubated at 37 ℃ for 24 hours. The invaded cells were fixed on the microscopic slide using 4% paraformaldehyde and stained with DAPI (4’,6-diamidino-2-phenylindole). Five random fields were observed and images were obtained using a fluorescence microscope (magnification, ×100) to count the cells.
Western blot analysis
Cell extracts were prepared by lysing cells in radioimmunoprecipitation assay lysis buffer (RIPA Lysis Buffer System; Santa Cruz Biotechnology, Inc.) containing protease and phosphatase inhibitor cocktails (Thermo Fisher Scientific, Inc.). The cells were sonicated for 2 minutes and centrifuged at 12,000 ×g for 10 minutes at 4 ℃ to remove insoluble debris, and protein concentrations were determined using a bicinchoninic acid protein assay kit (Pierce, Thermo Fisher Scientific, Inc.). A total of 30 µg of protein per well was separated on a 10% SDS-PAGE (sodium dodecyl sulfate polyacrylamide gel electrophoresis) gel and transferred onto a nitrocellulose membrane (EMD Millipore). After following a standard protocol for blocking and washing, the target proteins were detected by incubating the membrane with primary antibodies against CPNE1 (cat. no. ab155675; Abcam, Inc.), cyclin A (cat. no. sc-751; Santa Cruz Biotechnology, Inc.), cyclin B1 (cat. no. sc-245; Santa Cruz Biotechnology, Inc.), cyclin E (cat. no. sc-198; Santa Cruz Biotechnology, Inc.), vimentin (cat. no. sc-73259; Santa Cruz Biotechnology, Inc.), Slug (cat. no. ab51772; Abcam, Inc.), Snail (cat. no. ab53519; Abcam, Inc.), and β-actin (cat. no. A5441; Sigma-Aldrich; Merck KGaA). Protein bands were visualized using an enhanced chemiluminescence detection reagent (cat. no. #170-5061; Bio-Rad Laboratories, Inc.), and images were captured using the ChemiDoc Touch Imaging System (Bio-Rad Laboratories).
Immunohistochemistry
Sections of 5 µm were cut from formalin-fixed, paraffin-embedded tissue blocks from 263 CRC patients. These sections were mounted on charged slides, deparaffinized, and rehydrated in a graded series of alcohol. To block endogenous peroxidase activity, the sections were incubated with 0.3% hydrogen peroxide for 30 minutes at 20 ℃. The antigens were retrieved by boiling the sections in 10-mM sodium citrate for 10 minutes at 90 ℃ and immunostaining was carried out with a rabbit polyclonal CPNE1 antibody (1:200) using the UltraVision LP Detection System (ref. no. TL-125-HL; Thermo Scientific, Inc.) and DAB Quanto (ref. no. TA-125-QHDX; Epredia, Inc.) according to the manufacturer’s instructions. The sections were lightly counterstained with Mayer’s hematoxylin and mounted onto the microscope.
In vivo xenograft model
Athymic nude mice (male, 5 weeks old) were purchased from KOATECH (Pyeongtaek, Korea) and were bred following the guidelines of the Gyeongsang National University Animal Laboratory. To establish the xenograft model, CRC cell line HCT116 with 200-µL saline was injected subcutaneously into the mice (107 cells per mouse). After 8 days, the grafted nude mice were randomly divided into 2 groups (n = 9 each). Purified Ad-EGFP and Ad-shCPNE1 adenovirus, suspended in 20-µL saline, were injected intratumorally into the mice every 3 days (6 × 10⁹ PFU per tumor). Tumor volume was measured based on the length and width and calculated using the formula [V = (L × 2W) / 2].
RESULTS
CPNE1 overexpression indicated poor prognosis in colorectal cancer tissues
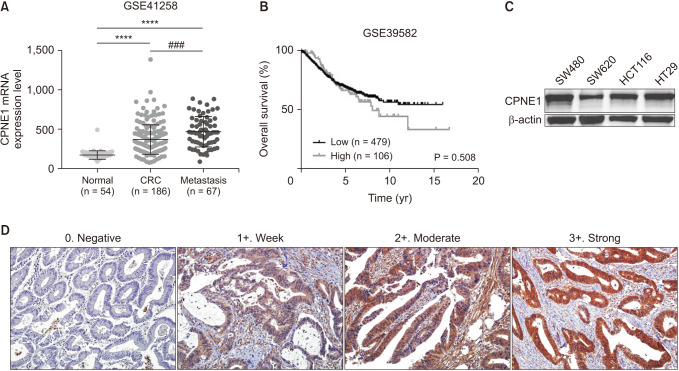
To identify CPNE1 overexpression and overall survival (OS) rate in CRC, we investigated 2 GEO datasets (GSE41258, and GSE39582) from the National Library of Medicine. The relative expression of the CPNE1 mRNA in primary CRC tissues (373.4 ± 13.67, n = 186) was significantly higher than that in paracancerous colorectal tissues (176.8 ± 7.326, n = 54; P < 0.001). The relative expression of the CPNE1 mRNA was significantly higher in metastatic tissues (472.9 ± 23.7, n = 67) compared to that in paracancerous colorectal tissues (P < 0.001) and primary CRC tissues (P < 0.001) (Fig. 1A). Furthermore, the OS rate was used to predict the prognostic value of CPNE1 expression in CRC tissues. CPNE1 overexpression in CRC patients resulted in a shorter OS rate (Fig. 1B). Cancer progression and increased expression of CPNE1 mRNA were significantly correlated. Additionally, we used western blotting to determine whether CPNE1 protein is detected in human CRC cell lines (SW480, SW620, HCT116, and HT29) (Fig. 1C).
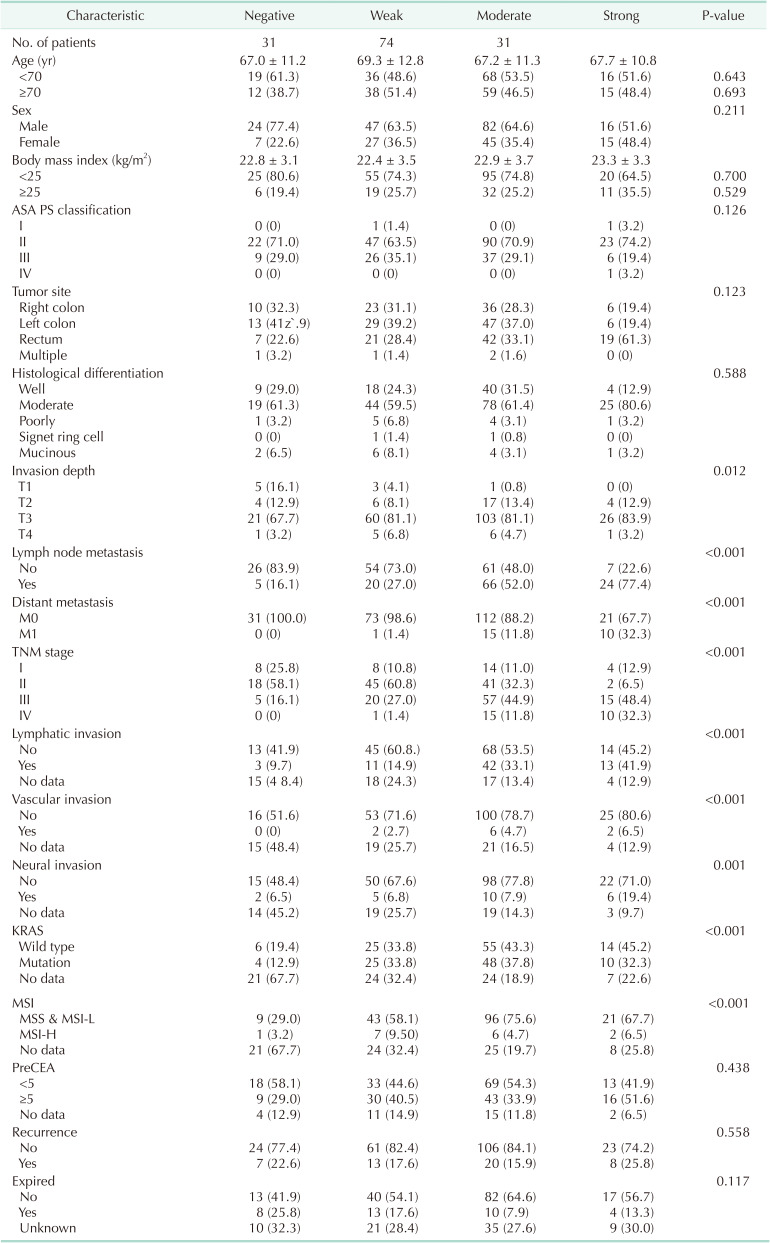
CPNE1 expression and clinicopathological features in colorectal cancer patients
To evaluate CPNE1 expression in CRC, a total of 263 CRC samples were analyzed using immunohistochemistry, wherein the staining intensity score was divided into negative (0%–25%), weak (26%–50%), moderate (51%–75%), and strong (76%–100%) (Fig. 1D). The observed intensity scores were 31 negative, 74 weak, 127 moderate, and 31 strong. We found that CPNE1 expression was positively associated with the invasion depth (P = 0.012) and significantly associated with the lymph node metastasis status (P < 0.001), distant metastasis (P < 0.001), lymphatic invasion (P = 0.018), vascular invasion (P < 0.001), neural invasion (P = 0.001), KRAS (Kirsten rat sarcoma virus; P < 0.001), NRAS (neuroblastoma RAS viral oncogene homolog; P = 0.006), and microsatellite instability status (P < 0.001). Moreover, CPNE1 expression was higher in patients with advanced TNM stage than in those without (P < 0.001) (Table 1). However, we observed no significant correlation between CPNE1 expression and other clinical and pathological features, including the tumor site and tumor differentiation.
CPNE1 knockdown inhibits cell proliferation and clonogenic activity in colorectal cancer cell lines
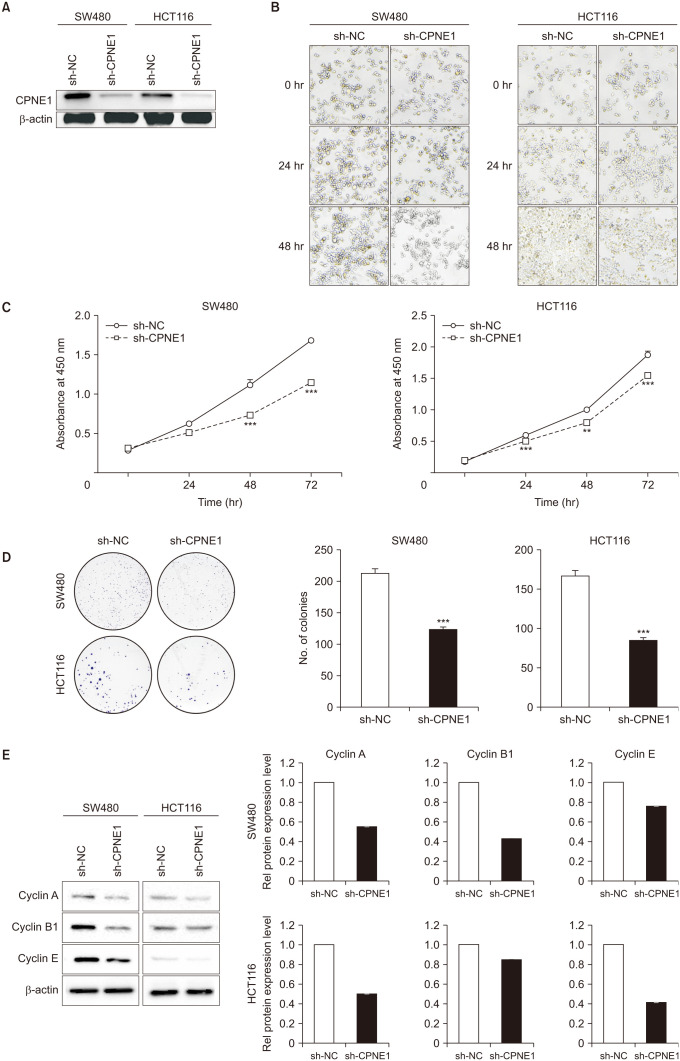
To investigate the role of CPNE1 in CRC cells, we constructed the adenoviral-mediated overexpression vector of CPNE1-specific shRNA. Western blotting showed the efficient knockdown of CPNE1 in CRC cell lines SW480 and HCT116 (Fig. 2A). To determine the effect of CPNE1 silencing on CRC cell proliferation, we performed the CCK-8 assay (Fig. 2B, C) and colony formation assay (Fig. 2D). CPNE1 knockdown in CRC cells showed decreased cell viability and colony formation ability (compared with the control cells). Furthermore, we found that the protein levels of cell cycle-associated proteins, including cyclin A, cyclin B1, and cyclin E, were markedly decreased in the CPNE1-silenced cells compared with the control cells (Fig. 2E). These results demonstrated that CPNE1 knockdown significantly inhibits CRC cell proliferation.
CPNE1 silencing suppresses colorectal cancer cell migration and invasion
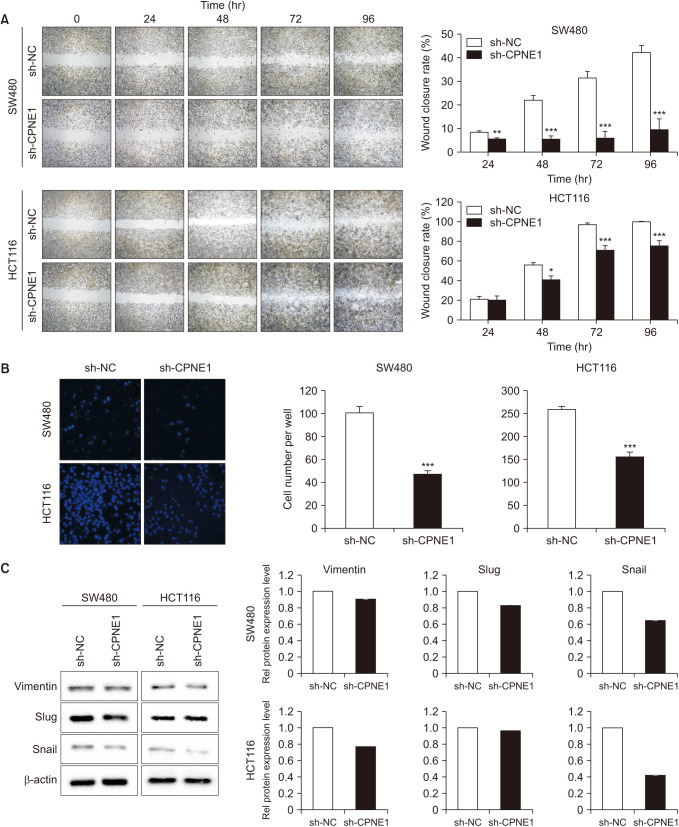
To compare the migrating and invasive abilities of CPNE1-silenced CRC cells and control cells, we performed the gap closure assay (Fig. 3A) and Transwell invasion assay (Fig. 3B). In the gap closure assay, CPNE1-silenced cells migrated and invaded much more slowly than the control cells. Additionally, western blotting was used to detect the expression of vimentin, Slug, and Snail, which are markers of invasion and metastasis, in the CPNE1-silenced CRC cells. These markers were expressed at lower levels in the CPNE1-silenced CRC cells (compared to the control cells) (Fig. 3C). Taken together, these results suggest that silencing the CPNE1 gene in CRC cells may affect their ability to migrate and invade, which the hallmarks of cancer malignancy. This is supported by western blotting results, which showed decreased expression of invasion and metastasis markers in the CPNE1-silenced CRC cells, indicating that silencing of CPNE1 may make the cells less malignant.
Knockdown of CPNE1 represses tumor growth in vivo
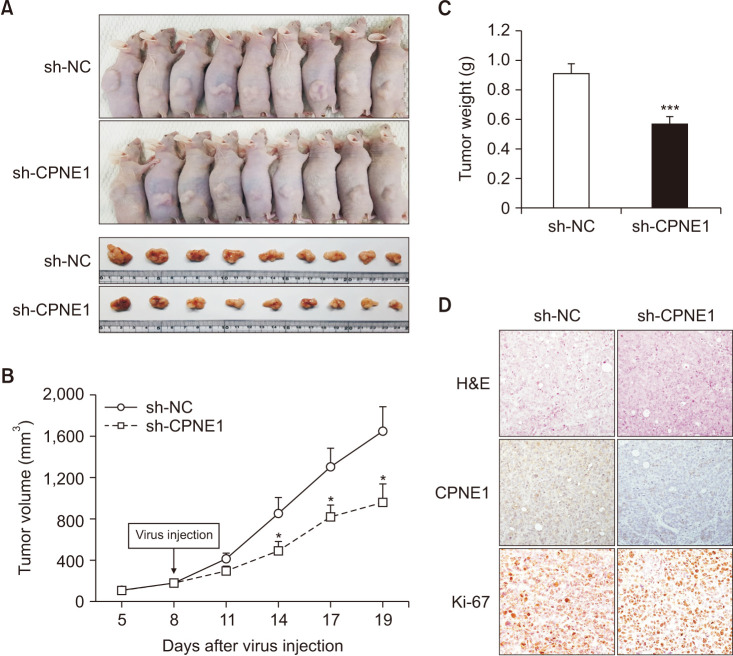
To further validate the biological role of CPNE1 in vivo, we used a mouse xenograft model; HCT116 cells were subcutaneously injected into the left flank of the male athymic nude mice. Knockdown of CPNE1 markedly suppressed tumor growth (Fig. 4A). The tumor growth curve was plotted according to the monitored volumes (Fig. 4B), and the tumor weight was measured (0.87 g vs. 0.52 g, P < 0.001) (Fig. 4C). Tissues excised from the xenograft tumors were analyzed to confirm CPNE1 and Ki-67 expression using hematoxylin and immunohistochemistry (Fig. 4D). These results indicated that CPNE1 silencing significantly suppresses CRC tumor growth in vivo.
DISCUSSION
CRC is one of the most common types of cancer and is known to be influenced by various genes during its development and progression [18]. However, specific mechanisms of how CRC develops are still unclear. Recent research on the copine family of proteins has shown that they can be used to predict the outcome of various types of cancer [1920]. The increased expression level of CPNE3 was also associated with a poorer prognosis in CRC [21]. CPNE1 has also been linked to non-small cell lung cancer (NSCLC), prostate cancer, and osteosarcoma [91215]. The current study aimed to investigate the specific role of CPNE1 in CRC.
Cancer cell growth is a complex process that is influenced by a variety of factors, including the cell cycle, which is a series of events that a cell undergoes as it grows and divides. Cyclin-dependent kinases (CDKs) are enzymes that play a crucial role in regulating the cell cycle. CDKs are activated by binding to specific proteins called cyclins. Cyclins, which are also important regulators of the cell cycle, have been found to be frequently amplified or overexpressed in cancer tissues, and have been targeted as biomarkers and potential therapeutic targets in cancer [22]. CPNE1, when it interacts with RACK1 through the MET signaling pathway, promotes the proliferation of NSCLC cells [23]. When CPNE1 expression is reduced, it leads to cell cycle arrest of NSCLC cells by inhibiting the AKT signaling pathway [12]. Additionally, the C2 domain of CPNE3 may enhance glucose uptake efficiency and cell proliferation by upregulation of Ins1, Ins2, Insr, and Glut2 [24]. Consistent with these reports, we demonstrated that CPNE1 silencing in CRC cells—by downregulating cell cycle-associated proteins such as cyclin A, cyclin B1, and cyclin E—inhibits cell proliferation. In additional experiments, CPNE1 was found to suppress CRC growth in vivo, suggesting that CPNE1 might be a promising therapeutic target in CRC.
Metastasis and recurrence are the most common causes of mortality in CRC patients [25]. Epithelial-mesenchymal transition (EMT) is considered a critical step in the development of cancer, particularly in the ability of early-stage cancers to become invasive. EMT is characterized by changes in gene expression levels, including those of Slug and Snail, and is crucial for morphogenesis during embryonic development and the transformation of early-stage cancers into invasive malignancies [2627]. The relationship between C2 domain and CRC metastasis has been investigated previously [28]. The interaction of the C2 domain of DAB2IP with both PP2A and GSK-3β inhibits EMT by promoting GSK-3β activation through S9 dephosphorylation in prostate cancer [29]. Myoferlin promotes metastasis in patients with triple-negative breast cancer via C2 domain [30]. However, the effect of CPNE1 on EMT in CRC is poorly understood. The present study showed that silencing CPNE1 in CRC cells impairs their ability to migrate and invade, and it also downregulates the protein expression of vimentin, slug, and snail, which are all EMT-related biomarkers. These results suggest that CPNE1 may play a role in metastasis by reducing the expression of EMT-related biomarkers.
The present study demonstrated that CPNE1 expression is significantly upregulated in CRC and that higher expression levels of CPNE1 are associated with higher tumor invasiveness and lymph node and distant metastasis. Moreover, investigating the function of CPNE1 in regulating cell growth, gap closure, invasion, and tumor growth proved that CPNE1 knockdown inhibited cancer progression in CRC. Therefore, targeting CPNE1 could be a promising new strategy for treating CRC patients. However, more research is needed to fully understand the role of CPNE1 in cancer progression and to determine the most effective way to target this gene for the therapeutic benefit of CRC patients. This can be accomplished by identifying new potential therapeutic targets that are associated with CPNE1 and determining the best follow-up treatments to use in combination with CPNE1 targeting.
 XML Download