

 PDF
PDF Citation
 Print
Print


INTRODUCTION
MATERIALS AND METHODS
Participant characteristics
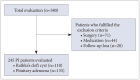
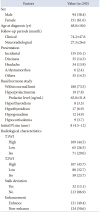
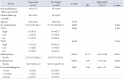
Table 1
Participant demographics and baseline clinical and radiological Findings
![]()
MR imaging protocol and analysis
Basal hormone study
Ophthalmologic examination
Follow-up evaluation
Statistical analyses
Ethics statement
RESULTS
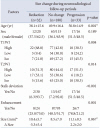
Table 2
Comparison of radiological features according to change in PI size (n=245)
![]()
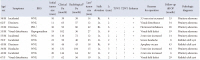
Table 3
Characteristics of patients who underwent surgery
![]()
PI size changes during neuroradiological follow-up period
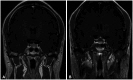 | Fig. 2A pituitary incidentaloma (PI) in a 44-year-old male patient undergoing investigations for dizziness. The PI increased over 43 months. The initial size of the PI was 10 mm (A) and 18 mm at 43 months (B). The initial image of coronal T1-weighted with enhancement showed stalk deviation to the left.
|
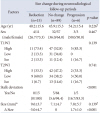
Table 4
Relations between baseline characteristics and PI growth (progression group vs. reduction/no change group)
Data are presented as mean±standard deviation or n (%) unless otherwise indicated. *Tumor size that reduced or not changed; †Owing to redundancy of factors used in the multivariate analysis by logistic regression model, univariate analysis was performed initially and factors found to be statistically significant in univariate analysis were then subjected to multivariate analysis. HR, hazard ratio; CI, confidence interval; PI, pituitary incidentaloma; T1WI, T1-weighted image; T2WI, T2-weighted image
![]()
 | Fig. 3A pituitary incidentaloma (PI) in a 60-year-old female patient undergoing vision testing. The size of the PI decreased over 42 months. The initial PI size was 11 mm. At 42 months, the lesion remarkably regressed. The sagittal T1-weighted section showed hyperintense signal (A) and the sagittal T2-weighted section showed hypointense signal (B). T1-weighted with enhancement showed thin rim enhancement (C).
|
Table 5
Characteristics of patients with presumptive RCC in reduction, no change, and progression groups
![]()
Table 6
Characteristics of patients with presumptive PA in reduction, no change, and progression groups
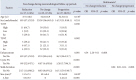
Data are presented as mean±standard deviation or n (%) unless otherwise indicated. *Size at initial diagnosis, mean (mm); Δ, latest tumor size – initial tumor size; †Analysis of variance was performed to compare means of comparison groups; ‡Owing to redundancy of factors used in the multivariate analysis by a multinomial logistic regression model, univariate analysis was performed initially. Factors found to be statistically significant in univariate analysis were then subjected to multivariate analysis. PA, pituitary adenoma; CI, confidence interval; OR, odds ratio; T1WI, T1-weighted image; T2WI, T2-weighted image
![]()
 XML Download