INTRODUCTION
MATERIALS AND METHODS
Study participants
Imaging postprocessing and analysis
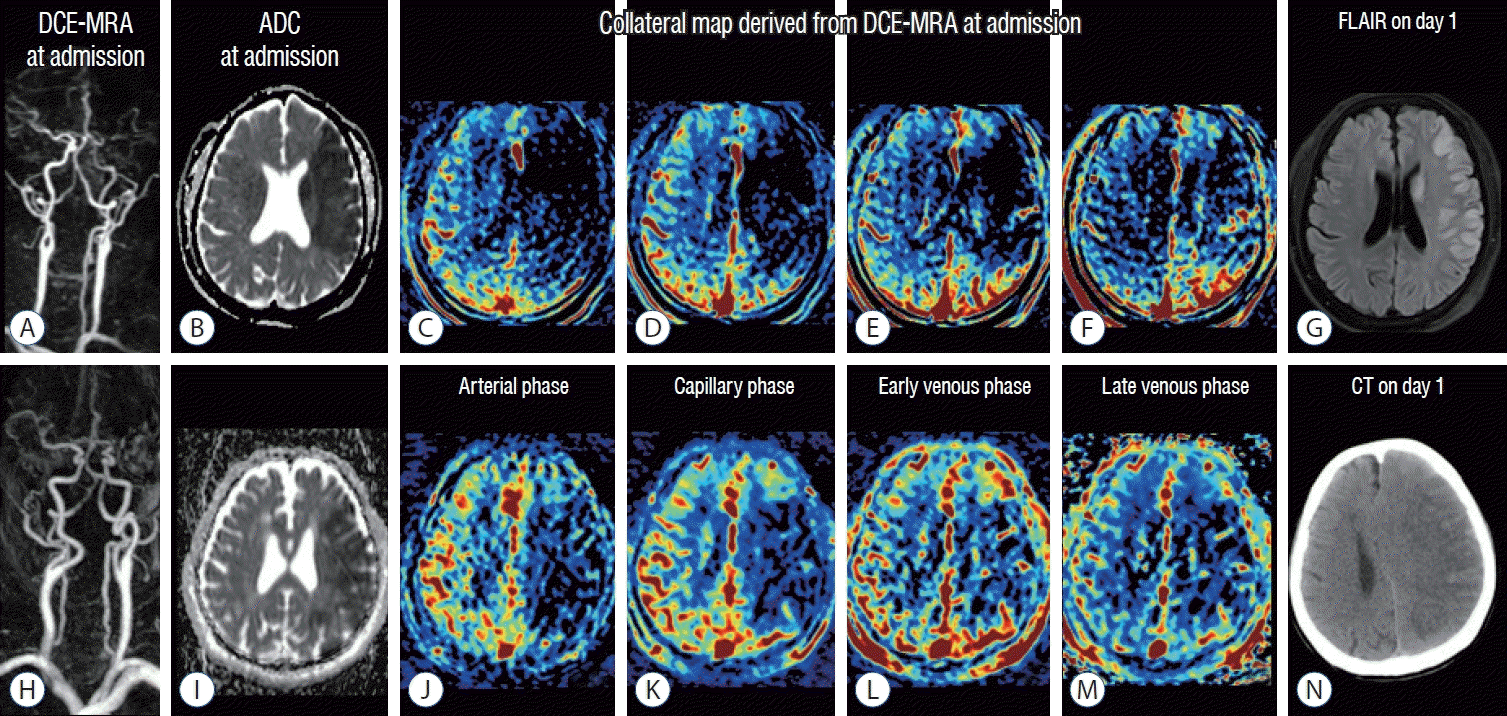
 | Fig. 1.images of a man in his 50s (A-g) and a man in his 80s (h-n). The premorbid modified Rankin scale (mRS) score was 0 in both patients, and the national institutes of health Stroke Scale scores were 9 and 18, respectively. both patients underwent intravenous thrombolysis followed by endovascular thrombectomy, and successful reperfusion was achieved, as shown by a modified Thrombolysis in cerebral infarction Tici (mTici) scale score of 2c at 1.5 hours from symptom onset in the patient aged 50−59 and by a mTici scale score of 3 at 4 hours from symptom onset in the patient aged 80−89. dynamic contrast-enhanced magnetic resonance (mR) angiography (dce-mRA in [A and h]) at admission showed steno-occlusion of the left middle cerebral arteries (mcAs), and apparent diffusion coefficient (Adc) images (b and i) at admission showed similar size baseline lesions in the left mcA territories. The collateral maps derived from dce-mRA (c-f and j-m) of both patients show very poor collateral perfusion status (mAc 0 : collateral perfusion delay/defect more than one-half of the mcA territory in the late venous phase regardless of collateral perfusion status at previous phases) [7,21]. fluid-attenuation inversion recovery magnetic resonance image (flAiR) on day 1 in the patient in his 50s (g) shows a decreased extent of the baseline lesion. The 90-day mRS score of this patient was 2. computed tomography (cT) image on day 1 in the patient in his 80s shows progression of malignant edema (n). The 90-day mRS score of this patient was 5. |
Statistical analysis
Table 1.
| Characteristic | MAC 0 | MAC 1 | MAC 2 | MAC 3 | MAC 4–5 | p-value |
|---|---|---|---|---|---|---|
| No. of patients | 38 (17.8) | 44 (20.6) | 76 (35.5) | 36 (16.8) | 20 (9.3) | |
| Age (years) | 72.5±10.8 | 69.7±11.0 | 68.9±13.9 | 71.6±12.2 | 70.2±11.0 | 0.612 |
| Men | 27 (71.1) | 26 (59.1) | 44 (57.9) | 19 (52.8) | 13 (65.0) | 0.544 |
| Glucose at admission (mg/dL) | 137 (116–160) | 126 (113–153) | 124 (108–149) | 129 (110–175) | 133 (113–182) | 0.611 |
| Systolic blood pressure at admission (mmHg) | 151.8±28.8 | 145.5±28.4 | 146.6±21.4 | 159.8±20.3 | 150.1±31.1 | 0.080 |
| Diastolic blood pressure at admission (mmHg) | 82.8±19.7 | 85.8±17.4 | 84.5±16.1 | 87.3±16.1 | 87.4±16.2 | 0.776 |
| Risk factor | ||||||
| Hypertension | 25 (65.8) | 28 (63.6) | 48 (63.2) | 20 (55.6) | 12 (60.0) | 0.911 |
| Diabetes | 12 (31.6) | 6 (13.6) | 27 (35.5) | 12 (33.3) | 7 (35.0) | 0.126 |
| Hyperlipidemia | 10 (26.3) | 8 (18.2) | 18 (23.7) | 7 (19.4) | 6 (30.0) | 0.800 |
| Atrial fibrillation | 24 (63.2) | 28 (63.6) | 40 (52.6) | 15 (41.7) | 7 (35.0) | 0.090 |
| Current smoker | 6 (15.8) | 5 (11.4) | 17 (22.4) | 5 (13.9) | 4 (20.0) | 0.574 |
| Daily alcohol consumption | 4 (10.5) | 2 (4.5) | 2 (2.6) | 1 (2.8) | 1 (5.0) | 0.432 |
| Previous transient ischemic attack | 1 (2.6) | 0 (0.0) | 0 (0.0) | 1 (2.8) | 1 (5.0) | 0.117 |
| Previous stroke | 3 (7.9) | 6 (13.6) | 13 (17.1) | 3 (8.3) | 4 (20.0) | 0.493 |
| Previous ischemic heart disease | 6 (15.8) | 6 (13.6) | 13 (17.1) | 3 (8.3) | 3 (15.0) | 0.808 |
| Family history of stroke | 1 (2.6) | 1 (2.3) | 1 (1.3) | 0 (0.0) | 0 (0.0) | 1.000 |
| Baseline NIHSS | 15 (11–18) | 13 (10–17) | 12 (8–15) | 6 (4–11) | 8 (6–12) | <0.001 |
| Baseline DWI lesion volume (mL) | 112 (41–135) | 18 (10–42) | 12 (5–27) | 6 (3–11) | 3 (2–9) | <0.001 |
| Treatment | 0.160 | |||||
| EVT | 15 (39.5) | 23 (52.3) | 41 (53.9) | 24 (66.7) | 13 (65.0) | |
| Intravenous thrombolysis followed by EVT | 23 (60.5) | 21 (47.7) | 35 (46.1) | 12 (33.3) | 7 (35.0) | |
| Onset-to-door time (minutes) | 39 (25–68) | 38 (25–83) | 46 (30–134) | 54 (29–150) | 56 (29–197) | 0.237 |
| Onset-to-puncture time (minutes) | 183 (137–238) | 150 (125–205) | 165 (135–275) | 170 (140–338) | 240 (138–301) | 0.364 |
| Onset-to-reperfusion time (minutes) | 223 (183–280) | 210 (158–285) | 210 (165–326) | 235 (179–337) | 260 (195–377) | 0.506 |
| Door-to-puncture time (minutes) | 128 (89–170) | 100 (86–124) | 101 (84–120) | 110 (93–170) | 109 (97–170) | 0.065 |
| Puncture-to-reperfusion time (minutes) | 45 (25–65) | 35 (25–70) | 40 (21–63) | 50 (32–85) | 35 (21–86) | 0.183 |
| Door-to-reperfusion time (minutes) | 180 (133–245) | 159 (119–181) | 141 (118–180) | 176 (128–231) | 174 (130–255) | 0.092 |
| Reperfusion status* | 0.414 | |||||
| Successful reperfusion | 30 (78.9) | 41 (93.2) | 65 (85.5) | 30 (83.3) | 18 (90.0) | |
| Failed Reperfusion | 8 (21.1) | 3 (6.8) | 11 (14.5) | 6 (16.7) | 2 (10.0) |
Values are presented as mean±standard deviation, median (interquartile range), or number of participants (%). Mean overall patient age was 70±12 years (129 men and 85 women).
RESULTS
Participant characteristics and collateral perfusion grading
Predictors of unfavorable functional outcomes after EVT
Table 2.
|
Univariable model |
Multivariable model |
|||
|---|---|---|---|---|
| OR (95% CI) | p-value | OR (95% CI) | p-value | |
| Age, per 10-year increment | 2.37 (1.72–3.27) | <0.001 | 2.40 (1.56–3.67) | <0.001 |
| Men | 0.45 (0.25–0.79) | 0.006 | 0.46 (0.20–1.02) | 0.057 |
| Systolic blood pressure at admission | 1.13 (1.01–1.27) | 0.028 | ||
| Risk factor | ||||
| Hypertension | 1.83 (1.01–3.32) | 0.045 | ||
| Diabetes | 2.00 (1.10–3.63) | 0.024 | ||
| Current smoker | 0.49 (0.22–1.10) | 0.085 | ||
| Baseline NIHSS, per 1 unit increment | 1.15 (1.08–1.21) | <0.001 | 1.12 (1.04–1.21) | 0.004 |
| Baseline DWI lesion volume (mL), per 10 units increment | 1.21 (1.12–1.31) | <0.001 | 1.06 (0.96–1.18) | 0.264 |
| Collateral perfusion grade | ||||
| MAC 0 | 46.61 (7.20–301.67) | <0.001 | 35.09 (3.50–351.33) | 0.002 |
| MAC 1 | 5.57 (0.90–34.34) | 0.064 | 6.46 (0.78–53.42) | 0.083 |
| MAC 2 | 6.06 (1.03–35.53) | 0.046 | 7.27 (0.98–53.77) | 0.052 |
| MAC 3 | 5.86 (0.93–36.96) | 0.060 | 7.53 (0.95–59.88) | 0.056 |
| MAC 4–5 | Reference | Reference | ||
| p-value for trend† | <0.001 | 0.005 | ||
| Onset-to-reperfusion time (minutes)‡, per 10 units increment | 1.03 (1.00–1.05) | 0.056 | ||
| Puncture-to-reperfusion time (minutes)‡, per 10 units increment | 1.09 (1.00–1.18) | 0.054 | ||
| Door-to-puncture time (minutes), per 10 units increment | 1.06 (1.01–1.11) | 0.011 | 1.08 (1.02–1.14) | 0.009 |
| Door-to-reperfusion time (minutes)‡, per 10 units increment | 1.07 (1.02–1.11) | 0.003 | ||
| Reperfusion status§ | ||||
| Successful reperfusion | Reference | Reference | ||
| Failed reperfusion | 4.24 (1.87–9.61) | <0.001 | 3.73 (1.30–10.76) | 0.015 |
* Unfavorable functional outcome was defined as a modified Rankin scale score of 4 or greater at day 90.
† p-values for linearity of the relationship between collateral perfusion grades and functional outcomes.
‡ Variables are not applicable in multivariable analyses despite of clinical significance and significant result in univariable analysis because of lack of those variables in some participants with unclear onset or failed reperfusion. We could include 166 participants, 198 participants, and 200 participants among 214 participants for univariable analysis of onset-to-reperfusion time, puncture-to-reperfusion time, and door-to-reperfusion time, respectively.
Table 3.
|
Univariable model |
Multivariable model |
|||
|---|---|---|---|---|
| OR (95% CI) | p-value | OR (95% CI) | p-value | |
| Age, per 10 year increment | 2.55 (1.75–3.72) | <0.001 | 2.30 (1.44–3.67) | <0.001 |
| Men | 0.54 (0.29–1.02) | 0.057 | 0.55 (0.23–1.32) | 0.182 |
| Systolic blood pressure at admission | 1.14 (1.01–1.29) | 0.035 | ||
| Risk factors | ||||
| Hypertension | 2.26 (1.14–4.46) | 0.035 | ||
| Diabetes | 1.96 (1.00–3.84) | 0.049 | ||
| Baseline NIHSS, per 1 unit increment | 1.14 (1.07–1.22) | <0.001 | 1.12 (1.03–1.22) | 0.006 |
| Baseline DWI lesion volume (mL), per 10 units increment | 1.21 (1.11–1.33) | <0.001 | 1.09 (0.98–1.23) | 0.122 |
| Collateral perfusion grade | ||||
| MAC 0 | 10.17 (4.08–25.39) | <0.001 | 4.96 (1.42–17.37) | 0.012 |
| MAC 1–5 | Reference | Reference | ||
| Onset-to-reperfusion time (minutes)‡, per 10 units increment | 1.03 (1.00–1.05) | 0.060 | ||
| Puncture-to-reperfusion time (minutes), per 10 units increment | 1.05 (0.96–1.16) | 0.309 | ||
| Door-to-puncture time (minutes)§, per 10 units increment | 1.06 (1.01–1.12) | 0.019 | ||
| Door-to-reperfusion time (minutes)§, per 10 units increment | 1.06 (1.01–1.10) | 0.012 | 1.09 (1.03–1.15) | 0.003 |
* Unfavorable functional outcome was defined as a modified Rankin scale score of 4 or greater at day 90.
† Successful reperfusion was defined as modified Thrombolysis in cerebral infarction score of 2b to 3 after endovascular thrombectomy.
‡ Onset-to-reperfusion time is not applicable in multivariable analyses despite of clinical significance because of lack of this variable in some participants with unclear onset. We could include 155 participants among 184 participants for univariable analysis of onset-to-reperfusion time.
Predictors of favorable functional outcomes in participants with very poor collateral perfusion status (MAC 0)
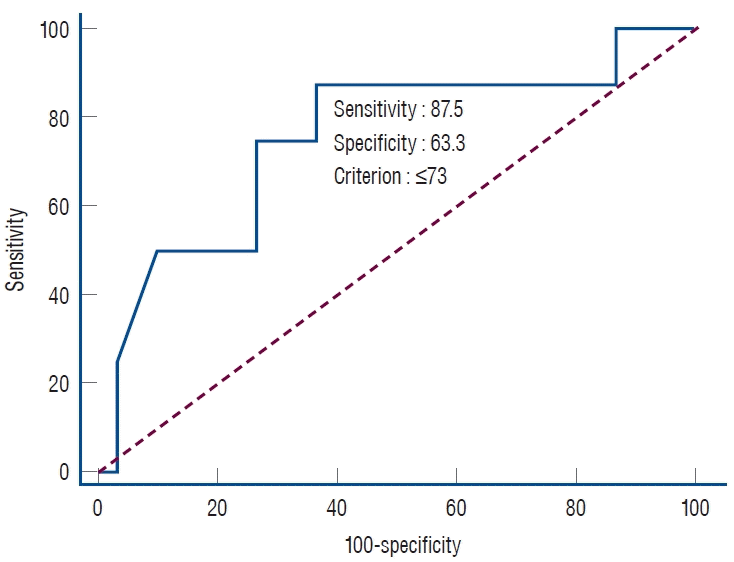
 | Fig. 3.An ROc curve was applied to analyze the efficacy of age for the prediction of favorable functional outcomes in participants with a collateral perfusion grade of mAc 0 after eVT. ROc : receiver operating characteristic, mAc : mR acute ischemic stroke collateral, eVT : endovascular thrombectomy. |


 PDF
PDF Citation
 Print
Print


 XML Download