

 PDF
PDF Citation
 Print
Print


INTRODUCTION
Polycythemia vera (PV) is a myeloproliferative neoplasm (MPN) characterized by clonal myeloid stem cell proliferation driven by somatic driver mutations in Janus kinase-2 (JAK-2).123 It exhibits a distinct natural history marked by a high incidence of thrombosis and a propensity to transform into more advanced myeloid malignancies, such as post-PV myelofibrosis, myelodysplastic syndrome (MDS), and acute myeloid leukemia (AML).4567 The current therapeutic approach for PV primarily aims to reduce the risk of thrombotic events through the use of phlebotomy and cytoreductive agents due to limited options for altering the disease’s natural course.8 While phlebotomy and low-dose aspirin are considered the initial standard of care, cytoreduction using therapeutic drugs is recommended for high-risk and symptomatic low-risk patients.9 Hydroxyurea (HU) is commonly employed as a first-line cytoreductive agent due to its effective activity in reducing cell proliferation and generally acceptable safety profile.91011
However, previous retrospective studies have demonstrated that 5–11% of PV patients experience resistance to HU (HU-R), while approximately 5–13% of patients are intolerant to HU (HU-I) due to undesirable side effects.11121314 Inadequate control of blood counts resulting from various factors, including HU-R or HU-I, is associated with unfavorable clinical outcomes.15 Nevertheless, there is limited data available on the prognostic factors among these patients who develop HU-R or HU-I. Direct comparisons between patients with HU-R and HU-I have not been conducted, and prognostic factors related to clinical outcomes, such as thrombosis, bleeding, disease progression, and survival, remain unclear for patients experiencing HU-R or HU-I.13 Currently, the therapeutic options for both groups of patients do not differ, and most clinical trials investigating second-line therapies have enrolled patients with HU-R or HU-I without considering potential clinical distinctions between the two groups.9 This study aims to compare the clinical outcomes of these two groups and identify prognostic factors to facilitate clinical decision-making and patient monitoring.
METHODS
Study patients
Among patients diagnosed with PV according to the World Health Organization classification in nine centers of the MPN working party of the Korean Society of Hematology, patients who received cytoreductive therapy with HU and met HU-R/I criteria as defined by the European LeukemiaNet (ELN) were enrolled in this study.16 The study patients with HU-R/I were identified through medical records from the period 2013–2022. The main clinical and laboratory data at the time of PV diagnosis and the development of HU-R/I, including age, sex, cardiovascular risk factors (diabetes, hypertension, smoking, and hyperlipidemia), history of thrombosis, hemoglobin level, leukocyte count, platelet count, serum erythropoietin level, and JAK-2 mutation, were collected for all patients. Lactate dehydrogenase (LDH) levels were collected and calculated as the fold increase above the upper limit of normal. Information on second-line treatment was also collected. Thrombosis and bleeding occurrences, progression to more advanced hematologic malignancy, and causes of death were assessed.
Definitions
Thrombosis was defined according to the International Classification of Diseases, 9th revision. Minor occlusive events, such as erythromelalgia and superficial thrombophlebitis of the extremities, were not considered thrombosis events. Major bleeding was defined as symptomatic bleeding in a critical organ or overt bleeding causing a decrease in the hemoglobin level of more than 2.0 g/dL.17 Response to HU was categorized using ELN criteria.1618 HU-R and HU-I were defined as fulfilling at least one of the criteria. Among the five criteria, need for phlebotomy, uncontrolled myeloproliferation, and failure to reduce spleen size were defined as “HU-R,” while leg ulcer and other hydroxyurea-related toxicity were defined as “HU-I.” In our present study, cytopenia at the lowest dose of HU required to achieve a complete response was defined as HU-R.
Statistical analyses
We evaluated the characteristics and outcomes of HU-R/I patients, including the cumulative incidence of progression to myelofibrosis, MDS, or AML, the cumulative incidence of thrombosis, and survival. Prognostic factors were identified for thrombosis-free survival (TFS), progression-free survival (PFS), and overall survival (OS) after HU-R/I occurrence in the study patients.
The characteristics of the patients who had HU-R and HU-I were compared using the χ2 test or the Mann-Whitney U test. Progression and thrombosis curves were plotted according to cumulative incidence estimates and compared with the Gray test. The TFS, PFS, and OS probabilities were calculated using Kaplan-Meier estimates and compared between the two groups using the log-rank test. Survival analyses and time-to-event curves were calculated from the date of HU-R/I occurrence. Multivariate analysis with Cox’s proportional hazard regression was used to define the prognostic factors for thrombosis, progression, TFS, PFS, and OS using the backward method. The variables included in the multivariate analysis were study group (HU-R vs. HU-I), age (≥ 65 vs. < 65 years), gender (male vs. female), LDH level (higher vs. lower), number of cardiovascular risk factors (≥ 2 vs. < 2), and prior thrombosis (yes vs. no). Continuous variables were categorized into dichotomous variables using a median split when multivariate analysis was conducted. P values were determined by two-sided tests, and P values of < 0.05 were considered statistically significant. Analyses were performed using the Statistical Package for the Social Sciences, version 28.0 (SPSS 28.0; IBM Corp., Chicago, IL, USA).
Ethics statement
This study was designed by the MPN working party of the Korean Society of Hematology, approved by the Institutional Review Board of Konkuk University Medical Center (KUH 2022-05-058), and conducted in accordance with the Declaration of Helsinki. Informed consent was waived because of the retrospective nature of the study.
RESULTS
Patients and treatment
A total of 90 patients with HU-R/I were enrolled in this study. Among them, 44 and 46 patients fulfilled the ELN criteria defining HU-R or HU-I, respectively. The main clinical and hematological characteristics of the patients at the time of developing HU-R/I are listed in Table 1. A maximal HU dose of 1,350 ± 551 mg/day was used to try to maintain hematocrit levels below 45% without significant intolerance. Of the 90 patients, 83 (92.2%) received low-dose aspirin during treatment with HU.
Table 1
Patient characteristics at the time of development of resistance or intolerance

Among the 44 patients in the HU-R group, at least one of the criteria defining resistance developed 5.8 ± 5.3 years after HU treatment. Seven patients developed uncontrolled myeloproliferation despite having received 2 g/day of HU for more than three months. Thirty-seven patients developed neutropenia (absolute neutrophil count < 1 × 10⁹/L), anemia (haemoglobin < 10.0 g/dL), or thrombocytopenia (platelet count < 100 × 109/L) at the lowest dose of HU required to achieve a hematologic complete response.
Forty-six patients in the HU-I group met the criteria of HU-I 4.0 ± 3.4 years after HU treatment. Seven patients developed leg ulcers at a median HU dose of 1,000 mg/day (range 750–1,500). Other unacceptable mucocutaneous manifestations occurred in 20 patients at various HU doses ranging from 250 mg to 2,000 mg/day (median, 1,125 mg/day). Nine patients had intolerant gastrointestinal symptoms, and four patients developed other intolerant side effects related to HU.
Patients with HU-R were older at the time of diagnosis of PV (66.7 ± 13.2 years, vs. 59.8 ± 11.2 years in the HU-I group, P = 0.016), had longer times to developing HU-R/I, and thus, were older at the time of HU-R/I development compared with those with HU-I (Table 1). There was a trend toward a lower HU maximal dosage taken in the HU-I group compared to the HU-R group. The majority of the study patients continued HU treatment with dose modification or intermittent discontinuation with anagrelide added to control platelet counts until disease progression or death because of limited second-line treatment options during the observed period. HU was changed to either interferon or ruxolitinib in 11 of 90 study patients. There was no difference in the proportion of patients receiving non-HU second-line treatment between the two groups (P = 0.316).
Risk of thrombosis and disease progression
After HU-R/I development, seven (7.8%) of the study patients experienced thrombotic events (Table 2), including cerebral infarction (n = 3), mesenteric infarction (n = 1), myocardial infarction (n = 2), and peripheral arterial thromboembolism (n = 1). The type of thrombosis did not differ between the two groups (P = 0.628). The cumulative incidence of thrombosis seven years after HU-R/I was estimated at 19.0% in the HU-R group and 22.9% in the HU-I group (P = 0.463; Fig. 1A).
Table 2
Outcomes after development of HU-R or HU-I in study patients

HU-R = hydroxyurea-resistance, HU-I = hydroxyurea-intolerance, F/U = follow-up, MF = post-polycythemia vera myelofibrosis, MDS = myelodysplastic syndrome, AML = acute myeloid leukemia.
aOne patient in the HU-R group progressed to MF, MDS, and AML sequentially.
bOne patient in the HU-I group progressed to MF and AML sequentially.
Fig. 1
Cumulative incidence of thrombosis (A) and disease progression (B) of polycythemia vera patients after developing HU-R or HU-I.
HU-R = hydroxyurea-resistance, HU-I = hydroxyurea-intolerance.
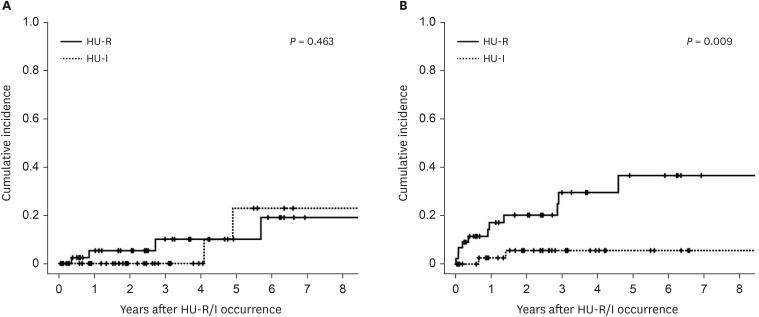
Fourteen patients had disease progression after HU-R/I development. Five patients developed either MDS (n = 4) or AML (n = 1) without experiencing myelofibrosis. Nine (9.9%) patients developed myelofibrosis, of whom one patient group progressed to MDS and another progressed to MDS and AML sequentially. The period of time from HU-R/I development to disease progression was 11.1 months (range 0.12–193.5). The cumulative incidence of progression at seven years after HU-R/I occurrence was 22.5%. The HU-R group showed a higher cumulative incidence of progression at seven years compared to the HU-I group (36.7% vs. 0.56% in the HU-I group, P = 0.009; Fig. 1B).
Survival rates and causes of death
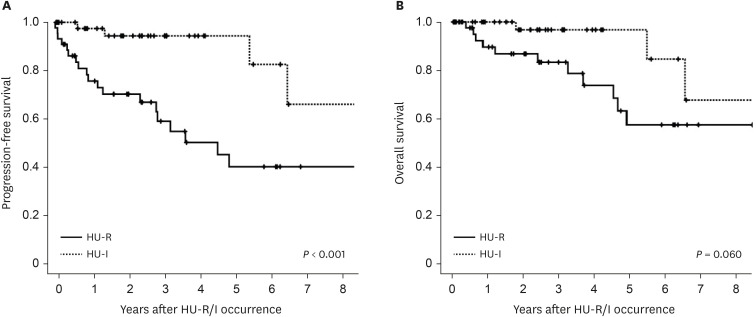
The seven-year probability of TFS, PFS, and OS for the study patients was 56.6 ± 9.2%, 51.8 ± 9.4%, and 62.1 ± 9.6%, respectively. The patients in the HU-R group had significantly lower PFS (40.2% vs. 66.1% in the HU-I group, P < 0.001; Fig. 2A). They also showed a trend toward lower TFS (51.0% vs. 62.1% in the HU-I group; P = 0.055) and lower OS (57.5% vs. 67.7% in the HU-I group; P = 0.060; Fig. 2B) compared to patients with HU-I.
Fig. 2
Progression-free survival (A) and overall survival (B) of polycythemia vera patients after developing HU-R or HU-I.
HU-R = hydroxyurea-resistance, HU-I = hydroxyurea-intolerance.
Fourteen patients died during the observation period (Table 2). In the HU-R group, two patients died of AML, and the others died of infections (n = 5), vascular complications (n = 2), breast cancer (n = 1), and an unknown cause (n = 1). In the HU-I group, all three patients died of infection. The mortality at seven years was 42.5% in the HU-R group and 32.3% in the HU-I group (P = 0.06).
Predictors of thrombosis, progression, and survival
Univariate and multivariate analyses were performed to identify independent risk factors for disease progression and thrombosis after the development of HU-R/I (Table 3). HU-R was identified as an independent risk factor for disease progression (hazard ratio [HR], 5.57, 95% confidence interval [CI], 1.22–25.54, P = 0.027), while the analyses did not identify any risk factors for thrombosis.
Table 3
Risk factors for thrombosis and disease progression after development of HU-R or HU-I

HR = hazard ratio, CI = confidence interval, LDH = lactate dehydrogenase, HU-R = hydroxyurea-resistance, HU-I = hydroxyurea-intolerance, NS = not significant.
a“Higher” means more than 1.32-fold of upper normal limit (median value of all study patients).
bCardiovascular risk factors: diabetes, smoking, dyslipidemia, and hypertension.
cLonger lead time is defined as more than 3.9 years from diagnosis of polycythemia vera to development of HU-R/I (median value of all study patients).
Regarding survival, HU-R remained an independent risk factor for PFS after adjusting for other potential confounding factors (HR, 6.27, 95% CI, 1.83–21.47, P = 0.003; Table 4). The independent predictors for unfavorable OS were prior thrombosis (HR, 5.50, 95% CI, 1.56–19.45, P = 0.008), higher LDH levels (HR, 6.56, 95% CI, 1.53–28.04, P = 0.011), and more than one cardiovascular risk factor (HR, 4.03, 95% CI, 1.10–14.73, P = 0.035). Neither univariate nor multivariate analysis identified any predictors of TFS.
Table 4
Prognostic factors for progression-free survival and overall survival

HR = hazard ratio, CI = confidence interval, LDH = lactate dehydrogenase, HU-R = hydroxyurea-resistance, HU-I = hydroxyurea-intolerance, NS = not significant.
a“Higher” means more than 1.32-fold of upper normal limit (median value of all study patients).
bCardiovascular risk factors: diabetes, smoking, dyslipidemia, and hypertension.
cLonger lead time is defined as more than 3.9 years from diagnosis of polycythemia vera to development of HU-R/I (median value of all study patients).
DISCUSSION
The survival of PV patients with HU-R/I was unfavorable. The probability of OS was 62.1% seven years after the development of HU-R or HU-I. Almost all participants in the study had to continue HU treatment with dose adjustments or intermittent discontinuation even after developing HU-R or HU-I. This was due to limited second-line treatment options for HU-R/I patients in Korea, as ruxolitinib and interferon use were restricted by the National Public Health Insurance Service. Therefore, our data provide insights into the clinical course of PV patients with HU-R/I who did not receive second-line therapeutic agents. Previous studies have shown that inadequate control of hematocrit and leukocyte counts increases the risk of thrombosis and mortality, which may partially explain the unfavorable survival outcomes observed in our study patients.1219
Importantly, patients with HU-R had a higher risk of disease progression and lower PFS compared to patients with HU-I. However, the risk of thrombosis and time to first thrombotic event were similar between the two groups. Previous research suggested that HU-R in PV patients was associated with the acquisition of non-driver genetic mutations, implying a higher likelihood of disease progression compared to patients with HU-I.20 The risk of thrombosis was linked to suboptimal control of blood counts; hence, there was no significant difference in thrombosis risk between the patient groups. In our study cohort, a limited subset of patients received ruxolitinib and interferon as their second-line therapeutic interventions. To mitigate potential confounding effects stemming from interferon and ruxolitinib treatment when comparing the HU-R and HU-I groups, we conducted a parallel analysis exclusively on patients who did not undergo interferon or ruxolitinib treatment. Remarkably, this secondary analysis yielded congruent results to those obtained when analyzing the entire study population. Furthermore, a minority of patients were excluded from aspirin treatment based on the discretion of their attending physicians. To ensure consistency, we confined our analysis solely to patients who were administered aspirin, and this sub-analysis also exhibited concordant results with our primary findings.
No statistical difference in OS was seen between the two groups despite the difference in progression risk because both HU-R and HU-I patients had similar major causes of death, primarily infections. Although the difference in OS between the two groups did not differ significantly, there was a trend toward lower OS in HU-R patients (HR, 3.21, 95% CI, 0.89–11.55, P = 0.074). The fact that infections, thrombosis, and disease progression were the main causes of death in our study population suggests that various factors can influence the survival of HU-R/I patients. Multivariate analysis revealed that high LDH levels, more than one cardiovascular risk factor, and prior thrombosis were predictors of unfavorable OS. Our study identified higher LDH levels at the time of HU-R or intolerance development as a prognostic factor for poorer OS. This finding aligns with previous research suggesting that LDH levels at the time of PV diagnosis could serve as a prognostic biomarker.21 The relationship between elevated LDH levels and patient survival has not been fully elucidated. Elevated LDH levels are associated with infection, organ damage caused by thrombosis, and more advanced or aggressive disease. In our study, causes of death included infections, thrombosis, and AML, which partially explains why higher LDH levels were associated with lower OS in our patient cohort.
We compared the characteristics of patients with HU-R and HU-I at the time of developing HU-R/I. Patients with HU-R were older at the time of PV diagnosis compared to patients with HU-I (P = 0.016), indicating a higher prevalence of resistance among older patients. Furthermore, the development of resistance appeared to require a longer period of time compared to the development of intolerance (P = 0.055). Previous studies have suggested that longer disease duration and older age in PV patients are associated with a higher risk of disease progression.5 However, our study demonstrated that HU-R is a more reliable factor for disease progression in HU-R/I patients. Age at the time of HU-R/I development and lead time from diagnosis of PV to HU-R/I development were not significantly associated with disease progression or PFS.
According to the ELN criteria, it remains ambiguous whether the development of cytopenia, even at the minimal dose of HU required to achieve hematologic complete response, should be defined as resistance or intolerance.121618 Alvarez-Larrán et al.13 independently evaluated each of the five ELN criteria of HU-R/I. They identified the clinical significance of developing cytopenia at the lowest dose of HU necessary for a response, which was associated with poorer survival as well as an increased risk of progression to both myelofibrosis and acute leukemia. In our study, patients who developed cytopenia were categorized into the resistance group, and the largest number of patients in the HU-R group met this criterion. Our findings also support their suggestion that the development of cytopenia should be categorized as resistance rather than intolerance.
Due to the limited number of patients in our study, we were unable to analyze the impact of individual criteria defining resistance and intolerance on clinical outcomes. The ELN introduced a unified definition of resistance and intolerance to HU in 2009,1618 but it was later modified in clinical trials due to the dosing limitation of up to 2 g of HU in real-world patients.1522 The modified ELN criteria define the maximum tolerated dose as the threshold for resistance, rather than a fixed daily dose of 2 g of HU. Demuynck et al.23 reported that 4.7% of patients met the criteria for resistance, and 16.0% met the criteria for intolerance according to the original ELN criteria. However, none of the patients in their study received a minimum dose of 2 g of HU per day. In contrast, when applying the modified ELN criteria, 23.6% of patients were classified as resistant, and 16.0% were categorized as intolerant. Similarly, we also observed that a daily dose of 2 g was not tolerable for most Asian patients, making it challenging to identify HU-R patients according to the original ELN criteria. These findings suggest that the maximum tolerated dose should be applied to define resistance in real-world patients, as in the modified ELN criteria.1424
In conclusion, our findings indicate that patients with PV who developed HU-R demonstrated a higher incidence of disease progression and poorer survival outcomes compared to patients with HU-I. These results underscore the importance of accurately detecting HU-R in clinical decision-making pertaining to second-line treatment options. Given the limited availability of therapeutic choices, previous clinical studies typically included both resistant and intolerant patients for second-line therapeutics. However, our study suggests that future investigations examining treatment effects should consider differences in PFS and OS between the two patient groups, with the aim of mitigating thrombosis risk and altering the course of the disease.
 XML Download